云铝股份
Search documents
有色板块震荡走高 中孚实业涨停
Mei Ri Jing Ji Xin Wen· 2025-10-29 05:23
Core Viewpoint - The non-ferrous metal sector experienced a significant upward trend, particularly in the electrolytic aluminum segment, with notable gains among various companies [2] Group 1: Market Performance - The non-ferrous metal sector showed volatility but ultimately rose in the afternoon trading session [2] - The electrolytic aluminum sector led the gains, with Zhongfu Industrial hitting the daily limit up [2] - Companies such as China Aluminum, Hongchuang Holdings, Nanshan Aluminum, Shenhuo Co., and Yun Aluminum all saw their stock prices increase by over 6% [2]


云铝股份股价涨5.06%,国泰海通资管旗下1只基金重仓,持有30.96万股浮盈赚取34.37万元
Xin Lang Cai Jing· 2025-10-29 03:45
Core Viewpoint - Yun Aluminum Co., Ltd. has shown a significant stock price increase of 5.06%, reaching 23.06 CNY per share, with a total market capitalization of 79.971 billion CNY [1] Company Overview - Yun Aluminum Co., Ltd. is located in Kunming, Yunnan Province, and was established on March 20, 1998, with its listing date on April 8, 1998. The company’s main business includes bauxite mining, alumina production, aluminum smelting, aluminum processing, and the production of carbon products for aluminum [1] - The revenue composition of the company is as follows: 58.12% from electrolytic aluminum, 40.67% from aluminum processing products, and 1.21% from other sources [1] Fund Holdings - According to data from the top ten holdings of funds, one fund under Guotai Haitong Asset Management has a significant position in Yun Aluminum. The Guotai Haitong Vision Value Mixed Fund A (017935) increased its holdings by 231,800 shares in the third quarter, bringing the total to 309,600 shares, which accounts for 5.06% of the fund's net value, making it the fifth-largest holding [2] - The fund has generated an estimated floating profit of approximately 343,700 CNY today [2] Fund Performance - The Guotai Haitong Vision Value Mixed Fund A (017935) was established on March 1, 2023, with a latest scale of 77.7945 million CNY. Year-to-date, it has achieved a return of 12.38%, ranking 5552 out of 8155 in its category. Over the past year, it has returned 13.99%, ranking 4915 out of 8031, and since inception, it has returned 30.49% [2]
云铝股份股价涨5.06%,上银基金旗下1只基金重仓,持有10.5万股浮盈赚取11.65万元
Xin Lang Cai Jing· 2025-10-29 03:45
Group 1 - Yun Aluminum Co., Ltd. experienced a stock price increase of 5.06%, reaching 23.06 CNY per share, with a trading volume of 906 million CNY and a turnover rate of 1.15%, resulting in a total market capitalization of 79.971 billion CNY [1] - The company, established on March 20, 1998, and listed on April 8, 1998, is located in Kunming, Yunnan Province, and its main business activities include bauxite mining, alumina production, aluminum smelting, aluminum processing, and the production of carbon products for aluminum [1] - The revenue composition of the company is as follows: electrolytic aluminum accounts for 58.12%, aluminum processing products for 40.67%, and other revenues for 1.21% [1] Group 2 - The Shangyin Resource Selected Mixed Fund A (023448) has increased its holdings in Yun Aluminum by 45,400 shares in the third quarter, bringing the total to 105,000 shares, which represents 3.42% of the fund's net value, making it the sixth-largest holding [2] - The fund, established on March 21, 2025, has a latest scale of 21.9608 million CNY and has achieved a return of 47.46% since inception [2] Group 3 - The fund manager of Shangyin Resource Selected Mixed Fund A is Lu Yang, who has a tenure of 11 years and 3 days, with the fund's total asset size at 926 million CNY [3] - During Lu Yang's tenure, the best fund return was 59.02%, while the worst return was -29.25% [3]
低利率环境优选,同类规模最大的自由现金流ETF(159201)连续11天合计“吸金”5.38亿元
Mei Ri Jing Ji Xin Wen· 2025-10-29 03:40
Core Viewpoint - The A-share market indices have shown upward movement, with the Guozheng Free Cash Flow Index experiencing a notable increase, indicating a positive trend in companies with stable free cash flow [1] Group 1: Market Performance - On October 29, the A-share major indices rose, with the Guozheng Free Cash Flow Index fluctuating and increasing by approximately 0.45% during the trading session [1] - Leading stocks included Yun Aluminum Co., Shenhuo Co., China Aluminum, and Guodian Nanzi, which contributed to the index's performance [1] Group 2: Fund Inflows - The largest free cash flow ETF (159201) has seen continuous net inflows over the past 11 days, totaling 538 million yuan, bringing its latest scale to 5.043 billion yuan, a record high since its inception [1] Group 3: Investment Strategy - Huachuang Securities suggests that in a low-interest-rate environment, the compounding effect of stable free cash flow is a cornerstone for a long-term bull market [1] - The shift in economic operation models indicates a change in the long-term logic of stock market pricing, moving from front-end expansion to back-end cautious management and cash flow accumulation [1] Group 4: Fund Characteristics - The free cash flow ETF (159201) and its linked funds (A: 023917; C: 023918) closely track the Guozheng Free Cash Flow Index, focusing on listed companies with high and stable free cash flow levels in the Shanghai and Shenzhen stock exchanges [1] - These funds are characterized by higher long-term returns and lower volatility, making them suitable for allocation in the current phase of high-quality economic growth [1] - The management and custody annual fee rates of the funds are among the lowest in the market [1]
电力板块探底回升,央企现代能源ETF(561790)一度涨近2%,上海电力、中国西电、国网英大涨停
Sou Hu Cai Jing· 2025-10-29 03:40
Group 1 - The China Securities National New Central Enterprise Modern Energy Index has seen a strong increase of 1.80%, with constituent stocks such as Shanghai Electric rising by 10.00% and China Western Power by 9.99% [3] - The Central Enterprise Modern Energy ETF (561790) has risen by 1.69%, with a latest price of 1.26 yuan, and has accumulated a weekly increase of 2.31% as of October 28, 2025 [3] - The trading volume for the Central Enterprise Modern Energy ETF reached 460.61 million yuan, with a turnover rate of 9.7% [3] Group 2 - The Fujian Provincial Development and Reform Commission and the National Energy Administration have issued a plan to promote the market-oriented reform of renewable energy grid connection prices, aiming for all renewable energy generation to enter the electricity market by January 1, 2026 [4] - Tianfeng Securities notes that global grid capital expenditure is currently in a resonance cycle of "renewable energy grid connection + digital upgrade," indicating significant excess returns for the power equipment sector during upturns [4] - According to Zhongyin Securities, the new energy storage installation demand is expected to reach 12 GWh by 2026, representing a year-on-year growth of 60% [4] Group 3 - The Central Enterprise Modern Energy ETF closely tracks the China Securities National New Central Enterprise Modern Energy Index, which includes 50 listed companies involved in green energy, fossil energy, and energy transmission and distribution [5] - As of September 30, 2025, the top ten weighted stocks in the index accounted for 47.72% of the total, including companies like Yangtze Power and China Nuclear Power [5] - The latest scale of the Central Enterprise Modern Energy ETF reached 46.98 million yuan, marking a new high for the past month [4]
社保基金三季度抱团持有16股(附股)
Zheng Quan Shi Bao Wang· 2025-10-29 02:37
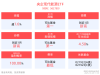
Core Insights - The Social Security Fund has disclosed its stock holdings as of the end of Q3, appearing in the top ten shareholders of 360 companies, with new investments in 108 companies and increased holdings in 93 companies [1][2] Group 1: Stock Holdings Overview - The total number of shares held by the Social Security Fund is 5.535 billion, with a total market value of 117.406 billion yuan [1] - The fund maintained its position in 49 companies, reduced holdings in 110 companies, and increased stakes in 93 companies [1] - The top three companies by shareholding are Sun Paper Industry (10.883 million shares), Weixing Co., Ltd. (7.314 million shares), and Guangxin Co., Ltd. (4.709 million shares) [1] Group 2: Shareholding Proportions - The highest shareholding proportion is in Norsun, with 8.16% of circulating shares, followed by Baiao Intelligent at 7.23% [1] - A total of 19 companies have over 50 million shares held by the Social Security Fund, with Vanadium Titanium Holdings leading at 170 million shares [1][2] Group 3: Performance of Held Stocks - Among the stocks held, 227 companies reported year-on-year net profit growth, with the highest increase seen in Xinqianglian at 1939.50% [2] - The average performance of the Social Security Fund's heavy stocks since October has seen a slight increase of 0.03%, underperforming the Shanghai Composite Index [2] - Notable performers include Beifang Changlong with a cumulative increase of 46.53%, while Guomai Culture experienced the largest decline at 41.78% [2] Group 4: Sector Distribution - The Social Security Fund's holdings are primarily concentrated in the pharmaceutical, machinery, and basic chemical industries, with 39, 36, and 34 companies respectively [2] - The distribution of holdings includes 244 companies on the main board, 86 on the ChiNext board, and 29 on the Sci-Tech Innovation board [2]
邓晓峰,加仓000786
Shang Hai Zheng Quan Bao· 2025-10-29 00:57
Core Viewpoint - Deng Xiaofeng, a well-known private equity fund manager at Gao Yi Asset, has made significant adjustments to his portfolio in the third quarter, notably increasing his stake in Beixin Building Materials while taking profits from other holdings like Zijin Mining and Yun Aluminum [1][10]. Group 1: Investment Actions - Deng Xiaofeng's Gao Yi Xiaofeng No. 2 Fund and Foreign Trade Trust - Gao Yi Xiaofeng Hongyuan Trust Plan entered the top ten circulating shareholders of Beixin Building Materials, holding 12.865 million shares and 11.948 million shares respectively, with a total market value of 533 million yuan [3][4]. - In the same period, the Gao Yi Xiaofeng No. 2 Fund reduced its holdings in Zijin Mining by 18.6 million shares, while the Foreign Trade Trust plan exited the top ten shareholders of Zijin Mining [10]. - The Gao Yi Xiaofeng No. 2 Fund and Foreign Trade Trust plan also reduced their stakes in Yun Aluminum by 4.8 million shares and 2.3 million shares respectively [10]. Group 2: Company Performance - Beixin Building Materials reported a revenue of 6.347 billion yuan for the third quarter, a decrease of 6.2% year-on-year, and a net profit attributable to shareholders of 656.8 million yuan, down 29.47% year-on-year [7][8]. - The company's stock price has declined over 20% year-to-date, reflecting ongoing market challenges [5]. - Despite the downturn, Beixin's waterproof and coating businesses are expanding, indicating potential for future growth [8]. Group 3: Market Trends - Many private equity firms are optimizing their portfolios in the third quarter, focusing on a balanced allocation across technology, cyclical, and dividend sectors [1][12]. - The market has seen rapid rotation, with structural overvaluation becoming a concern, prompting firms to adjust their holdings accordingly [13][14].

10月28日深证国企股东回报(970064)指数跌1.74%,成份股铜陵有色(000630)领跌
Sou Hu Cai Jing· 2025-10-28 12:22
Market Performance - The Shenzhen State-Owned Enterprises Shareholder Return Index closed at 1666.46 points, down 1.74% with a trading volume of 37.581 billion yuan and a turnover rate of 1.6% [1] - Among the index constituents, 9 stocks rose while 41 stocks fell, with Shenzhen Properties A leading the gainers at a 10.05% increase and Tongling Nonferrous Metals leading the decliners at a 10.07% decrease [1] Key Constituents - The top ten constituents of the Shenzhen State-Owned Enterprises Shareholder Return Index include: - BOE Technology Group (9.64% weight, latest price 4.06 yuan, -0.25% change, market cap 151.9 billion yuan) [1] - Wuliangye Yibin (7.95% weight, latest price 120.10 yuan, -0.16% change, market cap 466.18 billion yuan) [1] - Hikvision (7.72% weight, latest price 32.98 yuan, -2.71% change, market cap 302.26 billion yuan) [1] - Luzhou Laojiao (6.53% weight, latest price 130.49 yuan, +0.84% change, market cap 192.08 billion yuan) [1] - XCMG Machinery (6.28% weight, latest price 10.23 yuan, -4.03% change, market cap 120.23 billion yuan) [1] - Changan Automobile (3.87% weight, latest price 12.51 yuan, -0.79% change, market cap 124.03 billion yuan) [1] - Shenwan Hongyuan (3.78% weight, latest price 5.46 yuan, -1.09% change, market cap 136.72 billion yuan) [1] - Yunnan Aluminum (3.45% weight, latest price 21.95 yuan, -4.06% change, market cap 76.12 billion yuan) [1] - Yanghe Brewery (3.27% weight, latest price 69.63 yuan, -0.20% change, market cap 104.89 billion yuan) [1] - Changchun High & New Technology (3.17% weight, latest price 116.50 yuan, +0.31% change, market cap 47.53 billion yuan) [1] Capital Flow - The index constituents experienced a net outflow of 3.006 billion yuan from major funds, while retail investors saw a net inflow of 2.346 billion yuan [1] - Notable capital flows include: - Zhongcai Technology with a net inflow of 179 million yuan from major funds [2] - Shenzhen Properties A with a net inflow of 57.37 million yuan from major funds [2] - Changchun High & New Technology with a net inflow of 27.65 million yuan from major funds [2]

10月28日深证国企ESG(970055)指数跌0.5%,成份股云铝股份(000807)领跌
Sou Hu Cai Jing· 2025-10-28 12:22
Core Points - The Shenzhen State-owned Enterprise ESG Index (970055) closed at 1406.55 points, down 0.5%, with a trading volume of 38.737 billion yuan and a turnover rate of 1.15% [1] - Among the index constituents, 20 stocks rose while 29 stocks fell, with Zhongtung High-tech leading the gainers at a 10.02% increase, and Yun Aluminum leading the decliners with a 4.06% drop [1] Index Constituents Summary - The top ten constituents of the Shenzhen State-owned Enterprise ESG Index are as follows: - Hikvision (sz002415): Weight 9.64%, Latest Price 32.98, Change -2.71%, Market Cap 302.257 billion yuan, Industry: Computer [1] - BOE Technology Group (sz000725): Weight 9.31%, Latest Price 4.06, Change -0.25%, Market Cap 151.9 billion yuan, Industry: Electronics [1] - Wrigley (sz000858): Weight 8.62%, Latest Price 120.10, Change -0.16%, Market Cap 466.181 billion yuan, Industry: Food & Beverage [1] - Inspur Information (sz000977): Weight 7.30%, Latest Price 68.17, Change -0.35%, Market Cap 100.355 billion yuan, Industry: Computer [1] - Weichai Power (sz000338): Weight 6.78%, Latest Price 14.13, Change -0.28%, Market Cap 123.123 billion yuan, Industry: Automotive [1] - AVIC Optoelectronics (sz002179): Weight 4.48%, Latest Price 37.81, Change 0.19%, Market Cap 80.092 billion yuan, Industry: Defense [1] - Shenwan Hongyuan (sz000166): Weight 4.14%, Latest Price 5.46, Change -1.09%, Market Cap 136.718 billion yuan, Industry: Non-banking Financial [1] - Yun Aluminum (sz000807): Weight 4.08%, Latest Price 21.95, Change -4.06%, Market Cap 76.122 billion yuan, Industry: Non-ferrous Metals [1] - Changchun High-tech (sz000661): Weight 3.73%, Latest Price 116.50, Change 0.31%, Market Cap 47.525 billion yuan, Industry: Pharmaceuticals [1] - China Merchants Shekou (sz001979): Weight 3.31%, Latest Price 9.40, Change -0.84%, Market Cap 85.172 billion yuan, Industry: Real Estate [1] Capital Flow Analysis - The index constituents experienced a net outflow of 989 million yuan from institutional investors, while retail investors saw a net inflow of 1.076 billion yuan [1] - The detailed capital flow for selected stocks includes: - Zhongtung High-tech: Net inflow from institutions 509 million yuan, net outflow from retail -239 million yuan [2] - China National Materials: Net inflow from institutions 179 million yuan, net outflow from retail -176 million yuan [2] - Changchun High-tech: Net inflow from institutions 27.645 million yuan, net outflow from retail -130.24 million yuan [2]

有色金属行业双周报:贵金属价格大幅下跌,稀土价格回调-20251028
Guoyuan Securities· 2025-10-28 10:13
Investment Rating - The report maintains a neutral investment rating for the non-ferrous metals industry, indicating that the industry index is expected to perform in line with the benchmark index [7]. Core Insights - The non-ferrous metals industry index decreased by 1.97% over the past two weeks, underperforming the CSI 300 index and ranking 23rd among 31 first-level industries [2][13]. - Precious metals experienced a significant decline, with gold prices dropping by 3.30% and silver by 4.38% in the last week [3][22]. - The report highlights the importance of geopolitical factors and domestic demand recovery in shaping future investment opportunities in the sector [5]. Summary by Sections Market Review - The non-ferrous metals industry index fell by 1.97% from October 13 to October 24, 2025, with all sub-sectors showing declines, particularly precious metals which dropped by 7.89% [2][13]. Precious Metals - As of October 24, COMEX gold closed at $4,126.90 per ounce, down 3.30% over the past week, while year-to-date it has increased by 54.50%. COMEX silver closed at $48.41 per ounce, down 4.38% over the past week, with a year-to-date increase of 61.42% [3][22]. Industrial Metals - LME copper settled at $10,807.00 per ton, up 0.67% over the past two weeks, with a year-to-date increase of 24.43%. Domestic copper prices averaged 87,040 RMB per ton, up 0.85% over the same period [30][31]. Minor Metals - Black tungsten concentrate (≥65%) was priced at 279,000 RMB per ton, up 3.72% over the past two weeks, while LME tin was priced at $35,650 per ton, up 0.85% [38][39]. Rare Earths - The China Rare Earth Price Index was reported at 197.72, down 8.22% over the past two weeks, but up 20.72% year-to-date. Light rare earths like praseodymium-neodymium oxide saw a price drop of 10.22% [51][52]. Energy Metals - As of October 24, the average price of electrolytic cobalt was 407,500 RMB per ton, up 16.60% over the past two weeks, and the average price of cobalt sulfate (≥20.5%) was 89,850 RMB per ton, up 18.22% [57][58].