其他家电
Search documents
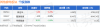
其他家电板块10月23日跌0.76%,荣泰健康领跌,主力资金净流出4725.78万元
Zheng Xing Xing Ye Ri Bao· 2025-10-23 08:20
Group 1 - The other home appliance sector declined by 0.76% on the previous trading day, with Rongtai Health leading the decline [1] - The Shanghai Composite Index closed at 3922.41, up 0.22%, while the Shenzhen Component Index closed at 13025.45, also up 0.22% [1] - Key stocks in the other home appliance sector showed varied performance, with Aojiahua closing at 6.88 (up 0.29%), Rongjie Health at 4.39 (unchanged), and Rongtai Health at 30.93 (down 1.68%) [1] Group 2 - The net outflow of main funds in the other home appliance sector was 47.26 million yuan, while retail investors saw a net inflow of 47.03 million yuan [1] - Detailed fund flow data indicated that Aojiahua experienced a main fund outflow of 7.71 million yuan, with retail inflow of 9.81 million yuan [1] - Rongtai Health had a significant main fund outflow of 26.05 million yuan, but retail investors contributed a net inflow of 23.57 million yuan [1]

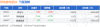
其他家电板块10月22日跌0.75%,融捷健康领跌,主力资金净流出1346.31万元
Zheng Xing Xing Ye Ri Bao· 2025-10-22 08:19
Core Viewpoint - The other home appliance sector experienced a decline of 0.75% on the trading day, with Rongjie Health leading the losses. The Shanghai Composite Index closed at 3913.76, down 0.07%, while the Shenzhen Component Index closed at 12996.61, down 0.62% [1] Group 1: Market Performance - The other home appliance sector saw a decline of 0.75% on the previous trading day [1] - The Shanghai Composite Index closed at 3913.76, reflecting a decrease of 0.07% [1] - The Shenzhen Component Index closed at 12996.61, showing a decline of 0.62% [1] Group 2: Individual Stock Performance - The closing prices and performance of individual stocks in the other home appliance sector are as follows: - Qijiahua (002614) closed at 6.86, with an increase of 1.18% and a trading volume of 88,400 shares [1] - Rongtai Health (603579) closed at 31.46, down 1.19% with a trading volume of 31,900 shares [1] - Rongjie Health (300247) closed at 4.39, down 1.57% with a trading volume of 173,100 shares [1] Group 3: Capital Flow Analysis - The other home appliance sector experienced a net outflow of 13.46 million yuan from main funds, while retail investors saw a net inflow of 16.77 million yuan [1] - The capital flow for individual stocks is as follows: - Qijiahua (002614) had a main fund net inflow of 2.96 million yuan, with a net outflow of 7.63 million yuan from speculative funds [1] - Rongtai Health (603579) experienced a net outflow of 3.69 million yuan from main funds, with a net inflow of 2.33 million yuan from speculative funds [1] - Rongjie Health (300247) had a significant net outflow of 12.74 million yuan from main funds, while retail investors contributed a net inflow of 10.75 million yuan [1]
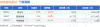
其他家电板块10月21日涨0.6%,奥佳华领涨,主力资金净流出3442.28万元
Zheng Xing Xing Ye Ri Bao· 2025-10-21 08:21
Group 1 - The other home appliance sector increased by 0.6% compared to the previous trading day, with Aojiahua leading the gains [1] - On October 21, the Shanghai Composite Index closed at 3916.33, up 1.36%, while the Shenzhen Component Index closed at 13077.32, up 2.06% [1] - Key stocks in the other home appliance sector showed varied performance, with Aojiahua closing at 6.78, up 2.11%, Rongtai Health at 31.84, down 0.13%, and Rongjie Health at 4.46, up 0.68% [1] Group 2 - The net outflow of main funds in the other home appliance sector was 34.42 million yuan, while retail investors saw a net inflow of 33.16 million yuan [1] - Aojiahua experienced a main fund net outflow of 3.72 million yuan, with retail investors contributing a net inflow of 5.82 million yuan [1] - Rongtai Health had a main fund net outflow of 12.17 million yuan, with retail investors showing a net inflow of 11.89 million yuan [1]
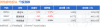
其他家电板块10月20日涨0.49%,奥佳华领涨,主力资金净流入269.69万元
Zheng Xing Xing Ye Ri Bao· 2025-10-20 08:21
Market Overview - The other home appliance sector increased by 0.49% compared to the previous trading day, with Aojiahua leading the gains [1] - The Shanghai Composite Index closed at 3863.89, up 0.63%, while the Shenzhen Component Index closed at 12813.21, up 0.98% [1] Stock Performance - Aojiahua (002614) closed at 6.64, with a rise of 1.37% and a trading volume of 53,900 shares, amounting to a transaction value of 35.70 million yuan [1] - Rongjie Health (300247) closed at 4.43, with an increase of 0.68% and a trading volume of 195,700 shares, resulting in a transaction value of 86.62 million yuan [1] - Rongtai Health (603579) closed at 31.88, remaining unchanged with a trading volume of 25,000 shares and a transaction value of 80.26 million yuan [1] Capital Flow - The other home appliance sector saw a net inflow of 2.70 million yuan from main funds, while retail funds experienced a net inflow of 1.83 million yuan [1] - Main funds for Rongjie Health (300247) had a net inflow of 8.16 million yuan, while retail funds had a net outflow of 7.39 million yuan [1] - Aojiahua (002614) experienced a net inflow of 3.74 million yuan from main funds, with retail funds showing a net inflow of 1.62 million yuan [1] - Rongtai Health (603579) had a significant net outflow of 9.20 million yuan from main funds, but retail funds saw a net inflow of 7.60 million yuan [1]
其他家电板块10月17日跌2.23%,荣泰健康领跌,主力资金净流出973.33万元
Zheng Xing Xing Ye Ri Bao· 2025-10-17 08:31
Group 1 - The other home appliance sector experienced a decline of 2.23% on the trading day, with Rongtai Health leading the drop [1] - The Shanghai Composite Index closed at 3839.76, down 1.95%, while the Shenzhen Component Index closed at 12688.94, down 3.04% [1] - Key stocks in the other home appliance sector showed varied performance, with Rongjie Health down 0.45% to 4.40, Aojiahua down 1.06% to 6.55, and Rongtai Health down 3.69% to 31.88 [1] Group 2 - The net outflow of main funds in the other home appliance sector was 973.33 million yuan, while retail funds saw a net inflow of 112.4 million yuan [1] - Detailed fund flow data indicated that Rongjie Health had a main fund net inflow of 281.84 million yuan, while Rongtai Health had a net outflow of 853.96 million yuan [1] - The overall fund flow showed that retail investors contributed positively to the sector, with a net inflow of 736.18 million yuan into Rongtai Health despite its decline [1]
其他家电板块10月15日涨3.52%,荣泰健康领涨,主力资金净流出129.51万元
Zheng Xing Xing Ye Ri Bao· 2025-10-15 08:29
Core Insights - The other home appliance sector increased by 3.52% on the previous trading day, with Rongtai Health leading the gains [1] - The Shanghai Composite Index closed at 3912.21, up 1.22%, while the Shenzhen Component Index closed at 13118.75, up 1.73% [1] Company Performance - Rongtai Health (603579) closed at 32.80, with a rise of 5.60% and a trading volume of 60,100 shares, amounting to a transaction value of 194 million yuan [1] - Rongjie Health (300247) closed at 4.31, up 1.89% with a trading volume of 188,600 shares, resulting in a transaction value of 81.03 million yuan [1] - Aojiahua (002614) closed at 6.67, increasing by 0.91% with a trading volume of 52,000 shares, leading to a transaction value of 34.56 million yuan [1] Capital Flow Analysis - The other home appliance sector experienced a net outflow of 1.2951 million yuan from institutional investors and a net outflow of 7.9118 million yuan from speculative funds, while retail investors saw a net inflow of 9.2069 million yuan [1] - For Rongtai Health, the main capital inflow was 6.054 million yuan, while speculative funds saw a net outflow of 11.8266 million yuan, and retail investors had a net inflow of 5.7726 million yuan [1] - Aojiahua experienced a net outflow of 2.9342 million yuan from institutional investors, with speculative funds having a net inflow of 3.5909 million yuan and retail investors a net outflow of 656,700 yuan [1] - Rongjie Health had a net outflow of 4.415 million yuan from institutional investors, with speculative funds seeing a net inflow of 323,900 yuan and retail investors a net inflow of 4.091 million yuan [1]

其他家电板块10月14日跌0.74%,融捷健康领跌,主力资金净流出1919.32万元
Zheng Xing Xing Ye Ri Bao· 2025-10-14 08:39
Core Viewpoint - The other home appliance sector experienced a decline of 0.74% on October 14, with Rongjie Health leading the drop. The Shanghai Composite Index closed at 3865.23, down 0.62%, while the Shenzhen Component Index closed at 12895.11, down 2.54% [1] Market Performance - The closing prices and performance of key stocks in the other home appliance sector are as follows: - Aojiahua (002614) closed at 6.61, up 0.30% with a trading volume of 79,700 shares and a transaction value of 53.04 million yuan - Rongtai Health (603579) closed at 31.06, down 0.74% with a trading volume of 57,200 shares - Rongjie Health (300247) closed at 4.23, down 1.63% with a trading volume of 246,800 shares and a transaction value of 106 million yuan [1] Capital Flow - On the same day, the other home appliance sector saw a net outflow of 19.19 million yuan from main funds, a net outflow of 1.32 million yuan from speculative funds, and a net inflow of 20.52 million yuan from retail investors [1] - The capital flow for individual stocks in the sector is detailed as follows: - Aojiahua (002614) had a net outflow of 2.22 million yuan, a decrease of 4.19%, with a net inflow of 6.65 million yuan, an increase of 12.54% - Rongjie Health (300247) had a net outflow of 5.51 million yuan, a decrease of 5.18%, with a net inflow of 2.16 million yuan, an increase of 2.04% - Rongtai Health (603579) had a net outflow of 11.47 million yuan, a decrease of 6.30%, with a net inflow of 0.94 million yuan, an increase of 0.52% [1]

其他家电板块10月13日跌2.55%,荣泰健康领跌,主力资金净流出5340.58万元
Zheng Xing Xing Ye Ri Bao· 2025-10-13 12:38
Market Overview - The other home appliance sector experienced a decline of 2.55% compared to the previous trading day, with Rongtai Health leading the drop [1] - The Shanghai Composite Index closed at 3889.5, down 0.19%, while the Shenzhen Component Index closed at 13231.47, down 0.93% [1] Stock Performance - Rongjie Health (300247) closed at 4.30, up 3.86% with a trading volume of 367,100 shares and a transaction value of 154 million yuan [1] - Aojiahua (002614) closed at 6.59, down 1.05% with a trading volume of 94,200 shares [1] - Rongtai Health (603579) closed at 31.29, down 6.35% with a trading volume of 74,900 shares and a transaction value of 236 million yuan [1] Capital Flow - The other home appliance sector saw a net outflow of 53.41 million yuan from main funds, while retail funds had a net inflow of 38.87 million yuan [1] - Specific capital flows for individual stocks include: - Rongjie Health: Main funds net inflow of 8.64 million yuan (5.60%), retail funds net outflow of 8.50 million yuan (-5.51%) [1] - Aojiahua: Main funds net outflow of 3.96 million yuan (-6.44%), retail funds net inflow of 364,400 yuan (0.59%) [1] - Rongtai Health: Main funds net outflow of 58.08 million yuan (-24.63%), retail funds net inflow of 47.00 million yuan (19.93%) [1]

其他家电板块10月10日涨0.78%,奥佳华领涨,主力资金净流入332.83万元
Zheng Xing Xing Ye Ri Bao· 2025-10-10 08:45
Core Viewpoint - The other home appliance sector experienced a slight increase of 0.78% on October 10, with OJIHUA leading the gains, while the overall market indices saw declines [1][2]. Group 1: Market Performance - On October 10, the Shanghai Composite Index closed at 3897.03, down 0.94%, and the Shenzhen Component Index closed at 13355.42, down 2.7% [1]. - The other home appliance sector's individual stock performance included: - OJIHUA (002614) closed at 6.66, up 1.68% with a trading volume of 102,300 shares and a transaction value of 68.12 million yuan [1]. - RONGJIE Health (300247) closed at 4.14, up 1.22% with a trading volume of 176,700 shares and a transaction value of 73.18 million yuan [1]. - RONGTAI Health (603579) closed at 33.41, up 0.18% with a trading volume of 45,300 shares and a transaction value of 153 million yuan [1]. Group 2: Capital Flow - The other home appliance sector saw a net inflow of 3.33 million yuan from main funds, while retail funds experienced a net outflow of 7.15 million yuan, and retail investors had a net inflow of 3.82 million yuan [2].

其他家电板块10月9日跌2.38%,荣泰健康领跌,主力资金净流出5731.86万元
Zheng Xing Xing Ye Ri Bao· 2025-10-09 08:53
Market Overview - The other home appliance sector experienced a decline of 2.38% on October 9, with Rongtai Health leading the drop [1] - The Shanghai Composite Index closed at 3933.97, up 1.32%, while the Shenzhen Component Index closed at 13725.56, up 1.47% [1] Stock Performance - Key stocks in the other home appliance sector showed varied performance: - Aojiahua (002614) closed at 6.55, down 0.61% with a trading volume of 77,900 shares and a transaction value of 51.06 million yuan [1] - Rongjie Health (300247) closed at 4.09, down 1.92% with a trading volume of 200,500 shares and a transaction value of 82.53 million yuan [1] - Rongtai Health (603579) closed at 33.35, down 3.33% with a trading volume of 63,800 shares and a transaction value of 214 million yuan [1] Capital Flow - The other home appliance sector saw a net outflow of 57.32 million yuan from main funds, while retail funds had a net inflow of 28.31 million yuan [1] - Detailed capital flow for key stocks: - Rongjie Health (300247) had a main fund net outflow of 8.64 million yuan and a retail net inflow of 4.69 million yuan [1] - Aojiahua (002614) experienced a main fund net outflow of 9.03 million yuan and a retail net inflow of 2.47 million yuan [1] - Rongtai Health (603579) faced a significant main fund net outflow of 39.64 million yuan but had a retail net inflow of 30.53 million yuan [1]
