Crown Castle(CCI)
Search documents
Crown Castle(CCI) - 2025 Q3 - Earnings Call Transcript
2025-10-22 21:30
Financial Data and Key Metrics Changes - The company reported a solid third-quarter performance with a 5.2% organic growth, translating to an increase of $52 million, despite a $51 million unfavorable impact from Sprint cancellations [12][14] - The updated full-year 2025 outlook includes increases of $10 million in site rental revenues, $30 million in adjusted EBITDA, and $40 million in AFFO [13][14] - A $15 million decrease in interest expense was noted, primarily due to lower than expected floating rates [14] Business Line Data and Key Metrics Changes - The tower business showed strong performance, with organic growth driven by continued demand for assets, although impacted by Sprint cancellations and non-cash revenue adjustments [12][14] - The company expects a $40 million increase in AFFO, attributed to higher services activity and reduced expenses [13] Market Data and Key Metrics Changes - Mobile data demand in 2024 increased by over 30% for the third consecutive year, indicating strong long-term demand for tower assets [6][8] - The FCC plans to auction at least 800 megahertz of additional spectrum starting in 2027, which is expected to create significant opportunities for tower operators [8] Company Strategy and Development Direction - The company aims to become a best-in-class U.S. tower operator, focusing on maximizing cash flow and organic growth while enhancing profitability [9][11] - Strategic priorities include improving asset information accessibility, streamlining processes, and driving operational efficiencies [9][10] - Following the fiber business sale, the company plans to grow dividends in line with AFFO while maintaining a payout ratio of 75% to 80% [10] Management's Comments on Operating Environment and Future Outlook - Management expressed optimism about the wireless communications infrastructure industry, citing solid fundamentals and customer demand [6][11] - The company is focused on unlocking value from existing assets and enhancing operational efficiency, particularly post-fiber sale [20][21] Other Important Information - The fiber segment results are reported as discontinued operations, and the company’s financial outlook does not include contributions from this segment [3][4] - The company is committed to maintaining an investment-grade credit rating while repurchasing shares after paying dividends and pursuing organic investments [10] Q&A Session Summary Question: Growth opportunities with existing customers and efficiency gains from divesting fiber operations - Management emphasized unlocking revenue and profitability from the existing portfolio and focusing on efficiency improvements post-fiber sale [20][21] Question: Update on the relationship with EchoStar - Management confirmed a solid agreement with EchoStar, expecting to be paid per the terms of the contract [21] Question: Impact of AT&T's deployment of EchoStar spectrum - Management noted that while they cannot comment on specific carriers, increased spectrum deployment generally favors the tower sector [25] Question: Changes in carrier densification plans - Management reported no material changes in leasing demand, indicating a strong environment for their assets [28] Question: Contribution of DISH to revenue and future guidance - Management indicated that DISH represents about 5% of tower revenues and expressed confidence in the existing contract [34] Question: Cost efficiency program and margin comparisons with peers - Management highlighted ongoing efforts to drive efficiencies and the potential for improved margins through system implementations and process automation [66] Question: Discretionary CapEx guidance decrease - Management explained that the decrease was due to timing, with expenditures pushed to the next year rather than fundamental changes [72]
Crown Castle(CCI) - 2025 Q3 - Earnings Call Presentation
2025-10-22 20:30
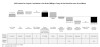
October 22, 2025 Third Quarter 2025 Earnings Conference Call The pathway to possible. Cautionary Language PAGE 3 Third Quarter 2025 Earnings Conference Call v Delivered strong third quarter results, highlighted by 5.2% organic growth, excluding the impact of Sprint Cancellations.(1) V Increased full year 2025 Outlook as we continue to find opportunities to operate more efficiently, and demand for our assets remains strong. v We anticipate generating long-term attractive risk- adjusted returns as the only la ...
Crown Castle(CCI) - 2025 Q3 - Quarterly Results
2025-10-22 20:17
Company Overview - Crown Castle owns approximately 40,000 towers, 105,000 small cells, and 90,000 route miles of fiber, positioning itself as a leading provider of shared communications infrastructure in the U.S.[14] - The company maintains a BBB+ long-term issuer default rating from Fitch and a Baa3 rating from Moody's, indicating stable credit quality[24]. - The company has a market capitalization of $42,019 million, with a firm value of $66,236 million[102]. Financial Performance - The company reported net income of $303 million in Q3 2024, with a diluted net income per share of $0.70[56]. - Total net revenues for Q3 2025 were $1,072 million, a decrease of 4.3% compared to $1,120 million in Q3 2024[143]. - Net income for Q3 2025 was $323 million, compared to $303 million in Q3 2024, reflecting an increase of 6.6%[143]. - Adjusted EBITDA for Q3 2025 was $777 million, with a full-year 2025 outlook of $2,810 to $2,860 million[183]. - Total site rental revenues for Q3 2025 were $1,012 million, reflecting a year-over-year decrease of 5.1% compared to Q3 2024[63]. - Total site rental revenues for Full Year 2025 are estimated to be between $4,007 million and $4,052 million, reflecting a year-over-year decrease of 5.6%[49]. Future Outlook - Crown Castle's outlook for full year 2025 includes expectations for cash flow growth and continued demand for its tower assets[5]. - The company expects to maintain a stable site rental revenue stream despite anticipated non-renewals associated with Sprint cancellations[49]. - Projected site rental revenues for 2026 are estimated at $4,008 million, with a gradual increase to $4,361 million by 2029[88]. - Crown Castle aims to enhance stockholder value through tenant additions and modifications, which are expected to generate high incremental returns[22]. Capital Expenditures and Investments - Discretionary capital expenditures totaled $33 million in Q1 2025, with a projected total of $36 million for Q3 2025[68]. - Total capital expenditures for Q1 2025 were $40 million, with a forecast of $42 million for Q3 2025[68]. - The company has established an at-the-market stock offering program with a potential gross sales price of up to $750 million, although no shares have been sold under this program yet[119]. Debt and Financial Obligations - The total debt and other obligations amount to $24,319 million, with a net debt of $24,217 million[116]. - The total net leverage ratio is reported at 5.9x, below the covenant requirement of ≤ 6.50x[118]. - As of September 30, 2025, total secured debt stands at $1,037 million with a weighted average interest rate of 4.4%[102]. - The company had a weighted average interest rate of 3.8% on fixed-rate debt, which constitutes 84% of total debt[127]. Revenue Streams - Total leased rental revenues amount to $2,554 million, representing 65% of total revenues, while owned revenues are $1,358 million, accounting for 35%[95]. - T-Mobile accounted for 40% of Q3 2025 rental revenues, with a weighted average remaining term of 7 years[84]. Strategic Transactions - Crown Castle signed a Strategic Fiber Agreement to sell its small cells and fiber solutions businesses for an aggregate of $8.5 billion, subject to closing adjustments[16]. - The Strategic Fiber Transaction involves the sale of the Fiber Business for $8.5 billion, expected to close in the first half of 2026, subject to regulatory approvals[179]. - The company continues to operate the Fiber Business in accordance with the Strategic Fiber Agreement pending the transaction's closure[179]. Key Financial Metrics - AFFO per share for Full Year 2025 is anticipated to be between $4.23 and $4.35[43]. - Interest expense and amortization of deferred financing costs for Full Year 2025 is projected to be between $957 million and $1,002 million[51]. - The company reported FFO of $466 million for Q3 2024, with an AFFO of $525 million for the same period[191]. - Organic contribution to site rental billings, adjusted for Sprint cancellations, is expected to be between $170 million and $200 million[49]. Operational Efficiency - Crown Castle's strategy focuses on maximizing recurring site rental cash flows, returning cash to stockholders through dividends and share repurchases, and investing capital efficiently to drive growth[20]. - Adjusted Site Rental Gross Margin excludes stock-based compensation and amortization, providing insight into operational efficiency[169]. - Consolidated return on invested capital for Q3 2025 was 10.7%, down from 11.6% in Q3 2024[76]. - Cash yield on invested capital for Q3 2025 was 13.0%, slightly down from 13.1% in Q3 2024[76].
Crown Castle Reports Third Quarter 2025 Results and Increases Outlook for Full Year 2025
Globenewswire· 2025-10-22 20:15
Core Insights - Crown Castle Inc. reported strong operational and financial results for Q3 2025, with an increase in full-year 2025 outlook due to improved efficiency [2][5][7] - The company anticipates closing the Fiber Business sale transaction in the first half of 2026, positioning itself as the only large publicly traded tower company focused on the U.S. market [2][7][37] Financial Results - Q3 2025 site rental revenues were $1,012 million, a decrease of 5% from $1,066 million in Q3 2024 [4] - Net income for Q3 2025 was $323 million, up 7% from $303 million in Q3 2024 [4][9] - Adjusted EBITDA for Q3 2025 was $718 million, down 8% from $777 million in Q3 2024 [4][9] - AFFO for Q3 2025 was $490 million, representing a 7% decrease from $525 million in Q3 2024 [4][9] Outlook for 2025 - The updated full-year 2025 outlook includes site rental revenues of $4,030 million, a 6% decrease from $4,268 million in 2024 [2][8] - The company expects net income to range from $145 million to $425 million for 2025, with a diluted net income per share of $0.33 to $0.97 [11][43] - Adjusted EBITDA for 2025 is projected between $2,810 million and $2,860 million, reflecting a $30 million increase from previous outlooks [11][39] Operational Highlights - Organic contribution to site rental billings for Q3 2025 was $52 million, indicating 5.2% organic growth, excluding the impact of Sprint Cancellations [5][7] - The company maintains a strong balance sheet with approximately 84% fixed-rate debt and $4.2 billion available under its revolving credit facility [7] Capital Expenditures and Dividends - Capital expenditures for Q3 2025 were $42 million, consistent with $41 million in Q3 2024 [9] - Common stock dividends paid during the quarter totaled approximately $463 million, a decrease of 32% on a per-share basis compared to the same period last year [9]

What Analyst Projections for Key Metrics Reveal About Crown Castle (CCI) Q3 Earnings
ZACKS· 2025-10-17 14:16
Core Insights - Crown Castle (CCI) is expected to report quarterly earnings of $1.04 per share, a decline of 43.5% year-over-year, with revenues forecasted at $1.05 billion, reflecting a decrease of 36.4% compared to the same period last year [1] Earnings Estimates - The consensus EPS estimate has been revised 0.4% higher over the last 30 days, indicating a collective reevaluation by analysts [2] - Revisions to earnings projections are crucial for predicting investor behavior and are linked to short-term stock price performance [3] Revenue and Gross Margin Estimates - Analysts predict 'Revenues- Services and other' to be $52.25 million, down 11.4% from the prior-year quarter [5] - The average estimate for 'Revenues- Site rental' is $998.97 million, indicating a year-over-year decline of 37.3% [5] - The expected 'Services and other- Gross margin' is $23.77 million, down from $31.00 million in the same quarter last year [6] - The consensus for 'Site rental- Gross margin' is $750.04 million, compared to $1.17 billion reported in the same quarter of the previous year [6] Operational Costs - Estimated 'Depreciation, amortization and accretion' is projected at $185.14 million [7] - 'Costs of operations- Services and other' are expected to be $27.60 million, while 'Costs of operations- Site rental' are forecasted to reach $251.59 million [7] Stock Performance - Over the past month, Crown Castle shares have increased by 5.5%, outperforming the Zacks S&P 500 composite, which saw a change of +0.7% [7] - Crown Castle holds a Zacks Rank 3 (Hold), suggesting its performance will likely align with the overall market in the upcoming period [7]
Jim Cramer Says Crown Castle’s “Business Model is Not a Sound One”
Yahoo Finance· 2025-10-11 14:02
Core Insights - Crown Castle Inc. (NYSE:CCI) is facing challenges despite the increasing demand for cell phone coverage due to issues with its business model and urban infrastructure [1] - The company owns and leases a significant network of cell towers and fiber infrastructure, which are essential for wireless connectivity and data transmission [1] - Crown Castle is recognized as a key player in the digital economy, providing critical assets that support the nation's wireless networks through long-term contracts with major wireless carriers [1] Company Overview - Crown Castle Inc. operates the largest portfolio of shared communications infrastructure in the United States, primarily focusing on macro cell towers [1] - The company has established itself as an indispensable partner in the digital economy, benefiting from high barriers to entry that protect its market position [1] - The business model relies on leasing space on strategically located infrastructure, which has allowed Crown Castle to build a durable and compounding enterprise [1]
Crown Castle Announces Third Quarter 2025 Earnings Conference Call Details
Globenewswire· 2025-10-08 20:26
Core Viewpoint - Crown Castle Inc. is set to release its third quarter 2025 results on October 22, 2025, after market close, followed by a conference call at 4:30 p.m. eastern time [1]. Company Overview - Crown Castle owns, operates, and leases approximately 40,000 cell towers and around 90,000 route miles of fiber, supporting small cells and fiber solutions across major U.S. markets [3]. - The company's extensive communications infrastructure connects cities and communities to essential data, technology, and wireless services, facilitating the flow of information and innovations [3]. Conference Call Details - A live audio webcast of the conference call will be available on Crown Castle's website, with participants able to join by dialing specific numbers at least 30 minutes prior to the call [2]. - A replay of the webcast will be accessible on the Investor page of Crown Castle's website until the end of the day on October 22, 2026 [2]. Contacts - Key contacts for Crown Castle include Sunit Patel, CFO, and Kris Hinson, VP & Treasurer, with a provided phone number for inquiries [4].

Jim Cramer Sees More Upside For Shopify, Likes CoreWeave's AI Moves - Beam Therapeutics (NASDAQ:BEAM), Affirm Holdings (NASDAQ:AFRM)
Benzinga· 2025-10-08 12:33
Group 1: Affirm Holdings, Inc. - Jim Cramer recommended buying Affirm Holdings, Inc. (NASDAQ:AFRM) after Rothschild & Co analyst Harry Bartlett upgraded the stock from Neutral to Buy and raised the price target from $74 to $101 [1][1] - Affirm shares rose 1% to settle at $76.65 on Tuesday [7] Group 2: Beam Therapeutics Inc. - Cramer expressed skepticism about Beam Therapeutics Inc. (NASDAQ:BEAM), stating "I can't go with" regarding the stock [1] - Beam Therapeutics announced on Aug. 14 that the FDA granted regenerative medicine advanced therapy designation status for Beam-101 [1] - Beam shares declined 2.9% to settle at $25.13 on Tuesday [7] Group 3: Crown Castle Inc. - Cramer criticized the business model of Crown Castle Inc. (NYSE:CCI) as "not a sound one" [2] - RBC Capital analyst Jonathan Atkin upgraded Crown Castle from Sector Perform to Outperform but lowered the price target from $113 to $112 [2] - Crown Castle shares gained 1.2% to settle at $95.14 [7] Group 4: Shopify Inc. - Cramer stated that Shopify Inc. (NASDAQ:SHOP) is going "much higher," supported by TD Securities raising its price target from $130 to $156 [2] - Shopify shares fell 2% to close at $161.28 on Tuesday [7] Group 5: CoreWeave, Inc. - Cramer described CoreWeave, Inc. (NASDAQ:CRWV) as "good" [2] - CoreWeave announced plans to acquire Monolith AI, a UK-based pioneer in applying machine learning to complex physics and engineering problems [2] - CoreWeave shares fell 3.8% to settle at $128.83 [7] Group 6: CrowdStrike Holdings, Inc. - Cramer expressed confidence in CrowdStrike Holdings, Inc. (NASDAQ:CRWD) and its CEO George Kurtz, expecting the stock to rise [3] - Wells Fargo analyst Andrew Nowinski maintained an Overweight rating on CrowdStrike and raised the price target from $550 to $600 [3] - CrowdStrike shares fell 2.3% to close at $484.62 [7]

Jim Cramer Sees More Upside For Shopify, Likes CoreWeave's AI Moves
Benzinga· 2025-10-08 12:33
Group 1: Affirm Holdings, Inc. - Jim Cramer recommended buying Affirm Holdings, Inc. (NASDAQ:AFRM) after Rothschild & Co analyst Harry Bartlett upgraded the stock from Neutral to Buy and raised the price target from $74 to $101 [1][1] - Affirm shares rose 1% to settle at $76.65 on Tuesday [7] Group 2: Beam Therapeutics Inc. - Cramer expressed skepticism about Beam Therapeutics Inc. (NASDAQ:BEAM), stating "I can't go with" the stock [1] - Beam Therapeutics announced on Aug. 14 that the FDA granted regenerative medicine advanced therapy designation status for Beam-101 [1] - Beam shares declined 2.9% to settle at $25.13 on Tuesday [7] Group 3: Crown Castle Inc. - Cramer criticized the business model of Crown Castle Inc. (NYSE:CCI), calling it "not a sound one" [2] - RBC Capital analyst Jonathan Atkin upgraded Crown Castle from Sector Perform to Outperform but lowered the price target from $113 to $112 [2] - Crown Castle shares gained 1.2% to settle at $95.14 [7] Group 4: Shopify Inc. - Cramer stated that Shopify Inc. (NASDAQ:SHOP) is going "much higher," supported by TD Securities raising its price target from $130 to $156 [2] - Shopify shares fell 2% to close at $161.28 on Tuesday [7] Group 5: CoreWeave, Inc. - Cramer described CoreWeave, Inc. (NASDAQ:CRWV) as "good" [2] - CoreWeave announced plans to acquire Monolith AI, a UK-based pioneer in applying machine learning to complex physics and engineering problems [2] - CoreWeave shares fell 3.8% to settle at $128.83 [7] Group 6: CrowdStrike Holdings, Inc. - Cramer expressed confidence in CrowdStrike Holdings, Inc. (NASDAQ:CRWD) and its CEO George Kurtz, expecting the stock to rise [3] - Wells Fargo analyst Andrew Nowinski maintained an Overweight rating on CrowdStrike and raised the price target from $550 to $600 [3] - CrowdStrike shares fell 2.3% to close at $484.62 [7]

Crown Castle: 32% Dividend Cut, Falling Price, But Is It Actually A Bargain Or Value Trap?
Seeking Alpha· 2025-10-08 10:45
Group 1 - REITs (XLRE) have faced challenges due to prolonged high interest rates over the past three years, leading to underperformance in the sector [1] - Investors who purchased REITs at favorable prices may currently be experiencing positive returns [1] Group 2 - The article emphasizes the importance of due diligence for investors, particularly in the context of dividend investing in quality blue-chip stocks, BDCs, and REITs [1] - The author aims to assist lower and middle-class workers in building investment portfolios focused on high-quality, dividend-paying companies [1]
