fumed silica
Search documents
HPQ Silicon Closed $3.0 Million Non-Brokered Private Placement
Globenewswire· 2026-03-02 14:26
Core Viewpoint - HPQ Silicon Inc. has successfully closed a non-brokered private placement, raising a total of $3 million CAD through the issuance of 18,181,819 units at a price of $0.165 CAD per unit, aimed at advancing its innovative projects in silicon and hydrogen technologies [1][2]. Group 1: Private Placement Details - The private placement consists of units, each comprising one common share and one non-transferable warrant, with the warrants exercisable at $0.25 CAD for 24 months [2]. - The offering was fully subscribed by an investor outside of Canada [2]. - A cash finder's fee of $180,000 will be paid, along with the issuance of 1,090,909 non-transferable warrants to the finder, also exercisable at $0.25 CAD for 24 months [3]. Group 2: Use of Proceeds - The net proceeds from the offering will be allocated for general working capital, accelerating the execution of the Silicon-Based Battery Material pilot plant project, and continuing the development of hydrogen-based projects [4]. Group 3: Company Overview - HPQ Silicon Inc. is focused on advanced materials technology, particularly in the production of high-purity silicon and silica for energy storage and industrial applications [1][6]. - The company is developing next-generation silicon-based anode materials and is involved in clean-hydrogen and waste-to-energy technologies, holding exclusive North American rights [6][7]. - HPQ aims to become a low-cost, zero-CO₂ producer of fumed silica and high-purity silicon, supported by technical partnerships [7].


HPQ Silicon announces that the Private Placement Offering is Fully Subscribed
Globenewswire· 2026-02-24 14:38
Core Viewpoint - HPQ Silicon Inc. has successfully completed a non-brokered private placement, raising approximately $3 million CAD through the issuance of 18,181,819 units at a price of $0.165 CAD per unit, indicating strong institutional investor support [1][2]. Group 1: Offering Details - The private placement consists of units, each comprising one common share and one non-transferable common share purchase warrant, with warrants exercisable at $0.25 CAD for 24 months post-closing [3]. - The offering is expected to close around February 27, 2026, pending necessary approvals from the TSX Venture Exchange [2]. Group 2: Use of Proceeds - The net proceeds from the offering will be allocated for general working capital, accelerating the execution of the Silicon-Based Battery Material pilot plant project, and continuing the development of hydrogen-based projects [4]. Group 3: Company Overview - HPQ Silicon Inc. is focused on advanced materials technology, particularly in the production of high-purity silicon and silica for energy storage and industrial applications [1][5]. - The company is collaborating with Novacium to develop next-generation silicon-based anode materials and is also working on clean-hydrogen and waste-to-energy technologies [5][6]. - HPQ aims to become a low-cost, zero-CO₂ producer of fumed silica and high-purity silicon, positioning itself to capture growth opportunities in energy storage and clean hydrogen markets [6].
HPQ Silicon Announces Non-Brokered Private Placement Offering of up to $3M
Globenewswire· 2026-02-23 21:12
Core Viewpoint - HPQ Silicon Inc. is conducting a non-brokered private placement to raise approximately $3 million CAD through the issuance of up to 18,181,819 units at a price of $0.165 CAD per unit, aimed at funding various projects and working capital [1][3]. Group 1: Offering Details - Each unit consists of one common share and one non-transferable common share purchase warrant, with the warrant exercisable at $0.25 CAD for 24 months from the closing date [2]. - The company may pay a cash commission of up to 6% of the gross proceeds and issue finder's warrants of up to 6% of the total number of units issued [2]. Group 2: Use of Proceeds - The net proceeds from the offering will be allocated for general working capital, accelerating the Silicon-Based Battery Material pilot plant project, and continuing the development of hydrogen-based projects [3]. Group 3: Regulatory and Compliance Information - The offering is being conducted under exemptions from the prospectus requirement and is not subject to resale restrictions unless sold to Canadian residents [4]. - The offering is not classified as a Related Party Transaction and is subject to final acceptance by the TSX Venture Exchange [4]. Group 4: Company Overview - HPQ Silicon Inc. is focused on advanced materials technology, particularly in the production of high-purity silicon and silica for energy storage and industrial applications [1][6]. - The company is developing next-generation silicon-based anode materials and is involved in clean-hydrogen and waste-to-energy technologies, holding exclusive North American rights [6][7]. - HPQ aims to become a low-cost, zero-CO₂ producer of fumed silica and high-purity silicon, supported by technical partnerships [7].
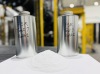
PyroGenesis Confirms Third-Party Verification of Its Fumed Silica: Successfully Meets Major Requirement for Proposed Joint Venture
Globenewswire· 2026-02-19 12:00
Core Viewpoint - PyroGenesis Inc. has received successful validation results for its fumed silica produced by its fumed silica reactor, which is a critical step towards forming a joint venture for a 1,000 tonne per year production plant [1][2][5] Company Developments - The joint venture partner has purchased 50 kg of fumed silica for further testing, with results expected within 6 weeks [1][3] - PyroGenesis is in the final stages of acquiring a 50% interest in HPQ Silica Polvere Inc. as part of the joint venture agreement [2] - The joint venture aims to operate a fumed silica production plant with an expected investment of US$20 million (approximately CA$27.3 million) for building the fumed silica reactor [2][5] Technology and Production Process - The fumed silica reactor (FSR) allows for the production of fumed silica in a single, eco-friendly step without harmful chemicals, significantly reducing capital and operating costs [4][8][12] - The FSR is designed to produce fumed silica with a lower CO₂ footprint and energy intensity, enabling profitable production at a smaller scale [4][12] - The proposed plant is expected to be delivered within 12 months of the joint venture formation, with potential for additional plants of similar or larger size [4][5] Market Context - Fumed silica is widely used in various consumer and industrial products, serving as a thickening and anti-caking agent [11] - The joint venture is positioned to capitalize on the growing demand for fumed silica in industries such as cosmetics, pharmaceuticals, and construction materials [11][15] - PyroGenesis aims to leverage its plasma technology to become a low-cost, zero-CO₂ producer of fumed silica, aligning with global decarbonization efforts [15]

HPQ Signs Joint Venture MOU for a Commercial Fumed Silica Plant with Strategic Partner
Globenewswire· 2026-02-12 12:00
Core Viewpoint - HPQ Silicon Inc. has signed a non-binding memorandum of understanding (MOU) with a strategic partner to develop a commercial-scale fumed silica production plant with a capacity of 1,000 tonnes per year, valued at approximately US$20 million (C$27.3 million) [1][2]. Company Overview - HPQ Silicon Inc. is focused on innovation in advanced materials and critical process development, with a wholly owned subsidiary, HPQ Silica Polvere Inc. (HSPI) [1][2]. - The company aims to establish a commercial model for fumed silica production that can be replicated across multiple sites as demand increases [5][11]. Project Details - The proposed project involves forming a jointly owned operating company to build and operate the fumed silica facility, which will utilize HSPI's proprietary plasma-based Fumed Silica Reactor (FSR) technology developed by PyroGenesis Inc. [2][4]. - The strategic partner has secured project financing and will fund the construction of the facility [2][3]. Financial Structure - HSPI is expected to receive recurring royalties on each kilogram of fumed silica sold under an offtake arrangement with the strategic partner, although specific terms are yet to be agreed upon [4][5]. - This structure is designed to align the interests of HSPI and HPQ with long-term production performance while maintaining a capital-efficient profile [4][5]. Technical Validation - The completion of final agreements is contingent upon ongoing third-party testing and validation of fumed silica produced by HSPI's existing FSR pilot plant [6][8]. - Production samples have been delivered for testing to both the strategic partner and an independent laboratory in the U.S. to confirm the chemical and compositional characteristics required for commercial applications [6][8]. Market Context - Fumed silica is a critical industrial material used in various applications, including cosmetics, pharmaceuticals, food products, paints, coatings, sealants, and construction materials, due to its role as a thickening, anti-caking, and reinforcing agent [12].

PyroGenesis Confirms Additional Independent Verification of Its Fumed Silica Meeting Commercial Grade “150”
Globenewswire· 2026-02-03 12:00
Core Insights - PyroGenesis Inc. has confirmed that its fumed silica produced by the fumed silica reactor (FSR) has achieved commercial grade 150, as verified by multiple independent labs [1][5][2] Company Overview - PyroGenesis is a leader in ultra-high temperature processes and engineering innovation, providing plasma-based technology to heavy industry and defense [1][8] - The company has a 50% interest in HPQ Polvere Inc., the client for whom the FSR pilot plant was developed, and holds an exclusive arrangement to supply equipment for the commercialization of this new process [10] Product Development - The fumed silica produced during Test 7 has a specific surface area of approximately 150 m²/g and meets the required viscosity for commercial applications [2][5] - The pilot plant has successfully replicated lab-scale results for both viscosity and surface area, indicating its readiness for industrial applications such as coatings, adhesives, and sealants [5][7] - The surface area of fumed silica has increased from an initial 26 m²/g to the current 191 m²/g, with ongoing modifications aimed at achieving higher commercial grades [5][7] Industry Context - Fumed silica is widely used across various industries, including cosmetics, pharmaceuticals, and construction materials, serving as a thickening and anti-caking agent [10] - The material is often combined with other substances to enhance performance, such as in tires and batteries [10]

HPQ Closed a Non-Broker Private Placement
Globenewswire· 2025-11-24 21:09
Core Viewpoint - HPQ Silicon Inc. has successfully closed a non-brokered private placement of 1,883,815 common shares at a price of $0.1625 per share, raising gross proceeds of $306,120, which will be used for general working capital and to advance battery-related initiatives and ongoing R&D projects [1][2][3]. Group 1: Financing Details - The private placement consists of 1,883,815 common shares priced at $0.1625 each, resulting in gross proceeds of $306,120 [1]. - Each share issued is subject to a mandatory hold period of four months and one day, in compliance with Canadian securities laws [2]. - The financing is pending standard regulatory approvals, including from the TSX Venture Exchange [2]. Group 2: Company Strategy and Initiatives - The net proceeds from the financing will support general working capital, corporate purposes, and the advancement of battery-related initiatives [2]. - HPQ is focused on innovation in advanced materials and critical process development, particularly in next-generation silicon-based anode materials for batteries and clean hydrogen technologies [4][5]. - The company aims to become a low-cost, zero-CO₂ producer of fumed silica and high-purity silicon, supported by proprietary technologies and partnerships [5]. Group 3: Leadership Perspective - Bernard Tourillon, President and CEO of HPQ, emphasized that closing a shares-only financing without finder’s fees reflects the strength of HPQ's value proposition and provides additional flexibility for pursuing larger opportunities [3].
Independent Analysis Confirms HPQ Fumed Silica Reactor Produces Commercial-Grade Material at Pilot Scale
Globenewswire· 2025-11-12 12:00
Core Insights - HPQ Silicon Inc. has achieved a significant milestone by producing commercial-grade fumed silica with superior surface area and purity at pilot scale, confirming the scalability and performance of its proprietary Fumed Silica Reactor (FSR) technology [1][2][3] Production and Quality Achievements - Independent laboratory analysis confirmed that the latest pilot-scale run produced fumed silica with a specific surface area ranging from 168.44 to 191.17 m²/g, representing a 20% to 40% improvement from the previous test [9] - The purity of the produced material reached 99.74% to 99.83%, surpassing the 99% commercial baseline [9] - The results validate HPQ's ability to replicate and exceed lab-scale data, achieving up to 191 m²/g and 99.8% purity, positioning the material within the upper end of commercial specifications [3][4] Technological Advancements - The FSR technology allows for the production of hydrophilic fumed silica directly from quartz without the use of chlorosilanes or hazardous by-products, distinguishing it from conventional manufacturing processes [2][12] - The process consumes up to 87% less energy than traditional methods and reduces CO₂-equivalent emissions by 84%, offering significant environmental and financial advantages [19] Future Plans and Market Positioning - Following the successful completion of Test 7, HPQ and its partner PyroGenesis plan to optimize production to maintain consistent output near 200 m²/g and aim for a full design capacity of 50 tonnes per year [13] - HPQ intends to distribute sample batches to potential partners in various sectors, including coatings and advanced materials, which rely on high-surface-area fumed silica [14] - The global fumed-silica market is projected to exceed US$2.57 billion by 2034, and HPQ's technology positions it as a potential new entrant capable of capturing market share from established chemical giants [15]

HPQ Completes Latest Fumed Silica Pilot Test, Moves Closer to Achieving Highest Material Grades
Globenewswire· 2025-10-23 11:00
Core Viewpoint - HPQ Silicon Inc. has successfully completed Test Series 7 of its proprietary Fumed Silica Reactor pilot plant, marking significant progress towards commercializing a direct-quartz-to-fumed-silica manufacturing process that reduces energy consumption and carbon footprint [1][2][3]. Group 1: Test Series and Process Development - The pilot plant, developed by HPQ's subsidiary HPQ Silica Polvere Inc., utilizes a plasma-based reactor to convert quartz directly into fumed silica, a high-value product used in various applications [2][3]. - Test Series 7 aims to achieve a surface area exceeding 150 m²/g, building on previous tests that improved surface area from 28 m²/g in Test 4 to 136 m²/g in Test 6 [4]. - The enhancements made before Test Series 7 include preparing the Fumed Silica Reactor for multi-day continuous operation, targeting the production of 200 kilograms of material for potential customers [4][5]. Group 2: Future Goals and Market Positioning - The company anticipates that results from the third-party laboratory certification will inform the goals for Test Cycle 8, aiming for the highest fumed silica surface area grades of 300 m²/g [7]. - HPQ's broader objective is to create low-energy, high-value materials that can compete globally while supporting North American supply-chain resilience [7][10]. - The company is also focused on becoming a low-cost, zero-CO₂ producer of fumed silica and high-purity silicon, positioning itself to capture growth opportunities in energy storage and advanced materials markets [10].
PyroGenesis’ Latest Fumed Silica Test Results Post 3X Increase in Material Surface Area
Globenewswire· 2025-09-04 11:30
Core Insights - PyroGenesis Inc. has made significant advancements in the performance of its fumed silica reactor pilot plant, moving closer to commercial readiness [1][3] - The August testing results indicate a marked improvement in surface area and purity levels of the fumed silica produced [2][4] Performance Improvements - The surface area of fumed silica increased from 26 m/g to 136 m/g, with a target of 300 m/g [2][4] - The total elimination of carbon impurity was achieved, reducing it from 0.32% to 0% [4][8] - The system produced 10 test batches in 50% less time compared to the previous test, demonstrating improved yield [8] Purity Enhancements - TiO2 levels decreased from 0.01% to 0.0025%, Al2O3 from 0.35% to 0.0422%, and Fe2O3 from 0.14% to 0.0339%, all moving towards commercial targets [8] - Increased SiO2 content reached 97.92%, up from 53.59%, aiming for over 99.5% [8] Market Context - Fumed silica is widely used in various industries, including cosmetics, pharmaceuticals, and construction materials, serving as a thickening and anti-caking agent [8][9] - PyroGenesis' development of fumed silica aligns with its Commodity Security & Optimization vertical, focusing on advanced material production techniques [9] Company Overview - PyroGenesis is a leader in advanced plasma processes and sustainable solutions, with operations certified under ISO 9001:2015 and AS9100D [10] - The company is publicly traded on multiple exchanges, including TSX and OTCQX [10]
