银行理财产品
Search documents
最低持有期理财榜单出炉!股份行代销产品收益居前
2 1 Shi Ji Jing Ji Bao Dao· 2025-12-29 01:20
Core Insights - The report focuses on the performance of minimum holding period RMB public funds, ranking them based on annualized returns over various holding periods: 7 days, 14 days, 30 days, and 60 days [1] - The ranking is based on annualized yield calculations, with the calculation period matching the holding period [1] Group 1: 7-Day Holding Period Products - The top-performing product is "富竹纯债7天持有期20号(E份额)" from 民生理财 with an annualized return of 28.00% [3] - Other notable products include "固定收益纯债最短持有7天Y款-A份额" from 华夏银行 with a return of 17.38% and "易享利-7天持有期7号A" from 上海银行 with a return of 16.58% [4] Group 2: 14-Day Holding Period Products - The leading product is "景前固收增利双周窓14天持有期28号" from 中信银行 with an annualized return of 15.59% [6] - Other significant products include "富竹纯债14天持有期14号(E份额)" from 民生理财 with a return of 11.68% and "嘉鑫(歳刊)固收类最低持有14天第13期-B份额" from 建信理财 with a return of 9.77% [7] Group 3: 30-Day Holding Period Products - The highest return is from "幸福99鸡益(金盈) 30天持有期" from 杭州银行 with an annualized return of 25.44% [10] - Other notable products include "盈30天持有期27号" from 民生银行 with a return of 18.61% and "易享利-28天持有期6号A" from 上海银行 with a return of 12.19% [11] Group 4: 60-Day Holding Period Products - The top product is "贵竹固收增利双月盈60天持有期3号" from 中信银行 with an annualized return of 15.26% [14] - Other significant products include "富竹纯债60天持有期12号(E份额)" from 民生理财 with a return of 7.00% and "智富指数跟踪策略60天持有期-A份额" from 中银理财 with a return of 4.63% [15]


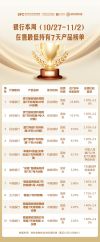
银行渠道本周在售最低持有期产品榜单(10/27-11/2)
2 1 Shi Ji Jing Ji Bao Dao· 2025-10-27 01:20
Core Insights - The article emphasizes the abundance of bank wealth management products with similar names and vague characteristics, urging investors to carefully select and differentiate among them [1] - The South Finance Wealth Management team aims to reduce investors' selection costs by focusing weekly on the performance of wealth management products available through various distribution channels [1] Summary by Category Performance Rankings - The current focus is on the performance of public offering products with a minimum holding period in RMB, categorized by holding periods of 7 days, 14 days, 30 days, and 60 days, with annualized returns as the performance metric [1] - The ranking includes 28 distribution institutions such as Industrial and Commercial Bank of China, Bank of China, Agricultural Bank of China, and others [1] Product Availability - The list of products is based on their "on-sale" status, which is determined by their investment cycle; however, actual availability may vary due to factors like sold-out quotas or differences in product listings for different customers [1] - Investors are advised to refer to the actual display on the distribution bank's app for the most accurate information [1] Weekly Updates - The article provides a weekly update on the performance of wealth management products, with specific attention to the lowest holding period products for the week of October 27 to November 2 [5][8][11]
银行渠道本周在售最低持有期理财产品榜单(9/29-10/5)
2 1 Shi Ji Jing Ji Bao Dao· 2025-09-29 01:08
Core Insights - The article focuses on the performance of bank wealth management products with varying minimum holding periods, specifically highlighting the annualized returns of products with holding periods of 90 days, 180 days, and 365 days [1][5][8] Group 1: 90-Day Holding Period Products - The top-performing product is from Minsheng Bank, with an annualized return of 15.74% [4] - Other notable products include Minsheng Bank's Rongzhu Mixed Fund at 15.05% and Bank of China’s mixed product at 10.73% [4] Group 2: 180-Day Holding Period Products - Minsheng Bank's Kyoto is a unique product with a return of 9.19%, leading the 180-day category [6] - Other significant products include Minsheng Bank's Rongmen Mixed Anti-Inflation Fund at 9.04% and Bank of China's mixed product at 7.43% [6][7] Group 3: 365-Day Holding Period Products - The top product in this category is Minsheng Bank's Jinzhuhua FOF with an impressive return of 45.26% [9] - Other notable products include Bank of China's mixed product at 9.50% and another mixed product at 9.41% [9]

银行渠道本周在售最低持有期理财产品榜单(9/22-9/28)
2 1 Shi Ji Jing Ji Bao Dao· 2025-09-22 07:04
Core Viewpoint - The article emphasizes the importance of distinguishing between various bank wealth management products with similar names and characteristics, providing a weekly performance ranking of these products to assist investors in making informed choices [1][2]. Group 1: Product Performance Rankings - The article presents a ranking of wealth management products based on their annualized returns for different holding periods: 7 days, 14 days, 30 days, and 60 days [1]. - For the 7-day holding period, the top-performing product is from Minsheng Bank with an annualized return of 9.75% [4]. - The 14-day holding period rankings show Minsheng Bank's product achieving an annualized return of 8.34% [6]. - In the 30-day holding period, Hangzhou Bank leads with a return of 24.26% [11]. - For the 60-day holding period, China Bank's product tops the list with a return of 26.21% [15]. Group 2: Investment Institutions - The ranking includes products from 28 distribution institutions, such as Industrial and Commercial Bank of China, Bank of China, Agricultural Bank of China, and others [1]. - The performance data is sourced from the Nanfang Financial Terminal, ensuring a comprehensive overview of available products [4][11][15]. Group 3: Methodology and Data Collection - The performance metrics are calculated based on the annualized yield over the respective holding periods, with the same institution and product series retained for comparison [1]. - The article advises investors to refer to the actual product listings on the banks' apps, as availability may vary due to factors like quota exhaustion [1].

亿道信息2025年中报简析:营收净利润同比双双增长,应收账款上升
Zheng Quan Zhi Xing· 2025-08-22 23:19
Core Viewpoint - The financial performance of Yidao Information (001314) for the first half of 2025 shows significant growth in revenue and net profit, although there are concerns regarding accounts receivable and cash flow [1][2]. Financial Performance Summary - Total revenue for the first half of 2025 reached 1.52 billion yuan, a year-on-year increase of 19.24% compared to 1.274 billion yuan in 2024 [1]. - Net profit attributable to shareholders was 11.41 million yuan, up 96.02% from 5.82 million yuan in the previous year [1]. - The gross profit margin decreased to 14.4%, down 13.58% year-on-year, while the net profit margin improved to 0.7%, an increase of 58.21% [1]. - The total of selling, administrative, and financial expenses was 87.73 million yuan, accounting for 5.77% of revenue, a decrease of 30.19% from the previous year [1]. - Earnings per share doubled to 0.08 yuan from 0.04 yuan, reflecting a 100% increase [1]. Balance Sheet Changes - Accounts receivable increased by 53.46%, rising to 371 million yuan from 242 million yuan [1]. - Cash and cash equivalents increased by 53.41% to 1.202 billion yuan [1]. - Interest-bearing debt surged by 461.93%, reaching 430 million yuan [1]. - Inventory saw a significant increase of 69.69%, attributed to expanded production scale and increased raw material and finished goods stock [1][2]. Cash Flow and Investment Activities - Operating cash flow per share decreased by 49.46% to -2.26 yuan, indicating cash flow challenges [1]. - The net cash flow from investing activities increased by 65.0%, due to a reduction in the purchase of financial products [3]. - The net increase in cash and cash equivalents rose by 80.42%, driven by reduced purchases of financial products [3]. Business Model and Market Position - Yidao Information primarily relies on research and marketing for its performance, with a focus on smart electronic products and solutions [5]. - The company’s product mix includes 75.04% from smart hardware, 9.39% from rugged smart industry terminals, and 11.58% from XR and IoT products [5]. - The return on invested capital (ROIC) for the previous year was 0.65%, indicating a need for improvement in capital efficiency [4][5].

深圳市同为数码科技股份有限公司 2024年度权益分派实施公告
Zhong Guo Zheng Quan Bao - Zhong Zheng Wang· 2025-06-30 23:18
Core Viewpoint - Shenzhen Tongwei Digital Technology Co., Ltd. has announced its 2024 annual equity distribution plan, which includes a cash dividend of 3.2 yuan per 10 shares for all shareholders, totaling approximately 69.97 million yuan [2][3][4]. Equity Distribution Plan - The total number of shares for the distribution is 218,666,131 after excluding 827,800 shares held in the repurchase account [2][3]. - The cash dividend will be distributed at a rate of 3.2 yuan per 10 shares, with a total cash dividend amounting to 69,973,161.92 yuan [2][4]. - The ex-dividend price will be adjusted to reflect the cash dividend, calculated as 3.187931 yuan per 10 shares after the distribution [4][8]. Key Dates - The record date for the equity distribution is set for July 8, 2025, and the ex-dividend date is July 9, 2025 [5]. Distribution Method - The cash dividends will be directly credited to the accounts of shareholders through their securities companies on the ex-dividend date [7]. Financial Management - The company has utilized its idle funds to purchase bank wealth management products, with a total investment of up to 500 million yuan planned for such investments [12][15]. - Recent redemptions of wealth management products yielded a total return of 642,991.79 yuan from investments of 11 million yuan [13].