RSI
Search documents
Bitcoin ETFs Score $149M Inflows during Price Drop: Accumulation Unfazed
Yahoo Finance· 2025-10-28 09:43
Group 1: Bitcoin and Ethereum ETF Inflows - Bitcoin spot ETFs attracted $149 million in net inflows on October 27, marking the third consecutive day of positive institutional demand despite a recent price drop [1] - Ethereum ETFs followed closely, pulling in $134 million with no outflows across all nine funds [1] - The broader market remains cautious with the Fear and Greed Index reading neutral at 42 [1] Group 2: Market Dynamics and Accumulation - Bitcoin has been trading in a defined range for around 120 days, forming a phase of "smart accumulation" according to on-chain data from CryptoQuant [2] - The Spot-to-Perpetual Volume Ratio on Binance remains elevated and stable, indicating that real buyers are holding their positions rather than exiting [2] - Analysts suggest that if the Spot-to-Perpetual Volume Ratio rises further alongside a price breakout, it would confirm a new bullish leg driven by strong spot demand [3] Group 3: Market Structure and Stability - Bitcoin's price has stabilized following an earlier drawdown, with the RSI rebounding from oversold levels and both Spot and Perpetual CVD metrics showing easing sell pressure and renewed buying activity [4] - Derivatives data indicates reduced leverage and a more balanced market, with open interest declining and funding rates turning positive, suggesting that traders are opening long positions [4] - Options activity remains strong, but overall spot volumes have dropped, with on-chain data showing quieter network activity and lower transaction volumes, indicating consolidation [5] Group 4: Bitcoin Price Analysis - Bitcoin currently trades near $114,143, having bounced from its lower Bollinger Band and the strong support zone between $104,500 and $109,500, with upper resistance around $118,600 [6] - The RSI at 53.2 indicates a neutral stance, while the Chaikin Money Flow (CMF) at -0.05 reveals that inflows and outflows are nearly balanced [6] - If Bitcoin's structure remains intact, a break above $118,600 could open the path to $125,000, while a drop below $109,000 could trigger a retest of $104,500 [7]
X @Ash Crypto
Ash Crypto· 2025-10-25 09:55
Everyone is shouting “cycle top”, others claiming Altseason is not happening.But the $ETH monthly chart tells a different story.Price has broken out of a 4-year accumulation range, retested cleanly, and is holding above key levels.RSI remains neutral, nowhere near the overbought levels we saw at the 2021 peak.When fear dominates the market, it often marks the bottom before the next leg up. ...
Top 2 Utilities Stocks You May Want To Dump This Quarter - Paranovus Entertainment (NASDAQ:PAVS), Black Hills (NYSE:BKH)
Benzinga· 2025-10-23 12:28
Group 1 - Two stocks in the utilities sector, Black Hills Corp and Spire Inc, are identified as potentially overbought based on momentum indicators [1][2] - Black Hills Corp has an RSI value of 72.9, indicating it is overbought, and its stock price has increased by approximately 10% over the past month, reaching a 52-week high of $65.59 [6] - Spire Inc has an RSI value of 75.2, also indicating it is overbought, with a stock price increase of around 11% over the past month and a 52-week high of $87.64 [6] Group 2 - Black Hills Corp recently announced a $450 million debt offering, and its stock closed at $65.25 after a 1.1% increase [6] - Mizuho analyst Gabriel Moreen maintained an Outperform rating for Spire Inc and raised its price target from $83 to $93, with the stock closing at $87.13 after a 0.3% gain [6] - Spire Inc will host a conference call on November 14 to discuss its fiscal fourth quarter and year-end financial results [6]


Top 2 Real Estate Stocks That May Crash This Month - Curbline Properties (NYSE:CURB), Essential Properties (NYSE:EPRT)
Benzinga· 2025-10-22 12:12
Core Insights - Two stocks in the real estate sector are showing signs of being overbought, which may concern momentum-focused investors [1][2] Company Summaries - **Curbline Properties Corp. (NYSE:CURB)**: - Upgraded from Equal-Weight to Overweight by Morgan Stanley analyst Ronald Kamdem with a price target of $27 - Stock gained approximately 7% over the past month, reaching a 52-week high of $25.69 - RSI Value is 73.9, indicating overbought conditions - Recent price action shows shares rose 3.2% to close at $24.23 [3][6] - **Essential Properties Realty Trust Inc (NYSE:EPRT)**: - Initiated coverage with a Buy rating by Berenberg analyst Kai Klose, with a price target of $36 - Stock gained around 6% over the past five days, achieving a 52-week high of $34.88 - RSI Value is 72.4, also indicating overbought conditions - Recent price action shows shares gained 0.8% to close at $31.63 [4][6]

Top 3 Industrials Stocks That May Rocket Higher In Q4
Benzinga· 2025-10-22 11:54
Core Insights - The industrials sector has several oversold stocks, presenting potential buying opportunities for undervalued companies [1][2] Group 1: Oversold Stocks - TaskUs (NYSE:TASK) has an RSI of 29.4, with a recent stock price of $13.65 after a 1.1% increase. The stock fell approximately 13% over the past month, reaching a 52-week low of $11.26 [5] - Lindsay Corp (NYSE:LNN) has an RSI of 29.3, with shares closing at $128.85 after a 0.2% increase. The stock has decreased around 8% in the last month, with a 52-week low of $112.14 [5] - GATX Corp (NYSE:GATX) has an RSI of 25.7, with shares closing at $163.02 after a 5.8% decline. The stock fell about 7% over the past five days, reaching a 52-week low of $134.01 [8] Group 2: Company Developments - TaskUs was upgraded from Neutral to Outperform by Baird analyst David Koning, maintaining a price target of $18 [5] - Lindsay Corp appointed Sam Hinrichsen as SVP and CFO, effective January 1, 2026, to support long-term growth initiatives [5] - GATX reported mixed quarterly results, with CEO Robert C. Lyons stating that market conditions remain consistent with expectations [8]

Options Corner: TXN Earnings Trade Example
Youtube· 2025-10-21 13:30
Core Insights - Texas Instruments (TXN) has underperformed in the semiconductor sector, with a decline of approximately 8.2% this year, while the semiconductor ETF (SMH) has increased by about 37% [1][2] - TXN focuses on stable, reliable chips for industrial and automotive markets, differentiating it from high-end computer chip companies like Nvidia and Intel [2][3] Market Trends - The semiconductor sector shows varied performance, indicating that not all companies are equally positioned within the industry [3] - A falling wedge pattern has been observed in TXN's price action since reaching highs near 221, with key support levels identified between 172 and 175 [3][4] Technical Analysis - The price has recently bounced back to the middle of the trading range, with resistance noted around 187 and a significant trading area near 185 [4][6] - The RSI is nearing a bullish crossover, which could indicate a shift in momentum [5][6] Trading Strategy - An example trade strategy involves buying a call option at the 180 strike price and selling a call option at the 190 strike price, creating a bullish $10 wide call diagonal [9][10] - The trade anticipates a rebound, with a break-even point above 182, which is slightly over 1% above the current share price [12][13] - The strategy leverages implied volatility differences, with the October 31st weekly 180 call at 59% and the October 24th 190 call at 82% [10][12]
Huge Hedera HBAR Update | Don't Miss This Opportunity!
NCashOfficial - Daily Crypto & Finance News· 2025-10-20 21:00
Market Analysis and Price Prediction - The cryptocurrency market is currently experiencing a sell-off, requiring patience and consolidation before a potential uptrend [3] - HBAR's RSI indicates oversold conditions, suggesting a possible bottoming out, but confirmation depends on Bitcoin's performance [9][10][11] - A key level to watch for HBAR is flipping the blue zone between 18.15% cents to 21.15% cents, which could signal an uptrend retest [6] - Breaking above the 29 cents level, referencing a previous high in February, is a target after overcoming the blue zone [8] - Losing previous lows and RSI dipping into the red would indicate a broken structure and a bearish outlook for HBAR [14] Hedera Ecosystem and Development - Hedera's ecosystem shows significant development activity, with a surge in active developer accounts and API relays processed [20][23] - Stargate Finance brings wrapped Ethereum to Hedera DeFi, enabling more DeFi use cases and user expansion [22] - SaucerSwap's quarter 3 trading volume climbed 88% to $974 million, with total value locked growing 67% to nearly $99 million, and active users increased 23% [24] - Thrive-funded projects generated over 2 million transactions across six applications, reaching 152,000+ users [25] - Lloyd's Banking Group and Aberdeen used Hedera-based RWAs as collateral for foreign exchange, signaling institutional finance moving to production on public blockchain infrastructure [28] Market Expansion and Fundamentals - HBAR is listed on over 161 platforms with 160+ pairs, and continues to be added to more exchanges, expanding market access [15][16][30] - Fundamentals, including ecosystem growth and real-world applications, are crucial for long-term value creation and demand, despite current price volatility [35][36][38] - Zooming out on the charts reveals that many old coin charts are not broken, and the one-year performance for HBAR is still up 200+% [33][34]

10月17日【港股Podcast】恆指、美團、寧德時代、中移動、中海油、匯豐
Ge Long Hui· 2025-10-20 11:01
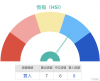
Market Overview - The Hang Seng Index (HSI) closed at approximately 25,247 points on October 17, indicating a significant decline, having breached key technical levels such as the lower boundary of the Bollinger Bands [1][2] - The market sentiment is affected by this drop, with many investors feeling psychological pressure due to the volatility [2] Technical Analysis - Currently, there are 8 buy signals and 7 sell signals for the HSI, suggesting a slight bias towards buying in the short term [3][7] - The immediate support level for the HSI is around 24,800 points; if this level is breached, the next support is approximately 23,700 points [4][5] - Investors are advised to select products with recovery prices further from the support level to mitigate risks associated with sudden market declines [5] Individual Stock Analysis Meituan (03690) - Meituan's stock price has also been declining, closing at 94.5 HKD, having breached the lower boundary of the Bollinger Bands [9] - The first support level is around 91.1 HKD; if this is broken, the next support is at approximately 85.8 HKD [9][10] - Technical signals for Meituan show 9 buy signals and 4 sell signals, indicating a slight preference for buying [12] Contemporary Amperex Technology Co. (03750) - The stock closed at 521.5 HKD, down from a high of 614 HKD, with a neutral technical signal showing 5 buy and 5 sell signals [14][15] - The support level is around 477 HKD, which is close to the lower boundary of the Bollinger Bands [15] China Mobile (00941) - China Mobile's stock closed at 85.3 HKD, maintaining a neutral technical signal with potential resistance at 88.5 HKD [17][18] - If the stock price continues to rise, it could reach 91.8 HKD if it breaks the resistance level [17] China National Petroleum Corporation (00857) - The stock closed at 7.32 HKD, with a bearish technical signal showing 8 sell signals and 5 buy signals [23][24] - The first resistance level is at 7.5 HKD, and if this is surpassed, it could rise to 7.7 HKD [23] HSBC Holdings (00005) - HSBC's stock closed at 100.9 HKD, just above the support level of 96.7 HKD [29][30] - The technical signals show 8 buy signals and 7 sell signals, indicating a slight preference for buying [32]
Top 3 Energy Stocks That May Rocket Higher In October - Mach Natural Resources (NYSE:MNR), Global Partners (NYSE:GLP)
Benzinga· 2025-10-17 11:12
Core Insights - The energy sector has several oversold stocks, presenting potential buying opportunities for undervalued companies [1] - The Relative Strength Index (RSI) is a key indicator for identifying oversold conditions, typically below 30 [1] Company Summaries - **Mach Natural Resources LP (NYSE:MNR)**: Filed for a mixed shelf of up to $250 million; stock fell approximately 12% over the past month with a 52-week low of $11.91; RSI value is 27.3; shares closed at $12.07, down 1.6% [7] - **Global Partners LP (NYSE:GLP)**: Reported weaker-than-expected Q2 results; stock declined around 14% in the last month with a 52-week low of $43.20; RSI value is 25.8; shares closed at $43.89, down 2.4% [7] - **SM Energy Co (NYSE:SM)**: Analyst maintained a Sector Perform rating and raised the price target from $34 to $35; stock fell about 21% over the past month with a 52-week low of $19.67; RSI value is 29.9; shares closed at $21.79, down 1.5% [7]
