SMART-CORE(02166)
Search documents
半导体普涨 中芯国际涨4% AI推动需求 10月全球半导体销售额同比大增
Ge Long Hui· 2025-12-08 03:14
Group 1 - The core viewpoint of the news is that the semiconductor stocks in Hong Kong experienced a collective rise, driven by a significant increase in global semiconductor sales, particularly in the DRAM segment, due to the surge in demand from artificial intelligence (AI) applications [1][2] Group 2 - On December 8, Hong Kong semiconductor stocks saw notable increases, with Hua Hong Semiconductor rising by 4.4%, SMIC by 4%, Shanghai Fudan by over 3%, and others also showing gains [1] - According to the Semiconductor Industry Association (SIA), global semiconductor sales in October reached $71.3 billion, marking a 33% year-on-year increase, with DRAM sales soaring by 90% [1] - The Asia-Pacific region experienced a remarkable year-on-year sales growth of 59.6% in the semiconductor sector [1] Group 3 - The primary driver behind this growth is the escalating demand for AI, which has led to a shift in industry capacity towards high-bandwidth memory (HBM) for AI accelerators, resulting in reduced wafer output for standard DRAM and 3D NAND [1] - The ongoing AI infrastructure development is causing shortages in critical components like storage chips, which may lead to a sustained increase in DRAM prices through 2026 [1] - Counterpoint Research predicts that prices for advanced and traditional storage chips could rise by an additional 20% by early 2026 [1]


港股异动丨半导体普涨 中芯国际涨4% AI推动需求 10月全球半导体销售额同比大增
Ge Long Hui· 2025-12-08 03:05
Group 1 - The core viewpoint of the news is that semiconductor stocks in Hong Kong have collectively risen, driven by a significant increase in global semiconductor sales, particularly in the DRAM segment, due to the surge in demand from artificial intelligence (AI) applications [1][2] Group 2 - Hong Kong semiconductor stocks saw notable increases, with Hua Hong Semiconductor rising by 4.4%, SMIC by 4%, and Shanghai Fudan by over 3% [1] - According to the Semiconductor Industry Association (SIA), global semiconductor sales in October reached $71.3 billion, marking a year-on-year increase of 33%, with DRAM sales soaring by 90% [1] - The Asia-Pacific region experienced a significant year-on-year sales growth of 59.6% [1] Group 3 - The primary driver behind this growth is the demand surge from AI, leading to a shift in industry capacity towards high-bandwidth memory (HBM) for AI accelerators, which has reduced the wafer output for standard DRAM and 3D NAND [1] - The current AI infrastructure boom is causing shortages in key components like storage chips, which may lead to a continued increase in DRAM average prices through 2026 [1] - Counterpoint Research predicts that prices for advanced and traditional storage chips could rise by another 20% by early 2026 [1]
芯智控股(02166) - 截至2025年11月30日止月份之股份发行人的证券变动月报表
2025-12-03 08:46
股份發行人及根據《上市規則》第十九B章上市的香港預託證券發行人的證券變動月報表 | 截至月份: | | --- | | 2025年11月30日 | | 狀態: 新提交 | 致:香港交易及結算所有限公司 公司名稱: 芯智控股有限公司 呈交日期: 2025年12月3日 I. 法定/註冊股本變動 FF301 第 1 頁 共 10 頁 v 1.1.1 FF301 II. 已發行股份及/或庫存股份變動 | 1. 股份分類 | 普通股 | 股份類別 | 不適用 | | 於香港聯交所上市 (註1) | 是 | | | --- | --- | --- | --- | --- | --- | --- | --- | | 證券代號 (如上市) | 02166 | 說明 | | | | | | | | | 已發行股份(不包括庫存股份)數目 | | 庫存股份數目 | | 已發行股份總數 | | | 上月底結存 | | | 488,681,030 | | 0 | | 488,681,030 | | 增加 / 減少 (-) | | | 0 | | 0 | | | | 本月底結存 | | | 488,681,030 | | 0 | | 4 ...
Futu Trustee Limited增持芯智控股13.6万股 每股作价1.8606港元
Zhi Tong Cai Jing· 2025-11-18 10:58
Core Viewpoint - Futu Trustee Limited has increased its stake in ChipMOS Technologies Inc. (02166) by acquiring 136,000 shares at a price of HKD 1.8606 per share, totaling approximately HKD 253,040, resulting in a new holding of about 34.24026 million shares, representing a 7.01% ownership [1] Group 1 - Futu Trustee Limited's acquisition of 136,000 shares indicates a strategic investment move [1] - The purchase price of HKD 1.8606 per share reflects the current market valuation of ChipMOS Technologies [1] - The total investment amount of approximately HKD 253,040 shows the scale of the transaction [1] Group 2 - The updated holding of approximately 34.24026 million shares signifies a notable increase in Futu Trustee Limited's investment in ChipMOS Technologies [1] - The new ownership percentage of 7.01% positions Futu Trustee Limited as a significant stakeholder in the company [1]
Futu Trustee Limited增持芯智控股(02166)13.6万股 每股作价1.8606港元
智通财经网· 2025-11-18 10:54
Core Viewpoint - Futu Trustee Limited has increased its stake in Chipbond Technology Corporation (02166) by acquiring 136,000 shares at a price of HKD 1.8606 per share, totaling approximately HKD 253,040, resulting in a new holding of about 34.24026 million shares, representing 7.01% ownership [1] Group 1 - Futu Trustee Limited's acquisition of shares indicates a positive outlook on Chipbond Technology Corporation's performance [1] - The total amount spent on the share purchase was approximately HKD 253,040 [1] - The increase in ownership percentage to 7.01% reflects a significant investment commitment by Futu Trustee Limited [1]
芯智控股(02166) - 截至2025年10月31日止月份之股份发行人的证券变动月报表
2025-11-03 09:54
| | | 致:香港交易及結算所有限公司 公司名稱: 芯智控股有限公司 呈交日期: 2025年11月3日 I. 法定/註冊股本變動 | 1. 股份分類 | 普通股 | 股份類別 | 不適用 | | | 於香港聯交所上市 (註1) | | 是 | | | --- | --- | --- | --- | --- | --- | --- | --- | --- | --- | | 證券代號 (如上市) | 02166 | 說明 | | | | | | | | | | | 法定/註冊股份數目 | | | 面值 | | | 法定/註冊股本 | | | 上月底結存 | | | 5,000,000,000 | USD | | 0.00001 | USD | | 50,000 | | 增加 / 減少 (-) | | | | | | | USD | | | | 本月底結存 | | | 5,000,000,000 | USD | | 0.00001 | USD | | 50,000 | 股份發行人及根據《上市規則》第十九B章上市的香港預託證券發行人的證券變動月報表 II. 已發行股份及/或庫存股份變動 | 1. 股份分類 | 普 ...
半导体股再度活跃 中芯国际连涨3日 政策叠加行业高景气
Ge Long Hui· 2025-10-28 03:14
Group 1 - Semiconductor stocks in Hong Kong are actively trading, with notable increases in shares such as SMIC rising by 3% and Fudan Microelectronics by 3.3% [1] - The Fourth Plenary Session's communiqué emphasizes high-quality development and significant improvements in technological self-reliance during the 14th Five-Year Plan period [1] - Global memory prices are on the rise, with Samsung and SK Hynix notifying clients of potential increases in DRAM and NAND contract prices by up to 30% in Q4 [1] Group 2 - The core driver for the continuous miniaturization of integrated circuit chips is lithography technology [1] - A research team from Peking University has successfully utilized cryo-electron tomography to analyze the three-dimensional structure and entanglement behavior of photoresist molecules in situ, leading to industrial solutions that significantly reduce lithography defects [1]
【港股收评】10月开门红!恒科指涨3.36%,芯片股全线爆发
Sou Hu Cai Jing· 2025-10-02 08:58
Group 1: Market Overview - The Hong Kong stock market indices rose collectively, with the Hang Seng Index increasing by 1.61%, the National Enterprises Index by 1.77%, and the Hang Seng Tech Index by 3.36% due to rising expectations of a Federal Reserve interest rate cut [1] - Chip stocks experienced significant gains, with SMIC (00981.HK) up 12.7%, ChipMOS Technologies (02166.HK) up 10.71%, and Hua Hong Semiconductor (01347.HK) up 7.12% [1] - The AI investment surge is driving demand for semiconductor storage, supported by domestic wafer fabrication expansion plans [1] Group 2: Sector Performance - Gold and precious metals stocks saw substantial increases, with Tongguan Gold (00340.HK) rising 15.13% and Zijin Mining (02899.HK) up 3.99%, driven by lower-than-expected U.S. employment data and heightened gold price expectations [2] - The automotive supply chain, including lithium battery and electric vehicle stocks, performed well, with Tianqi Lithium (09696.HK) up 12.93% and BYD Electronics (00285.HK) up 6.63% [2] - Biopharmaceuticals, innovative drugs, and medical outsourcing sectors also showed strong performance [3] Group 3: Underperforming Sectors - The real estate sector declined, with companies like Oceanwide Holdings (03377.HK) down 4.38% and China Resources Land (01109.HK) down 3.42% [3] - Consumer sectors, including film, aviation, education, dairy products, sports goods, and luxury goods, faced pressure and showed weakness [4]
芯智控股(02166) - 截至2025年9月30日止月份之股份发行人的证券变动月报表
2025-10-02 08:44
股份發行人及根據《上市規則》第十九B章上市的香港預託證券發行人的證券變動月報表 增加 / 減少 (-) USD | 截至月份: | 2025年9月30日 | | | | 狀態: 新提交 | | --- | --- | --- | --- | --- | --- | | 致:香港交易及結算所有限公司 | | | | | | | 公司名稱: | 芯智控股有限公司 | | | | | | 呈交日期: | 2025年10月2日 | | | | | | I. 法定/註冊股本變動 | | | | | | | 1. 股份分類 | 普通股 | 股份類別 | 不適用 | 於香港聯交所上市 (註1) | 是 | | 50,000 | | --- | | USD | | 本月底法定/註冊股本總額: | FF301 第 1 頁 共 10 頁 v 1.1.1 證券代號 (如上市) 02166 說明 法定/註冊股份數目 面值 法定/註冊股本 上月底結存 5,000,000,000 USD 0.00001 USD 50,000 本月底結存 5,000,000,000 USD 0.00001 USD 50,000 FF301 II. 已發行 ...
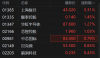
港股半导体股全线上涨,中芯国际涨超7%
Ge Long Hui A P P· 2025-10-02 02:40
Core Viewpoint - The semiconductor stocks in Hong Kong experienced a significant increase, with notable gains from major companies such as SMIC and others in the sector [1]. Group 1: Stock Performance - SMIC (00981) rose by 7.98%, reaching a latest price of 85.900, with a total market capitalization of 687.175 billion and a year-to-date increase of 170.13% [2]. - Meijiaxin Holdings (06939) increased by 5.26%, with a latest price of 0.600 and a market cap of 0.0311 billion, showing a year-to-date rise of 31.87% [2]. - Hongguang Semiconductor (06908) saw a 4.76% increase, with a latest price of 0.660 and a market cap of 0.62 billion, but a year-to-date decline of 1.49% [2]. - Xian Sihang (00595) gained 3.85%, with a latest price of 0.405 and a market cap of 0.368 billion, reflecting a year-to-date decrease of 10.99% [2]. - ASMPT (00522) rose by 2.25%, with a latest price of 83.900 and a market cap of 34.941 billion, showing a year-to-date increase of 12.89% [2]. Group 2: Other Notable Stocks - Horizon Robotics (09660) increased by 1.77%, with a latest price of 9.750 and a market cap of 135.343 billion, reflecting a year-to-date increase of 170.83% [2]. - Jingmen Semiconductor (02878) rose by 1.69%, with a latest price of 0.600 and a market cap of 14.99 billion, showing a year-to-date increase of 21.21% [2]. - Beike Micro (02149) increased by 1.42%, with a latest price of 53.600 and a market cap of 3.377 billion, reflecting a year-to-date increase of 97.06% [2].
