财务指标分析
Search documents
【报喜鸟(002154.SZ)】Q3收入增速环比转正,经营质量仍有承压——2025年三季报点评(姜浩/孙未未/朱洁宇)
光大证券研究· 2025-10-28 23:08
Core Viewpoint - The report highlights the financial performance of Baoxiniang for the first three quarters of 2025, indicating a decline in revenue and net profit compared to the previous year, with a slight recovery in Q3 revenue growth [4][5]. Financial Performance Summary - For the first three quarters of 2025, Baoxiniang achieved a revenue of 3.48 billion yuan, a year-on-year decrease of 1.6%, and a net profit attributable to shareholders of 240 million yuan, down 43.2% year-on-year [4]. - The earnings per share (EPS) for the period was 0.16 yuan, with quarterly revenues for Q1, Q2, and Q3 being 1.30 billion, 1.09 billion, and 1.09 billion yuan respectively, showing a year-on-year change of -3.7%, -3.5%, and +3.1% [4]. Brand and Channel Performance - In the first half of 2025, Baoxiniang's revenue decreased by 9.6%, while other brands like Haggis and Lefeiye saw increases of 8.4% and 20.5% respectively [5]. - The revenue distribution by channel showed that direct sales, online, group purchases, and franchise income accounted for 43.2%, 18.7%, 17.8%, and 13.1% respectively, with online sales growing by 17.7% year-on-year [5]. Operational Metrics - As of June 2025, the number of stores for Baoxiniang was 817, a decrease of 4 from the beginning of the year, while Haggis and Lefeiye saw increases in store count [5]. - The total number of direct and franchise stores was 837 and 972 respectively, with a net decrease in direct stores for Baoxiniang [5]. Margin and Cost Analysis - The gross margin for the first three quarters of 2025 decreased by 0.2 percentage points to 65.6%, with quarterly margins showing mixed results [6]. - The expense ratio increased by 5.7 percentage points to 55.6%, driven primarily by higher sales and management expenses [6]. Inventory and Cash Flow - As of September 2025, inventory increased by 17.0% to 1.41 billion yuan, with inventory turnover days rising by 21 days to 308 days [7]. - Operating net cash flow for the first three quarters was 100 million yuan, a decrease of 32.1% year-on-year [7].


Here's What Key Metrics Tell Us About NextEra (NEE) Q3 Earnings
ZACKS· 2025-10-28 14:36
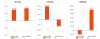
Core Insights - NextEra Energy reported $7.97 billion in revenue for Q3 2025, a year-over-year increase of 5.3% [1] - The EPS for the same period was $1.13, up from $1.03 a year ago, with an EPS surprise of +8.65% compared to the consensus estimate of $1.04 [1] - The revenue fell short of the Zacks Consensus Estimate by -1.86% [1] Financial Performance Metrics - NextEra Energy Resources (NEER) reported operating revenues of $2.57 billion, which is -0.7% year-over-year and below the average estimate of $2.95 billion [4] - Florida Power & Light (FPL) reported operating revenues of $5.29 billion, exceeding the average estimate of $5.17 billion, representing a +7% year-over-year change [4] - Operating income for FPL was $1.8 billion, lower than the estimated $2.02 billion [4] - Corporate & Other segment reported an operating loss of $71 million, worse than the average estimate of a $45 million loss [4] - NEER's operating income was $801 million, significantly below the estimated $1.19 billion [4] Stock Performance - NextEra's shares have returned +12.9% over the past month, outperforming the Zacks S&P 500 composite's +3.6% change [3] - The stock currently holds a Zacks Rank 3 (Hold), indicating expected performance in line with the broader market [3]

盘江股份(600395.SH):2025年三季报净利润为-1738.31万元,同比由盈转亏
Xin Lang Cai Jing· 2025-10-28 02:27
Core Insights - Company reported a total operating revenue of 7.23 billion, an increase of 781 million compared to the same period last year, representing a year-on-year growth of 12.11% [1] - The net profit attributable to shareholders was -17.38 million, a decrease of 52.57 million compared to the same period last year, reflecting a year-on-year decline of 149.40% [1] Financial Performance - Operating cash flow net inflow was 591 million, an increase of 715 million compared to the same period last year [1] - The latest debt-to-asset ratio is 75.11%, an increase of 0.21 percentage points from the previous quarter and an increase of 4.34 percentage points from the same period last year [3] - The latest gross profit margin is 22.41%, an increase of 0.63 percentage points from the previous quarter, but a decrease of 2.94 percentage points from the same period last year [3] - The latest return on equity (ROE) is -0.17%, a decrease of 0.48 percentage points from the same period last year [3] - The diluted earnings per share is -0.01, a decrease of 0.02 from the same period last year, reflecting a year-on-year decline of 150.00% [3] - The latest total asset turnover ratio is 0.16 times, a decrease of 0.01 times from the same period last year [3] - The latest inventory turnover ratio is 6.53 times, a decrease of 2.95 times from the same period last year, representing a year-on-year decline of 31.14% [3] Shareholder Structure - The number of shareholders is 42,500, with the top ten shareholders holding 1.341 billion shares, accounting for 62.45% of the total share capital [3] - The largest shareholder is Guizhou Energy Group Co., Ltd., holding 45.5% of the shares [3]
包钢股份(600010.SH):2025年三季报净利润为2.33亿元,同比扭亏为盈
Xin Lang Cai Jing· 2025-10-28 02:27
Core Insights - Baosteel Co., Ltd. (600010.SH) reported a total operating revenue of 48.08 billion yuan for Q3 2025, with a net profit attributable to shareholders of 233 million yuan, an increase of 749 million yuan compared to the same period last year [1] Financial Performance - The company's latest asset-liability ratio stands at 60.46% [3] - The gross profit margin is 9.99%, up by 0.43 percentage points from the previous quarter, marking three consecutive quarters of increase, and up by 2.11 percentage points year-on-year [3] - Return on equity (ROE) is 0.45%, an increase of 1.45 percentage points compared to the same period last year [3] - The diluted earnings per share (EPS) is 0.01 yuan, an increase of 0.02 yuan year-on-year [3] - Total asset turnover ratio is 0.31 times, and inventory turnover ratio is 2.98 times, which is an increase of 0.19 times year-on-year, reflecting a 6.91% increase compared to the same period last year [3] Shareholder Structure - The number of shareholders is 830,200, with the top ten shareholders holding a total of 28.147 billion shares, accounting for 62.15% of the total share capital [3] - The largest shareholder is Baotou Iron and Steel (Group) Co., Ltd., holding 5.53 billion shares [3]

申通快递(002468.SZ):2025年三季报净利润为7.56亿元
Xin Lang Cai Jing· 2025-10-28 02:27
2025年10月28日,申通快递(002468.SZ)发布2025年三季报。 公司最新总资产周转率为1.45次。最新存货周转率为424.70次。 公司股东户数为4.07万户,前十大股东持股数量为9.95亿股,占总股本比例为65.03%,前十大股东持股情况如下: | 序号 | 股东名称 | 持股 | | --- | --- | --- | | l | 浙江菜鸟供应链管理有限公司 | 25.01 | | 2 | 上海恭之润实业发展有限公司 | 16.1 | | 3 | 上海德殷投资控股有限公司 | 7.76 | | 4 | 上海德润二实业发展有限公司 | 4.90 | | 5 | 陈德军 | 3.38 | | 6 | 陈小英 | 2.65 | | 7 | 香港中央结算有限公司 | 2.03 | | 8 | 珠海市天阔投资合伙企业(有限合伙) | 1.19 | | g | 上海思勰投资管理有限公司-思勰投资梧桐一号私募证券投资基金 | 1.06 | | 10 | 广发基金管理有限公司-社保基金四二零组合 | 0.96 | 公司最新资产负债率为63.10%,较上季度资产负债率增加0.71个百分点,较去年同期资产负债率 ...

新兴铸管(000778.SZ):2025年三季报净利润为6.99亿元、同比较去年同期上涨44.67%
Xin Lang Cai Jing· 2025-10-28 02:27
Core Insights - The company reported a total operating revenue of 27.183 billion yuan for Q3 2025, an increase of 1.03 billion yuan or 0.38% year-on-year [1] - The net profit attributable to shareholders reached 699 million yuan, up by 216 million yuan or 44.67% compared to the same period last year [1] - The net cash inflow from operating activities was 736 million yuan, an increase of 2.504 billion yuan year-on-year [1] Financial Performance - The latest debt-to-asset ratio is 46.33%, a decrease of 1.25 percentage points from the previous quarter and 1.32 percentage points from the same period last year [3] - The gross profit margin stands at 7.87%, up by 0.01 percentage points from the previous quarter and 2.28 percentage points year-on-year [3] - The return on equity (ROE) is 2.67%, an increase of 0.79 percentage points compared to the same period last year [3] Earnings and Efficiency Metrics - The diluted earnings per share (EPS) is 0.18 yuan, an increase of 0.06 yuan or 45.54% year-on-year [4] - The total asset turnover ratio is 0.51 times, an increase of 0.02 times or 3.26% year-on-year [4] - The inventory turnover ratio is 4.62 times, up by 0.19 times or 4.24% compared to the same period last year [4] Shareholder Information - The number of shareholders is 120,200, with the top ten shareholders holding 1.927 billion shares, accounting for 48.63% of the total share capital [4] - The largest shareholder is Xinxing Jihua Group Co., Ltd., holding 41.34% of the shares [4]

渤海股份(000605.SZ):2025年三季报净利润为1320.15万元、同比较去年同期上涨9.17%
Xin Lang Cai Jing· 2025-10-28 02:27
Core Insights - The company reported a total operating revenue of 1.135 billion yuan for Q3 2025, with a net profit attributable to shareholders of 13.2015 million yuan, marking a year-on-year increase of 9.17% [1] - The company achieved a net cash inflow from operating activities of 26.2386 million yuan, reflecting a slight year-on-year increase of 0.50% [1] Financial Performance - The latest asset-liability ratio stands at 66.09%, a decrease of 0.39 percentage points compared to the same period last year [3] - The gross profit margin is reported at 22.36%, an increase of 0.26 percentage points from the previous quarter, indicating two consecutive quarters of growth [3] - The return on equity (ROE) is at 0.62%, up by 0.05 percentage points year-on-year [3] - The diluted earnings per share remained stable compared to the same period last year, with a year-on-year increase of 9.04% [3] Operational Efficiency - The total asset turnover ratio is recorded at 0.14 times, while the inventory turnover ratio is at 10.78 times [4] Shareholder Structure - The number of shareholders is 23,200, with the top ten shareholders holding a total of 181 million shares, accounting for 51.45% of the total share capital [4] - The largest shareholder is Tianjin Xingjin Enterprise Management Co., Ltd., holding 22.46% of the shares [4]

上海凤凰(600679.SH):2025年三季报净利润为1.16亿元、同比较去年同期上涨131.69%
Xin Lang Cai Jing· 2025-10-28 02:23
Core Insights - Shanghai Phoenix (600679.SH) reported a total operating revenue of 1.835 billion yuan for Q3 2025, marking a year-on-year increase of 0.15% and achieving three consecutive years of growth [1] - The net profit attributable to shareholders reached 116 million yuan, an increase of 66.06 million yuan compared to the same period last year, representing a year-on-year growth of 131.69% and two consecutive years of profit growth [1] - The net cash inflow from operating activities was 58.80 million yuan [1] Financial Ratios - The latest debt-to-asset ratio stands at 40.01%, ranking second among disclosed peers, with a decrease of 2.55 percentage points from the previous quarter [3] - The gross profit margin is 16.01%, ranking fifth among disclosed peers, with an increase of 1.03 percentage points from the previous quarter and 1.77 percentage points from the same period last year, achieving two consecutive years of growth [3] - The return on equity (ROE) is 5.43%, an increase of 3.19 percentage points compared to the same period last year [3] Earnings Per Share and Turnover Ratios - The diluted earnings per share (EPS) is 0.23 yuan, an increase of 0.13 yuan compared to the same period last year, achieving three consecutive years of growth and a year-on-year increase of 131.52% [3] - The total asset turnover ratio is 0.53 times, while the inventory turnover ratio is 6.35 times, ranking fifth among disclosed peers, with a year-on-year increase of 0.62 times, achieving three consecutive years of growth and a year-on-year increase of 10.74% [3] Shareholder Structure - The number of shareholders is 45,000, with the top ten shareholders holding 223 million shares, accounting for 43.28% of the total share capital [3] - The largest shareholder is the State-owned Assets Supervision and Administration Commission of Jinshan District, holding 22.7 million shares [3]

康欣新材(600076.SH):2025年三季报净利润为-1.89亿元,同比亏损扩大
Xin Lang Cai Jing· 2025-10-28 02:18
Core Insights - The company reported a significant decline in total revenue and net profit for Q3 2025, indicating ongoing financial challenges [1][3] - The company's gross margin remains negative, although it has shown slight improvement over the last two quarters [3] Financial Performance - Total revenue for Q3 2025 was 278 million yuan, a decrease of 216 million yuan or 43.74% year-on-year [1] - The net profit attributable to shareholders was -189 million yuan, a decrease of 63.94 million yuan compared to the same period last year [1] - Operating cash flow showed a net outflow of 61.79 million yuan, down 146 million yuan or 173.07% year-on-year [1] Profitability Metrics - The latest gross margin was -22.43%, an increase of 1.32 percentage points from the previous quarter but a decrease of 19.50 percentage points year-on-year [3] - Return on equity (ROE) was -4.97%, down 2.00 percentage points from the same period last year [3] - The diluted earnings per share were -0.14 yuan, a decrease of 0.05 yuan year-on-year [3] Efficiency Ratios - The total asset turnover ratio was 0.04 times, a decrease of 0.03 times year-on-year, reflecting a decline of 42.19% [3] - The inventory turnover ratio was 0.09 times, down 0.04 times from the previous year, indicating a decrease of 32.05% [3] Shareholder Information - The number of shareholders is 43,000, with the top ten shareholders holding 575 million shares, accounting for 42.79% of the total share capital [3] - The largest shareholder is Wuxi Construction Development Investment Co., Ltd., holding 38.8% of the shares [3]

哈森股份(603958.SH):2025年三季报净利润为-1847.44万元
Xin Lang Cai Jing· 2025-10-28 01:37
Core Insights - The company reported a total revenue of 1.058 billion yuan for Q3 2025, with a net profit attributable to shareholders of -18.4744 million yuan [2] - The operating cash flow showed a net inflow of 32.4603 million yuan [2] Financial Performance - The latest debt-to-asset ratio is 57.37%, which is an increase of 4.42 percentage points from the previous quarter and an increase of 43.25 percentage points year-on-year [4] - The gross profit margin is 36.11%, down by 2.39 percentage points from the previous quarter and down by 17.30 percentage points compared to the same period last year [4] - The return on equity (ROE) stands at -2.68% [4] - The diluted earnings per share (EPS) is -0.08 yuan [5] Efficiency Metrics - The total asset turnover ratio is 0.57 times, a decrease of 0.04 times year-on-year, reflecting a decline of 5.86% [5] - The inventory turnover ratio is 1.63 times [5] Shareholder Structure - The number of shareholders is 15,400, with the top ten shareholders holding a total of 146 million shares, accounting for 66.38% of the total share capital [5] - The largest shareholder is Zhenxing International Co., Ltd., holding 62.13% of the shares [5]
