TRIO IND ELEC(01710)
Search documents
致丰工业电子(01710) - 截至二零二五年十月三十一日止月份股份发行人的证券变动月报表
2025-11-05 09:23
股份發行人及根據《上市規則》第十九B章上市的香港預託證券發行人的證券變動月報表 截至月份: 2025年10月31日 狀態: 新提交 致:香港交易及結算所有限公司 公司名稱: 致豐工業電子集團有限公司 呈交日期: 2025年11月5日 I. 法定/註冊股本變動 不適用 FF301 第 1 頁 共 10 頁 v 1.1.1 FF301 II. 已發行股份及/或庫存股份變動 | 1. 股份分類 | 普通股 | | 股份類別 | 不適用 | | 於香港聯交所上市 (註1) | 是 | | | --- | --- | --- | --- | --- | --- | --- | --- | --- | | 證券代號 (如上市) | 01710 | 說明 | | | | | | | | | | 已發行股份(不包括庫存股份)數目 | | | 庫存股份數目 | | 已發行股份總數 | | | 上月底結存 | | | | 1,000,000,000 | | 0 | | 1,000,000,000 | | 增加 / 減少 (-) | | | | | | | | | | 本月底結存 | | | | 1,000,000,000 | | ...
连续六年东北大米中国销量领先,十月稻田新米季再塑行业增长新范式
Huan Qiu Wang· 2025-10-31 08:38
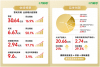
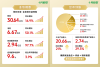
Core Insights - The core viewpoint of the articles highlights the significant growth of October Rice in both revenue and net profit, driven by innovative marketing strategies and a robust supply chain, positioning the brand as a leader in the household food sector in China [1][9]. Financial Performance - In the first half of 2025, October Rice achieved total revenue of 3.064 billion yuan, a year-on-year increase of 16.9% - Adjusted net profit reached 294 million yuan, showing a substantial year-on-year growth of 97.7% - The adjusted net profit margin improved from 5.7% in the same period last year to 9.6% [1]. Marketing Strategy - October Rice employed a dual strategy of "new generation celebrity endorsement + authoritative media empowerment" to effectively convert traffic into sales during the new rice season [3]. - The brand targeted the "Z generation emotional consumption" demand by collaborating with popular actor Ke Chun, launching a limited edition of rice that resonated with young consumers [3]. - The partnership with CCTV-3's program "Taste You" helped expand market coverage and reinforced the brand's national identity [5]. Channel Development - October Rice established a comprehensive channel network including e-commerce, supermarkets, and instant retail, enhancing its reach to consumers [6]. - The brand's collaboration with instant retail platforms allowed for a delivery time of 30 minutes, catering to the "non-planned consumption" scenarios [6]. Product Innovation - The company focused on "demand segmentation" by launching differentiated product offerings tailored to specific consumer needs [8]. - New products include a 500g vacuum-packed rice for single-person households and limited edition collaborations with popular culture [8]. - The brand also upgraded corn products into convenient small packages for various leisure scenarios, expanding its market reach [8]. Supply Chain and Long-term Growth - October Rice's long-term growth is attributed to its strong supply chain capabilities and user ecosystem, covering 140 million households in China [9]. - The brand ensures quality and cost advantages through direct sourcing, smart storage, and order-based production [9]. - The company's approach to "from farm to table" enhances its market share in the northeast rice category, creating a sustainable cycle of quality and cost control [9].

家庭食品品牌的破局与创新:十月稻田2025年新米季再塑行业增长新范式
Zhong Guo Zhi Liang Xin Wen Wang· 2025-10-30 07:06
Core Insights - In 2025, October Rice experienced rapid growth, with total revenue reaching 3.064 billion yuan, a year-on-year increase of 16.9%, and adjusted net profit soaring by 97.7% to 294 million yuan, resulting in an adjusted net profit margin increase from 5.7% to 9.6% [1] Group 1: Brand Strategy and Market Positioning - October Rice utilized a dual strategy of "new generation celebrity endorsement + media authority empowerment" to effectively convert "traffic—trust—sales" during the new rice season, addressing the core pain point of "brand voice not landing" in new consumer brands [3] - The brand targeted the "Z generation emotional consumption" demand by appointing popular actor Ke Chun as the "Chunxiang Recommendation Officer," launching a limited edition of Wuchang rice, which significantly enhanced brand recognition among young consumers [3][5] - October Rice reinforced its brand barrier by leveraging media resources, including a dialogue with the president of the China Agricultural Risk Management Research Association, showcasing its innovations in the supply chain and enhancing consumer trust in its "farm-to-table" model [5] Group 2: Channel Development and Product Innovation - The company constructed a comprehensive channel network of "e-commerce + supermarkets + instant retail," achieving breakthroughs in immediate retail and segmented product offerings to meet the trend of "instantaneous and scenario-based" household food consumption [6] - October Rice launched differentiated product matrices focusing on three major scenarios: small vacuum-packed rice for single-person meals, limited edition collaborative products for young consumers, and upgraded corn products for diverse leisure scenarios [8] - The brand's strategy emphasizes capturing the "last mile" of consumer entry through partnerships with instant retail platforms, reducing delivery times to 30 minutes, which aligns with the fresh and emergency consumption attributes of household food [6] Group 3: Supply Chain and Long-term Growth - October Rice ensures quality and cost advantages through "direct sourcing + intelligent warehousing + order-based production," maintaining a stable market share in the Northeast rice category [9] - The brand has conducted traceability for new rice seasons for four consecutive years, ensuring high-quality raw materials from core production areas, and has cumulatively procured over 14 billion yuan of raw grain from 2020 to 2024 [9] - The growth logic of October Rice during the 2025 new rice season represents a breakthrough in "new consumption internal competition," focusing on "precise traffic conversion, channel efficiency enhancement, and deep supply chain integration" rather than relying solely on price or marketing wars [9]
十月稻田筑牢品质根基 守护“中国味”飘香万家餐桌
Huan Qiu Wang· 2025-10-28 10:19
Core Insights - The company, October Rice Field, is leveraging a combination of hard technology and soft power to enhance its brand presence and market share during the 2025 new rice season [1][3][7] - The brand emphasizes the importance of quality rice production through modernized processes and cultural storytelling, aiming to resonate with consumers on an emotional level [3][4][5] Group 1: Brand Strategy - October Rice Field's marketing strategy includes a multi-dimensional approach that integrates technology and cultural elements to strengthen its brand identity as a "national brand" and "family food innovator" [1][7] - The company has engaged popular young actors and utilized social media platforms to connect with younger audiences, enhancing brand visibility and engagement [5][7] Group 2: Production and Quality Control - The company maintains a rigorous quality control process from grain selection to production, ensuring that every grain of rice meets high standards of quality [3][4] - October Rice Field employs automated production lines and a comprehensive quality assurance system to guarantee the integrity of its products [3][4] Group 3: Cultural Integration - The brand has successfully linked traditional cultural elements, such as the 24 solar terms, to its rice products, fostering a deeper connection with consumers [4][5] - October Rice Field's marketing campaigns highlight the cultural significance of rice in Chinese cuisine, enhancing consumer appreciation for its products [5][7] Group 4: Community and Economic Impact - The company promotes agricultural development through standardized planting guidance and an order-based farming model, benefiting local farmers and contributing to rural revitalization [3][7] - October Rice Field's initiatives aim to create a direct supply chain from production to consumers, ensuring quality and supporting local economies [7]
智通港股投资日志|10月23日


智通财经网· 2025-10-22 16:04
Core Viewpoint - The news provides an overview of the upcoming IPOs, earnings announcements, shareholder meetings, and dividend distributions for various companies listed on the Hong Kong Stock Exchange as of October 23, 2025 [1]. New IPO Activities - Companies currently in the IPO process include: - Baima Tea Industry - Cambridge Technology - Sany Heavy Industry - Dipu Technology - Prada - Lijuz Pharmaceutical [1] Earnings Announcement Dates - Companies scheduled to announce earnings include: - Faraday - Ping An Good Doctor - Longyuan Power - Orient Overseas International - Qingdao Port - China Innovation Investment - Chongqing Machinery and Electric [1] Shareholder Meeting Dates - Companies holding shareholder meetings include: - Datang Power - Andeli Juice - Hongye Futures - Tibet Water Resources - China Anshun Energy [1] Dividend Distribution - Companies with upcoming dividend distributions include: - Hang Seng Bank (ex-dividend date) - Huaxun (dividend payment date) - Wansichang International (dividend payment date) - Zhifeng Industrial Electronics (dividend payment date) - Haitian Flavoring and Food (dividend payment date) - China Shipbuilding Defense (dividend payment date) - Dongfang Xingye Holdings (dividend payment date) - China Resources Mixc Life (dividend payment date) [1][3][4]
致丰集团与菲律宾 Bayambang 市达成新能源项目合作意向
Xin Lang Cai Jing· 2025-10-11 05:17
Core Insights - ZhiFeng Industrial Electronics Group has signed a cooperation memorandum with Bayambang City, Philippines, to promote electric motorcycle and battery swapping projects, marking a significant step in the company's global renewable energy strategy [1][3][4] Group 1: Project Details - The cooperation aims to replace approximately 6,000 traditional fuel motorcycles within the first year, with a target of 30,000 units over three years, and an overall goal of 200,000 electric motorcycle replacements in the surrounding areas [3][4] - ZhiFeng has developed various products in the renewable energy sector, including charging stations, electric motorcycles, battery swapping systems, and energy storage products, supported by an intelligent management system for monitoring and remote control [3][4] Group 2: Market Context - The Philippines has prioritized renewable energy and climate change in its policies, implementing zero tariffs on imported electric vehicles and expanding tax incentives for hybrid and electric motorcycles, aiming for a 75% reduction in greenhouse gas emissions by 2030 [4] - Bayambang City, with a population of approximately 3.04 million, is positioned to benefit from the renewable energy project, which is expected to enhance the local renewable energy industry and create more job opportunities [4] Group 3: Strategic Importance - The partnership is seen as a crucial step towards sustainable development in the region, with ZhiFeng's chairman emphasizing the importance of reducing urban carbon emissions and improving air quality through this initiative [5]

十月稻田2025年新米上市,携手柯淳真香出道!
Zhong Guo Zhi Liang Xin Wen Wang· 2025-10-10 07:34
Core Insights - The collaboration between October Rice Field and popular actor Ke Chun aims to redefine the new rice season by combining quality and emotional appeal, targeting the trend of emotional consumption [1][3][10] Group 1: Brand and Market Positioning - October Rice Field has served 140 million Chinese households, establishing a strong presence across e-commerce, supermarkets, and instant retail channels, leading the industry in brand reach [3] - Ke Chun's popularity, highlighted by his record-breaking 2 billion views for the show "Good Girl," aligns with the brand's strategy to connect with younger consumers through relatable content and lifestyle [3][4] - The partnership is not merely a traffic boost but a deep integration of content and consumption scenarios, as both target similar demographics [3][4] Group 2: Quality and Commitment - The collaboration is rooted in a shared commitment to quality, with October Rice Field emphasizing its rigorous sourcing and quality control processes, ensuring fresh rice reaches consumers within 72 hours [5][10] - Ke Chun's dedication to his craft mirrors the brand's meticulous approach to product quality, creating a synergy that transcends commercial interests [5][6] Group 3: Innovation and Consumer Engagement - October Rice Field is innovating in the family food sector by offering a diverse range of products that cater to various consumer needs, including small packaging for single servings and healthy options for fitness enthusiasts [8][10] - The brand's strategy includes emotional engagement through collaborations with games and sponsorships of health-related events, reinforcing its mission to enhance family life [8][10] - The partnership with Ke Chun is a reflection of October Rice Field's broader strategy to elevate brand value through innovation and social responsibility, positioning itself as a leader in the new consumption era [10]

致丰工业电子(01710) - 截至二零二五年九月三十日止月份股份发行人的证券变动月报表
2025-10-06 10:06
FF301 II. 已發行股份及/或庫存股份變動 | 1. 股份分類 | 普通股 | | 股份類別 | 不適用 | | 於香港聯交所上市 (註1) | 是 | | | --- | --- | --- | --- | --- | --- | --- | --- | --- | | 證券代號 (如上市) | 01710 | 說明 | | | | | | | | | | 已發行股份(不包括庫存股份)數目 | | | 庫存股份數目 | | 已發行股份總數 | | | 上月底結存 | | | | 1,000,000,000 | | 0 | | 1,000,000,000 | | 增加 / 減少 (-) | | | | | | | | | | 本月底結存 | | | | 1,000,000,000 | | 0 | | 1,000,000,000 | 股份發行人及根據《上市規則》第十九B章上市的香港預託證券發行人的證券變動月報表 截至月份: 2025年9月30日 狀態: 新提交 致:香港交易及結算所有限公司 公司名稱: 致豐工業電子集團有限公司 呈交日期: 2025年10月6日 I. 法定/註冊股本變動 不適用 FF301 ...
致丰工业电子(01710) - (1)持续关连交易 - 与关先生订立之諮询协议之第二份补充协议;(2...
2025-09-30 11:25
香港交易及結算所有限公司及香港聯合交易所有限公司對本公告之內容概不負責,對其準確性 或完整性亦不發表任何聲明,並明確表示概不會就因本公告全部或任何部分內容而產生或因倚 賴該等內容而引致的任何損失承擔任何責任。 TRIO INDUSTRIAL ELECTRONICS GROUP LIMITED 致豐工業電子集團有限公司 (於香港註冊成立的有限公司) (股份代號:1710) (1)持續關連交易— 與關先生訂立之諮詢協議之第二份補充協議; (2)持續關連交易-與戴先生訂立之諮詢協議之補充協議; 及 (3)修訂年度上限 茲提述(i)本公司日期為二零二四年六月二十八日內容有關(其中包括)與關先生訂 立之諮詢協議之公告;(ii)本公司日期為二零二五年一月二十二日內容有關與關先 生訂立之第一份補充協議之公告;及(iii)本公司日期為二零二五年七月三十一日 內容有關(其中包括)與戴先生訂立之諮詢協議之公告(統稱「該等公告」)。除另有 界定者外,本公告中所用詞彙與該等公告所界定者具有相同涵義。 與關先生訂立之第二份補充協議 於二零二四年六月二十八日,致豐工程(本公司全資附屬公司)與關先生就委聘關 先生為本集團顧問訂立與關先生訂 ...
好食榜上的卓越品质,十月稻田玉米助推健康新食尚
Zhong Guo Zhi Liang Xin Wen Wang· 2025-09-25 03:28
Core Insights - The 2025 "Good Food List" announced by Zhitong Finance recognizes outstanding food brands that adhere to quality, innovation, and industry trends, with October Rice Field being awarded "Annual Corn Brand" for its healthy and tasty corn products [1][2] Industry Overview - Driven by sustained consumer vitality, China's food ingredient market is projected to reach 10.56 trillion yuan in 2024, marking a 12.7% year-on-year growth, indicating a new development phase for the food industry [2] - There is a growing awareness of healthy eating, shifting consumer focus from "eating enough" to "eating well" and "eating healthily," leading to a rapid development of whole grain foods, with corn being favored for its natural health properties [2] Company Performance - October Rice Field's corn category revenue reached 433 million yuan, becoming the second-largest core category, supported by its recognition as the leading corn brand in China for two consecutive years by Frost & Sullivan [2][7] - The company has established three corn industry bases in Liaoning, Heilongjiang, and Guangxi, ensuring a stable supply of high-quality corn products through a comprehensive supply chain [7] Product Innovation - October Rice Field has successfully diversified its corn product offerings, including instant corn segments and fruit corn kernels, expanding into the snack food and single-serving market [9] - The company has effectively engaged with younger consumers by promoting corn as a new social symbol, capitalizing on trends like "weight management" due to corn's dietary fiber and low-calorie content [10] Marketing Strategies - During the 2025 new corn launch, October Rice Field targeted high-potential offline scenarios and collaborated with the game "Cat and Soup," reaching 70 million young players with four co-branded products [11] - The brand has utilized content marketing, e-commerce visual upgrades, and live interactions to create an immersive experience for young consumers, reinforcing its image as a "corn expert" and enhancing its industry influence [13]
