CNOOC EnerTech(600968)
Search documents
海油发展:第三季度归母净利润10.23亿元,同比下降4.51%
Xin Lang Cai Jing· 2025-10-21 09:53
海油发展10月21日公告,2025年第三季度实现营业收入113.5亿元,同比下降5.75%;归属于上市公司股 东的净利润10.23亿元,同比下降4.51%;基本每股收益0.1007元。前三季度实现营业收入339.47亿元, 同比增长0.81%;归属于上市公司股东的净利润28.53亿元,同比增长6.11%;基本每股收益0.2806元。 ...
海油发展(600968.SH)发布前三季度业绩,归母净利润28.53亿元,同比增长6.11%
智通财经网· 2025-10-21 09:48
Core Insights - The company reported a revenue of 33.947 billion yuan for the first three quarters of 2025, representing a year-on-year growth of 0.81% [1] - The net profit attributable to shareholders reached 2.853 billion yuan, showing a year-on-year increase of 6.11% [1] - The non-recurring net profit was 2.86 billion yuan, reflecting a year-on-year growth of 14.54% [1] - The basic earnings per share stood at 0.2806 yuan [1]
海油发展(600968) - 2025年第三季度授信担保情况的公告
2025-10-21 09:45
中海油能源发展股份有限公司 2025 年第三季度授信担保情况的公告 本公司董事会及全体董事保证本公告内容不存在任何虚假记载、误导性陈述 或者重大遗漏,并对其内容的真实性、准确性和完整性承担法律责任。 重要内容提示: 担保对象及基本情况 证券代码:600968 证券简称:海油发展 公告编号:2025-026 | | | 被担保人名称 | | 渤海石油航务建筑工程有限责任公司 | | --- | --- | --- | --- | --- | | | 对 | 本次担保金额 | 189.29 万元 | | | 担 保 | | 实际为其提供的担保余额 | 1,091.11 万元 | | | 象一 | | | | | | | | 是否在前期预计额度内 | 是 □否 | □不适用:_________ | | | | 本次担保是否有反担保 | □是 否 | □不适用:_________ | | | | 被担保人名称 | | 海油发展珠海管道工程有限公司 | | | | 本次担保金额 | 812.62 万元 | | | 担 保 象二 | 对 | 实际为其提供的担保余额 | 2,688.44 万元 | | | | | 是否 ...
海油发展(600968) - 2025 Q3 - 季度财报
2025-10-21 09:40
Financial Performance - The company's operating revenue for the third quarter was ¥11,350,051,987.82, a decrease of 5.75% compared to the same period last year[4] - The total profit for the quarter was ¥1,318,325,809.10, down by 1.66% year-on-year[4] - The net profit attributable to shareholders was ¥1,023,327,437.43, reflecting a decline of 4.51% compared to the previous year[4] - The net profit after deducting non-recurring gains and losses was ¥1,026,600,720.60, an increase of 5.52% year-on-year[4] - The basic earnings per share for the quarter was ¥0.1007, a decrease of 4.51% compared to the same period last year[5] - Total operating revenue for the first three quarters of 2025 reached CNY 33,946,574,198.80, a slight increase from CNY 33,674,122,916.23 in the same period of 2024, representing a growth of approximately 0.81%[20] - Operating profit for the first three quarters of 2025 was CNY 3,749,985,648.91, compared to CNY 3,348,249,578.54 in 2024, reflecting an increase of approximately 11.99%[21] - Net profit for the first three quarters of 2025 was CNY 2,924,557,824.49, up from CNY 2,772,896,486.08 in 2024, marking a growth of around 5.47%[21] - The net profit attributable to the parent company for the current period is approximately CNY 2.85 billion, an increase from CNY 2.69 billion in the previous period, representing a growth of about 6.1%[22] - The total comprehensive income for the current period is approximately CNY 2.87 billion, compared to CNY 2.72 billion in the previous period, reflecting an increase of around 5.4%[22] - The basic and diluted earnings per share for the current period are CNY 0.2806, up from CNY 0.2645 in the previous period, indicating a growth of approximately 6.1%[22] Cash Flow and Liquidity - The cash flow from operating activities for the year-to-date was ¥331,062,495.45, showing a significant decrease of 80.03%[5] - Cash flow from operating activities for the first three quarters of 2025 is CNY 331.06 million, a decrease from CNY 1.66 billion in the same period of 2024[25] - Cash flow from investing activities shows a net inflow of approximately CNY 1.13 billion, a significant improvement compared to a net outflow of CNY 3.04 billion in the previous year[26] - Cash flow from financing activities resulted in a net outflow of approximately CNY 1.69 billion, compared to a net outflow of CNY 1.31 billion in the previous period[26] - The total cash and cash equivalents at the end of the period is approximately CNY 4.32 billion, down from CNY 2.91 billion at the end of the previous period[26] - The company received cash from sales of goods and services amounting to approximately CNY 37.65 billion, an increase from CNY 36.71 billion in the previous year[25] - The company paid approximately CNY 31.21 billion for goods and services, compared to CNY 29.40 billion in the previous period, reflecting an increase of about 6.2%[25] Assets and Liabilities - The total assets at the end of the reporting period were ¥48,255,095,317.49, a decrease of 2.52% from the end of the previous year[5] - The total current assets decreased to ¥25,865,067,007.86 from ¥27,192,388,841.38 year-over-year[15] - The company's inventory increased to ¥1,599,654,572.74 from ¥1,014,116,837.23 year-over-year[15] - The total accounts receivable is reported at ¥10,198,317,492.98, a decrease from ¥10,904,749,326.49[15] - The company has a long-term equity investment of ¥4,361,164,025.17, slightly up from ¥4,307,095,673.73[15] - The total debt investment is reported at ¥1,082,383,561.65, compared to ¥1,059,197,260.28 previously[15] - Total liabilities decreased to CNY 18,962,398,920.54 from CNY 21,638,889,318.28, a reduction of about 12.35%[17] - Non-current liabilities totaled CNY 3,897,274,107.67, up from CNY 3,481,819,597.55, indicating an increase of approximately 11.93%[17] - The company's equity increased to CNY 29,292,696,396.95 from CNY 27,863,643,704.28, representing a growth of approximately 5.11%[17] Shareholder Information - The total number of common shareholders at the end of the reporting period is 73,955[12] - China National Offshore Oil Corporation holds 8,300,000,000 shares, representing 81.65% of total shares[13] - The company has no significant changes in the top 10 shareholders or their participation in margin trading[14] Operational Insights - Non-recurring gains and losses for the quarter totaled -¥3,273,283.17, with significant impacts from asset repair expenses due to typhoon damage[8] - The company reported a year-to-date cash inflow from sales and services of ¥7.85 billion, while cash outflows increased by ¥21.13 billion primarily due to purchases and labor payments[10] - There are no other significant reminders regarding the company's operational situation during the reporting period[14] - Research and development expenses increased to CNY 707,458,436.17 from CNY 648,557,631.07, showing a rise of approximately 9.93%[21] - The company's cash and cash equivalents amount to ¥6,587,725,320.38 as of September 30, 2025, down from ¥6,665,817,800.98 at the end of 2024[15]
海油发展:第三季度净利润10.23亿元,同比下降4.51%
Xin Lang Cai Jing· 2025-10-21 09:36
海油发展公告,第三季度营收为113.5亿元,同比下降5.75%;净利润为10.23亿元,同比下降4.51%。前 三季度营收为339.47亿元,同比增长0.81%;净利润为28.53亿元,同比增长6.11%。 ...
油服工程板块10月17日跌0.96%,仁智股份领跌,主力资金净流入1.23亿元
Zheng Xing Xing Ye Ri Bao· 2025-10-17 08:37
Core Insights - The oil service engineering sector experienced a decline of 0.96% on October 17, with RenZhi Co. leading the drop [1] - The Shanghai Composite Index closed at 3839.76, down 1.95%, while the Shenzhen Component Index closed at 12688.94, down 3.04% [1] Stock Performance - Top gainers in the oil service engineering sector included: - Tongyuan Petroleum (300164) with a closing price of 5.99, up 5.46% [1] - Zhunyou Co. (002207) at 8.42, up 4.34% [1] - Beiken Energy (002828) at 10.75, up 3.46% [1] - Notable decliners included: - RenZhi Co. (002629) at 7.95, down 1.85% [2] - Haijun Engineering (600583) at 5.39, down 1.46% [2] - Shipgen Aori (601808) at 13.63, down 1.45% [2] Capital Flow - The oil service engineering sector saw a net inflow of 123 million yuan from institutional investors, while retail investors experienced a net outflow of 182 million yuan [2][3] - Key stocks with significant capital flow included: - Tongyuan Petroleum with a net inflow of 1.16 billion yuan from institutional investors [3] - Zhunyou Co. with a net inflow of 37.83 million yuan [3] - Beiken Energy with a net inflow of 19.94 million yuan [3]


油服工程板块10月16日跌0.45%,仁智股份领跌,主力资金净流出2.17亿元
Zheng Xing Xing Ye Ri Bao· 2025-10-16 08:27
Core Viewpoint - The oil service engineering sector experienced a decline of 0.45% on October 16, with Renji Co. leading the drop. The Shanghai Composite Index rose by 0.1% to close at 3916.23, while the Shenzhen Component Index fell by 0.25% to 13086.41 [1]. Group 1: Market Performance - The oil service engineering sector's individual stock performance showed mixed results, with notable declines in several companies, including Renji Co. which fell by 4.71% to a closing price of 8.10 [2]. - The trading volume for Renji Co. was 355,300 shares, with a transaction value of 292 million yuan [2]. - Other companies in the sector, such as Beiken Energy and Zhun Oil Co., also saw declines of 2.17% and 2.06%, respectively [2]. Group 2: Capital Flow - The oil service engineering sector experienced a net outflow of 217 million yuan from major funds, while retail investors contributed a net inflow of 190 million yuan [2]. - The table of capital flow indicates that major funds withdrew from several companies, including Zhun Oil Co. and Beiken Energy, with net outflows of 15.6 million yuan and 19.9 million yuan, respectively [3]. - Conversely, retail investors showed a positive net inflow for Zhun Oil Co. and Beiken Energy, with inflows of 25.9 million yuan and 17.3 million yuan, respectively [3].

油服工程板块10月15日涨0.16%,惠博普领涨,主力资金净流出8986.11万元
Zheng Xing Xing Ye Ri Bao· 2025-10-15 08:33
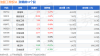
Core Insights - The oil service engineering sector experienced a slight increase of 0.16% on October 15, with Huibo Po leading the gains [1] - The Shanghai Composite Index closed at 3912.21, up 1.22%, while the Shenzhen Component Index closed at 13118.75, up 1.73% [1] Stock Performance - Huibo Po (002554) closed at 3.15, up 2.27% with a trading volume of 422,500 shares and a transaction value of 132 million yuan [1] - Qianeng Hengxin (300191) closed at 20.06, up 1.42% with a trading volume of 70,300 shares and a transaction value of 141 million yuan [1] - Other notable stocks include: - Zhimusi (600583) at 5.46, up 0.92% [1] - PetroChina Engineering (600339) at 3.62, unchanged [1] - Beiken Energy (002828) at 10.62, down 0.38% [2] Capital Flow - The oil service engineering sector saw a net outflow of 89.86 million yuan from institutional investors, while retail investors contributed a net inflow of 59.03 million yuan [2] - Notable capital flows include: - Haiyou Development (600968) with a net inflow of 7.68 million yuan from institutional investors [3] - Huibo Po (002554) with a net outflow of 2.64 million yuan from institutional investors [3] - Beiken Energy (002828) with a net outflow of 4.42 million yuan from institutional investors [3]
油服工程板块10月14日涨0.67%,仁智股份领涨,主力资金净流入8077.16万元
Zheng Xing Xing Ye Ri Bao· 2025-10-14 08:46
Core Viewpoint - The oil service engineering sector experienced a slight increase of 0.67% on October 14, with Renji Co., Ltd. leading the gains, while the overall market indices saw declines [1]. Market Performance - The Shanghai Composite Index closed at 3865.23, down 0.62% - The Shenzhen Component Index closed at 12895.11, down 2.54% [1]. Individual Stock Performance - Renji Co., Ltd. (002629) closed at 8.48, up 9.99% with a trading volume of 249,700 shares and a turnover of 201 million yuan - Zhongman Petroleum (603619) closed at 20.19, up 4.77% with a trading volume of 267,000 shares and a turnover of 536 million yuan - Other notable performers include Tongyuan Petroleum (300164) up 2.81%, Beiken Energy (002828) up 2.21%, and Zhun Oil Co. (002207) up 2.20% [1]. Capital Flow Analysis - The oil service engineering sector saw a net inflow of 80.77 million yuan from institutional investors, while retail investors contributed a net inflow of 48.83 million yuan - However, there was a net outflow of 130 million yuan from speculative funds [2]. Detailed Capital Flow for Key Stocks - Renji Co., Ltd. had a net inflow of 57.91 million yuan from institutional investors, but a net outflow of 21.63 million yuan from speculative funds - Tongyuan Petroleum saw a net inflow of 33.00 million yuan from institutional investors, while Zhun Oil Co. had a net inflow of 14.04 million yuan [3].

2025年中国LNG油改气行业政策、产业链全景、发展现状及未来发展趋势研判:重卡主导需求韧性凸显,细分市场潜力持续释放[图]
Chan Ye Xin Xi Wang· 2025-10-14 00:37
Core Viewpoint - LNG oil-to-gas conversion is a significant direction for clean energy transition, utilizing the low-temperature liquid characteristics of LNG for efficient storage and transportation, while significantly reducing pollutant emissions and fuel costs [1][2] Industry Overview - LNG oil-to-gas conversion refers to the process of retrofitting traditional fuel-driven vehicles to use liquefied natural gas (LNG) as the primary fuel, leveraging LNG's low-temperature liquid properties for efficient storage and combustion [2][3] - Compared to traditional fuels, LNG combustion results in a significant reduction in emissions, with nitrogen oxides reduced by 85% and particulate matter by 95%, while fuel costs can decrease by 30%-55% [2] Policy Analysis - China has implemented multiple top-level policies, such as the "2030 Carbon Peak Action Plan," to support the LNG oil-to-gas industry, focusing on energy structure optimization and infrastructure improvement [5][6] - Local policies, like the LNG refueling station layout plan in Hunan Province, aim to address refueling bottlenecks and enhance user confidence in LNG vehicles [5] Industry Chain - The LNG oil-to-gas industry chain consists of upstream gas source development, midstream storage and transportation infrastructure, and downstream application expansion [6] - Upstream includes natural gas extraction and importation, while midstream focuses on vehicle retrofitting and LNG refueling infrastructure [6] Current Development Status - China's energy structure shows a "rich coal, poor oil, and scarce gas" characteristic, leading to a growing supply-demand gap for natural gas [7] - LNG demand has rapidly increased due to policies promoting "coal-to-gas" and "oil-to-gas" transitions, with LNG's superior peak-shaving capabilities making it a key transitional energy source [7][8] Market Performance - The LNG oil-to-gas market is projected to grow significantly, with an estimated market size of approximately 760 billion yuan in 2024, expected to reach around 900 billion yuan by 2025 [9] - The number of LNG refueling stations is anticipated to exceed 7,000 by 2025, enhancing the refueling network across the country [8][9] Future Trends - The industry is expected to evolve towards three main trends: intelligent upgrades across the entire chain, low-carbon and hydrogen energy integration, and regional market differentiation alongside global resource integration [10][11][12] - Intelligent upgrades will enhance efficiency and safety through advanced technologies like IoT and AI, while low-carbon initiatives will focus on integrating LNG with renewable energy sources [10][11] - The market will see a differentiated layout domestically, with high-density LNG refueling networks in key regions, and internationally, Chinese companies will expand their global LNG resource footprint [12]
