毛利率
Search documents
浙农股份(002758.SZ):2025年三季报净利润为2.18亿元
Xin Lang Cai Jing· 2025-10-28 02:18
Core Insights - Zhejiang Agricultural Co., Ltd. (002758.SZ) reported a total operating revenue of 33.084 billion yuan for Q3 2025, with a net profit attributable to shareholders of 218 million yuan and a net cash inflow from operating activities of 1.526 billion yuan [1]. Financial Performance - The company's latest asset-liability ratio stands at 63.89%, ranking 7th among disclosed peers, which is an increase of 2.56 percentage points compared to the same period last year [3]. - The latest gross profit margin is 5.39%, placing the company 9th among peers. The return on equity (ROE) is 4.54% [4]. - The diluted earnings per share (EPS) is 0.17 yuan, a decrease of 0.14 yuan compared to the same reporting period last year, reflecting a year-on-year decline of 45.16% [4]. - The total asset turnover ratio is 1.68 times, and the inventory turnover ratio is 5.34 times [4]. Shareholder Structure - The number of shareholders is 26,200, with the top ten shareholders holding a total of 296 million shares, accounting for 56.71% of the total share capital. The top shareholders are as follows: - Zhejiang Agricultural Holdings Group Co., Ltd. - 19.5% - Zhejiang Xinghe Group Co., Ltd. - 11.1% - Zhejiang Shaoxing Huayuan Trading Group Co., Ltd. - 10.5% - Zhejiang Taian Tai Investment Consulting Partnership (Limited Partnership) - 5.97% - Qian Mushui - 2.18% - Hong Kong Central Clearing Limited - 2.08% - Wang Leping - 1.99% - Zhejiang Xinghe Venture Capital Co., Ltd. - 1.41% - Zhu Guoliang - 1.02% - Shen Jianchao - 0.81% [4].


浙江世宝(002703.SZ):2025年三季报净利润为1.50亿元
Xin Lang Cai Jing· 2025-10-28 02:17
Core Insights - Zhejiang Shibao (002703.SZ) reported a total operating revenue of 2.462 billion yuan for Q3 2025, with a net profit attributable to shareholders of 150 million yuan and a net cash inflow from operating activities of 192 million yuan [1]. Financial Performance - The company's latest debt-to-asset ratio stands at 43.71%, which is an increase of 1.73 percentage points from the previous quarter and an increase of 7.89 percentage points year-on-year [3]. - The latest gross profit margin is 17.78%, reflecting a decrease of 0.23 percentage points from the previous quarter and a decrease of 1.92 percentage points compared to the same period last year [3]. - The return on equity (ROE) is reported at 7.32% [3]. - The diluted earnings per share (EPS) is 0.07 yuan, which is a decrease of 0.07 yuan year-on-year, representing a decline of 50.07% compared to the same reporting period last year [3]. - The total asset turnover ratio is 0.71 times, and the inventory turnover ratio is 3.93 times [3]. Shareholder Structure - The number of shareholders is 66,600, with the top ten shareholders holding a total of 531 million shares, accounting for 64.56% of the total share capital [3]. - The largest shareholder is Zhejiang Shibao Holding Group Co., Ltd., holding 33.3% of the shares [3].

大全能源(688303.SH):2025年三季报净利润为-10.73亿元
Xin Lang Cai Jing· 2025-10-28 02:15
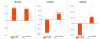
Core Insights - Daqo New Energy (688303.SH) reported a significant decline in revenue and net profit for Q3 2025, with total revenue at 3.243 billion yuan, down 46.00% year-on-year [1] - The company recorded a net profit attributable to shareholders of -1.073 billion yuan, indicating ongoing financial challenges [1] Financial Performance - Total revenue for Q3 2025 was 3.243 billion yuan, a decrease of 2.762 billion yuan compared to the same period last year [1] - Operating cash flow was negative at -1.552 billion yuan, reflecting cash management issues [1] - The latest debt-to-asset ratio stands at 8.20%, an increase of 0.15 percentage points from the previous quarter [3] - Gross margin is reported at -7.59%, down 11.77 percentage points year-on-year [3] - Return on equity (ROE) is -2.75%, a decrease of 0.12 percentage points compared to the same period last year [3] - Diluted earnings per share (EPS) is -0.50 yuan [3] Efficiency Metrics - Total asset turnover ratio is 0.07 times, down 39.27% year-on-year, indicating reduced efficiency in asset utilization [3] - Inventory turnover ratio is 3.14 times, a decline of 21.10% compared to the same period last year [3] Shareholder Structure - The number of shareholders is 40,000, with the top ten shareholders holding 1.716 billion shares, accounting for 79.99% of total equity [3] - The largest shareholder is Dago New Energy Corp., holding 71.40% of shares [3]

龙建股份(600853.SH):2025年三季报净利润为2.57亿元、同比较去年同期上涨9.51%
Xin Lang Cai Jing· 2025-10-28 02:15
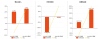
Core Insights - Longjian Co., Ltd. (600853.SH) reported a total operating revenue of 10.771 billion yuan for Q3 2025, with a net profit attributable to shareholders of 257 million yuan, marking an increase of 22.3 million yuan compared to the same period last year, achieving a 5-year consecutive growth and a year-on-year increase of 9.51% [1] Financial Performance - The company's latest cash flow from operating activities was -1.369 billion yuan [1] - The asset-liability ratio stands at 81.38%, a decrease of 1.21 percentage points from the same period last year [3] - The gross profit margin is reported at 13.37%, an increase of 0.15 percentage points year-on-year, achieving a 3-year consecutive growth [3] - The return on equity (ROE) is 6.57% [3] - The diluted earnings per share (EPS) is 0.25 yuan, an increase of 0.02 yuan compared to the same period last year, achieving a 4-year consecutive growth and a year-on-year increase of 8.70% [3] - The total asset turnover ratio is 0.29 times, and the inventory turnover ratio is 6.22 times [3] Shareholder Structure - The number of shareholders is 65,300, with the top ten shareholders holding a total of 481 million shares, accounting for 47.41% of the total share capital [3] - The largest shareholder is Heilongjiang Construction Investment Group Co., Ltd. with 440 million shares [3]

楚天科技(300358.SZ):2025年三季报净利润为8446.35万元
Xin Lang Cai Jing· 2025-10-28 02:13
Financial Performance - The company reported total revenue of 3.896 billion yuan, a decrease of 275 million yuan compared to the same period last year, representing a year-on-year decline of 6.60% [1] - The net profit attributable to shareholders was 84.4635 million yuan, with net cash inflow from operating activities amounting to 148 million yuan [1] Financial Ratios - The latest debt-to-asset ratio stands at 65.79%, an increase of 0.22 percentage points compared to the same period last year [3] - The latest gross profit margin is 31.17%, and the return on equity (ROE) is 1.88% [3] Earnings and Efficiency Metrics - The diluted earnings per share are 0.14 yuan [4] - The total asset turnover ratio is 0.29 times, a decrease of 0.04 times compared to the same period last year, reflecting an 11.09% year-on-year decline [4] - The inventory turnover ratio is 0.78 times, down by 0.10 times compared to the same period last year, indicating an 11.80% year-on-year decline [4] Shareholder Structure - The number of shareholders is 28,900, with the top ten shareholders holding a total of 264 million shares, accounting for 44.74% of the total share capital [4] - The largest shareholder is Changsha Chutian Investment Group Co., Ltd., holding 38.07% of the shares [4]
奥海科技(002993.SZ):2025年三季报净利润为3.59亿元
Xin Lang Cai Jing· 2025-10-28 02:06
Core Insights - The company reported a total revenue of 5.188 billion yuan for Q3 2025, with a net profit attributable to shareholders of 359 million yuan and a net cash inflow from operating activities of 627 million yuan [1]. Financial Performance - The latest asset-liability ratio stands at 45.54%, which is an increase of 2.05 percentage points from the previous quarter and an increase of 4.06 percentage points year-on-year [3]. - The company's gross profit margin is reported at 20.01%, with a return on equity (ROE) of 7.25% [3]. - The diluted earnings per share (EPS) is 1.30 yuan [3]. - The total asset turnover ratio is 0.57 times, while the inventory turnover ratio is 4.93 times [3]. Shareholder Structure - The number of shareholders is 24,300, with the top ten shareholders holding a total of 193 million shares, accounting for 69.90% of the total share capital [3]. - The largest shareholder is Shenzhen Aohai Technology Co., Ltd., holding 39.6% of the shares [3].

莱尔科技(688683.SH):2025年三季报净利润为3082.19万元
Xin Lang Cai Jing· 2025-10-28 01:33
Core Insights - The company reported a total revenue of 651 million yuan for Q3 2025, with a net profit attributable to shareholders of 30.82 million yuan and a net cash inflow from operating activities of 53.02 million yuan [1]. Financial Performance - The latest debt-to-asset ratio is 36.41%, which has increased by 6.99 percentage points from the previous quarter and by 16.17 percentage points year-on-year [3]. - The latest gross profit margin stands at 18.62%, reflecting a decrease of 0.20 percentage points from the previous quarter and a decline of 5.13 percentage points compared to the same period last year [3]. - The return on equity (ROE) is reported at 3.01% [3]. - The diluted earnings per share (EPS) is 0.20 yuan [3]. - The total asset turnover ratio is 0.40 times, while the inventory turnover ratio is 6.51 times [3]. Shareholder Structure - The number of shareholders is 3,745, with the top ten shareholders holding a total of 106 million shares, accounting for 68.29% of the total share capital [3]. - The top shareholders include: 1. Guangdong Tenair Investment Co., Ltd. - 46.5% 2. Fan Xiaoping - 8.75% 3. Guangdong Shiyun Circuit Technology Co., Ltd. - 5.00% 4. Yakuji - 2.45% 5. Shanghai Ruitin Asset Management Co., Ltd. - 1.27% 6. Guangdong Lair New Materials Technology Co., Ltd. - 0.97% 7. Shi Yonghua - 0.89% 8. Guo Ying - 0.84% 9. Liu Xueheng - 0.79% 10. Shanghai Ruitin Asset Management Co., Ltd. - 0.77% [3].

艾隆科技(688329.SH):2025年三季报净利润为-95.89万元
Xin Lang Cai Jing· 2025-10-28 01:33
Core Insights - The company reported a total revenue of 280 million yuan for Q3 2025, with a net profit attributable to shareholders of -959,000 yuan, indicating a loss [1] - The operating cash flow showed a net inflow of 52.01 million yuan, suggesting some liquidity despite the net loss [1] Financial Metrics - The latest debt-to-asset ratio stands at 42.74%, which is an increase of 0.20 percentage points from the previous quarter and 0.13 percentage points from the same period last year [3] - The gross profit margin is reported at 45.79%, reflecting a decrease of 0.21 percentage points compared to the same period last year [3] - The return on equity (ROE) is at -0.12%, indicating negative returns for shareholders [3] - The diluted earnings per share (EPS) is -0.01 yuan, further highlighting the company's financial struggles [3] - The total asset turnover ratio is 0.20 times, while the inventory turnover ratio is 1.62 times, providing insights into operational efficiency [3] Shareholder Information - The number of shareholders is 5,144, with the top ten shareholders holding a total of 38.28 million shares, accounting for 49.58% of the total share capital [3] - The top shareholders include Zhang Yinhua with 28.5 million shares and Xu Li with 10.8 million shares, among others [3]
联德股份(605060.SH):2025年三季报净利润为1.78亿元
Xin Lang Cai Jing· 2025-10-28 01:29
Core Insights - Company reported a total revenue of 930 million yuan for Q3 2025, with a net profit attributable to shareholders of 178 million yuan and a net cash inflow from operating activities of 220 million yuan [1]. Financial Performance - The latest debt-to-asset ratio stands at 20.40%, an increase of 2.10 percentage points from the previous quarter and up 2.95 percentage points year-on-year [3]. - The latest gross profit margin is 37.18%, and the return on equity (ROE) is 7.35% [3]. - The diluted earnings per share (EPS) is 0.29 yuan, a decrease of 0.32 yuan compared to the same period last year, representing a year-on-year decline of 52.46% [3]. - The total asset turnover ratio is 0.32 times, while the inventory turnover ratio is 2.47 times, down 0.04 times from the same period last year, reflecting a year-on-year decline of 1.58% [3]. Shareholder Structure - The number of shareholders is 9,667, with the top ten shareholders holding a total of 175 million shares, accounting for 72.69% of the total share capital [3]. - The largest shareholder is Hangzhou Liande Holdings Co., Ltd., holding 33.6% of the shares, followed by Allied Machinery International Limited with 27.51% [3].

迈得医疗(688310.SH):2025年三季报净利润为883.67万元
Sou Hu Cai Jing· 2025-10-27 23:15
Core Insights - The company reported a total revenue of 225 million yuan for Q3 2025, with a net profit attributable to shareholders of 8.84 million yuan and a net cash inflow from operating activities of 126 million yuan [1]. Financial Performance - The latest debt-to-asset ratio stands at 29.86%, which is an increase of 1.49 percentage points from the previous quarter and an increase of 13.62 percentage points compared to the same period last year [3]. - The company's gross profit margin is 40.19%, reflecting a decrease of 6.70 percentage points from the same period last year [3]. - The return on equity (ROE) is reported at 1.10% [3]. - The diluted earnings per share (EPS) is 0.05 yuan [3]. - The total asset turnover ratio is 0.20 times, while the inventory turnover ratio is 0.80 times [3]. Shareholder Structure - The number of shareholders is 4,528, with the top ten shareholders holding a total of 120 million shares, accounting for 72.36% of the total share capital [3]. - The largest shareholder is Lin Junhua, holding 47.1 million shares [3]. - Other notable shareholders include Chen Wanshun with 14.8 million shares and Taizhou Saina Investment Consulting Partnership with 3.45 million shares [3].
