每股收益
Search documents
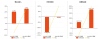
大全能源(688303.SH):2025年三季报净利润为-10.73亿元
Xin Lang Cai Jing· 2025-10-28 02:15
Core Insights - Daqo New Energy (688303.SH) reported a significant decline in revenue and net profit for Q3 2025, with total revenue at 3.243 billion yuan, down 46.00% year-on-year [1] - The company recorded a net profit attributable to shareholders of -1.073 billion yuan, indicating ongoing financial challenges [1] Financial Performance - Total revenue for Q3 2025 was 3.243 billion yuan, a decrease of 2.762 billion yuan compared to the same period last year [1] - Operating cash flow was negative at -1.552 billion yuan, reflecting cash management issues [1] - The latest debt-to-asset ratio stands at 8.20%, an increase of 0.15 percentage points from the previous quarter [3] - Gross margin is reported at -7.59%, down 11.77 percentage points year-on-year [3] - Return on equity (ROE) is -2.75%, a decrease of 0.12 percentage points compared to the same period last year [3] - Diluted earnings per share (EPS) is -0.50 yuan [3] Efficiency Metrics - Total asset turnover ratio is 0.07 times, down 39.27% year-on-year, indicating reduced efficiency in asset utilization [3] - Inventory turnover ratio is 3.14 times, a decline of 21.10% compared to the same period last year [3] Shareholder Structure - The number of shareholders is 40,000, with the top ten shareholders holding 1.716 billion shares, accounting for 79.99% of total equity [3] - The largest shareholder is Dago New Energy Corp., holding 71.40% of shares [3]


艾隆科技(688329.SH):2025年三季报净利润为-95.89万元
Xin Lang Cai Jing· 2025-10-28 01:33
Core Insights - The company reported a total revenue of 280 million yuan for Q3 2025, with a net profit attributable to shareholders of -959,000 yuan, indicating a loss [1] - The operating cash flow showed a net inflow of 52.01 million yuan, suggesting some liquidity despite the net loss [1] Financial Metrics - The latest debt-to-asset ratio stands at 42.74%, which is an increase of 0.20 percentage points from the previous quarter and 0.13 percentage points from the same period last year [3] - The gross profit margin is reported at 45.79%, reflecting a decrease of 0.21 percentage points compared to the same period last year [3] - The return on equity (ROE) is at -0.12%, indicating negative returns for shareholders [3] - The diluted earnings per share (EPS) is -0.01 yuan, further highlighting the company's financial struggles [3] - The total asset turnover ratio is 0.20 times, while the inventory turnover ratio is 1.62 times, providing insights into operational efficiency [3] Shareholder Information - The number of shareholders is 5,144, with the top ten shareholders holding a total of 38.28 million shares, accounting for 49.58% of the total share capital [3] - The top shareholders include Zhang Yinhua with 28.5 million shares and Xu Li with 10.8 million shares, among others [3]
联德股份(605060.SH):2025年三季报净利润为1.78亿元
Xin Lang Cai Jing· 2025-10-28 01:29
Core Insights - Company reported a total revenue of 930 million yuan for Q3 2025, with a net profit attributable to shareholders of 178 million yuan and a net cash inflow from operating activities of 220 million yuan [1]. Financial Performance - The latest debt-to-asset ratio stands at 20.40%, an increase of 2.10 percentage points from the previous quarter and up 2.95 percentage points year-on-year [3]. - The latest gross profit margin is 37.18%, and the return on equity (ROE) is 7.35% [3]. - The diluted earnings per share (EPS) is 0.29 yuan, a decrease of 0.32 yuan compared to the same period last year, representing a year-on-year decline of 52.46% [3]. - The total asset turnover ratio is 0.32 times, while the inventory turnover ratio is 2.47 times, down 0.04 times from the same period last year, reflecting a year-on-year decline of 1.58% [3]. Shareholder Structure - The number of shareholders is 9,667, with the top ten shareholders holding a total of 175 million shares, accounting for 72.69% of the total share capital [3]. - The largest shareholder is Hangzhou Liande Holdings Co., Ltd., holding 33.6% of the shares, followed by Allied Machinery International Limited with 27.51% [3].

Principal Financial (PFG) Reports Q3 Earnings: What Key Metrics Have to Say
ZACKS· 2025-10-28 00:31
Core Insights - Principal Financial (PFG) reported revenue of $3.9 billion for the quarter ended September 2025, reflecting a year-over-year increase of 6.2% but falling short of the Zacks Consensus Estimate by 4.15% [1] - Earnings per share (EPS) for the quarter was $2.10, an increase from $1.76 in the same quarter last year, but also below the consensus estimate of $2.18, resulting in an EPS surprise of -3.67% [1] Financial Performance Metrics - Assets under management (AUM) for International Pension reached $150.70 billion, exceeding the average estimate of $143.58 billion [4] - AUM for Investment Management was reported at $601.60 billion, slightly below the average estimate of $604.19 billion [4] - Net investment income revenue was $1.2 billion, compared to the average estimate of $1.26 billion, marking a year-over-year increase of 2.8% [4] - Revenue from premiums and other considerations was $1.53 billion, below the average estimate of $1.74 billion, with a year-over-year change of +8.5% [4] - Fees and other revenues generated $1.13 billion, slightly below the average estimate of $1.14 billion, reflecting a year-over-year increase of 3.5% [4] Segment Performance - In the Principal Asset Management Segment, net investment income was $179.5 million, below the estimate of $188.31 million, representing a year-over-year decline of 13.5% [4] - In the Benefits and Protection Segment, Specialty Benefits fees and other revenues were $8.4 million, below the average estimate of $8.85 million, with a year-over-year change of +2.4% [4] - Specialty Benefits premiums and other considerations totaled $836.8 million, below the average estimate of $850 million, reflecting a year-over-year increase of 3.2% [4] - Life Insurance fees and other revenues were reported at $112.8 million, below the average estimate of $129.74 million, with a year-over-year change of +2.9% [4] - Life Insurance premiums and other considerations reached $136.1 million, exceeding the average estimate of $127.22 million, marking a year-over-year increase of 3.5% [4]
三川智慧(300066.SZ):2025年三季报净利润为1.44亿元
Xin Lang Cai Jing· 2025-10-25 02:28
Core Insights - The company reported a total revenue of 828 million yuan for Q3 2025, a decrease of 284 million yuan compared to the same period last year, representing a year-on-year decline of 25.53% [1] - The net profit attributable to shareholders was 144 million yuan, with a net cash inflow from operating activities of -80.99 million yuan, a decrease of 81.72 million yuan compared to the same period last year, reflecting a year-on-year decline of 1.12 billion yuan [1] Financial Performance - The latest asset-liability ratio stands at 15.75%, an increase of 0.38 percentage points compared to the same period last year [3] - The latest gross profit margin is 25.29%, down 1.65 percentage points from the previous quarter, with a return on equity (ROE) of 5.50% [4] - The diluted earnings per share are 0.14 yuan [5] - The total asset turnover ratio is 0.27 times, a decrease of 0.08 times compared to the same period last year, reflecting a year-on-year decline of 23.23% [5] - The inventory turnover ratio is 1.74 times, down 0.49 times compared to the same period last year, indicating a year-on-year decline of 22.01% [5] Shareholder Structure - The number of shareholders is 66,800, with the top ten shareholders holding 469 million shares, accounting for 45.10% of the total share capital [5] - The largest shareholder is Jiangxi Sanchuan Group Co., Ltd., holding 35.84% of the shares [5]

汇源通信(000586.SZ):2025年三季报净利润为1476.34万元
Xin Lang Cai Jing· 2025-10-24 01:50
Core Viewpoint - Huiyuan Communication (000586.SZ) reported its Q3 2025 financial results, showing a total revenue of 361 million yuan and a net profit attributable to shareholders of 14.76 million yuan [1][3]. Financial Performance - The company's total revenue for Q3 2025 was 361 million yuan [1]. - The net profit attributable to shareholders was 14.76 million yuan [1]. - The net cash inflow from operating activities was 13.64 million yuan [1]. Key Financial Ratios - The latest debt-to-asset ratio is 43.66%, an increase of 5.94 percentage points compared to the same period last year [3]. - The latest gross profit margin stands at 33.88% [3]. - The return on equity (ROE) is 4.36% [3]. - The diluted earnings per share (EPS) is 0.08 yuan [3]. - The total asset turnover ratio is 0.61 times [3]. - The inventory turnover ratio is 2.94 times [3]. Shareholder Information - The number of shareholders is 16,400, with the top ten shareholders holding a total of 89.60 million shares, accounting for 46.32% of the total share capital [3]. - The top shareholders and their holdings are as follows: - Beijing Dingyun Technology Development Co., Ltd.: 14.1 million shares - Guangzhou Huifu Qiji Investment Partnership (Limited Partnership): 13.7 million shares - Quanzhou Shenghui Investment Co., Ltd.: 5.00 million shares - Jiang Guoxiang: 4.86 million shares - Changfei Optical Fiber Cable Co., Ltd.: 2.79 million shares - Li Shuang: 1.62 million shares - Liu Zhongyi: 1.55 million shares - Liu Jiaming: 0.96 million shares - Shi Wenchao: 0.88 million shares - Li Baozhen: 0.81 million shares [3].

霍尼韦尔Q3经调整EPS为2.82美元 高于预期
Ge Long Hui A P P· 2025-10-23 10:19
Group 1 - The core point of the article is that Honeywell reported adjusted earnings per share of $2.82 for the third quarter, exceeding market expectations of $2.57 [1] - Honeywell's third-quarter revenue reached $10.41 billion, surpassing market expectations of $10.15 billion [1]
宝洁Q3经调整核心每股收益50美分 高于预期
Ge Long Hui A P P· 2025-10-23 10:13
Core Insights - Procter & Gamble reported adjusted core earnings per share of $0.50 for the third quarter, exceeding market expectations of $0.43 [1] - The company has revised its fiscal year adjusted core earnings per share guidance to a range of $1.49 to $1.51, slightly down from the previous forecast of $1.48 to $1.52, while market expectations remain at $1.49 [1] Financial Performance - The adjusted core earnings per share of $0.50 indicates a strong performance relative to market forecasts [1] - The updated guidance for the fiscal year reflects a minor adjustment but maintains a positive outlook within the expected range [1]
HBT Financial, Inc. (NASDAQ:HBT) Surpasses Earnings Estimates in Q3 2025
Financial Modeling Prep· 2025-10-20 22:00
Core Insights - HBT Financial, Inc. reported a third-quarter earnings per share (EPS) of $0.65, exceeding estimates and showing year-over-year improvement [2][6] - The company's revenue for the quarter was approximately $59.8 million, reflecting a 6% increase compared to the same period last year, despite being slightly below estimates [2][6] Financial Performance - The EPS of $0.65 surpassed the estimated $0.62 and improved from the previous year's EPS of $0.61 [2][6] - Revenue of $59.8 million was slightly below the estimated $60.8 million but represented a 6% year-over-year increase [2][6] Strategic Moves - HBT's merger with CNB Bank Shares is aimed at enhancing future earnings growth, presenting both opportunities and potential integration costs [3][6] - The company maintains a strong net interest margin and solid asset quality, which are essential for financial stability and growth prospects [3][6] Valuation Metrics - HBT has a price-to-earnings (P/E) ratio of approximately 9.92, indicating market valuation of its earnings [4] - The price-to-sales ratio is about 2.61, reflecting its market value relative to sales [4] - The enterprise value to sales ratio is around 2.87, showing the company's total valuation compared to its revenue [4] Financial Health - HBT's low debt-to-equity ratio of 0.17 indicates conservative use of debt [5] - The current ratio of 0.19 suggests potential liquidity challenges in meeting short-term obligations [5] - The company's earnings yield of about 10.08% provides a favorable return on investment for shareholders [5]

下周财报季开锣,大摩预期北美银行“稳中有升”
Zhi Tong Cai Jing· 2025-10-09 11:02
Core Viewpoint - Morgan Stanley has adjusted its model for North American large banks' Q3 2025 performance forecasts, indicating a mild impact on EPS growth of 0-1% and a median EPS estimate 3% higher than market consensus [1][2] Group 1: Earnings Forecasts - The median EPS forecast for North American banks in Q3 2025 is 3% above market consensus, with the largest increases expected for money center banks and State Street Bank (STT.US) [1] - Citigroup (C.US) is projected to have an EPS of $1.99, exceeding the market consensus of $1.83 by 9% [1] - Bank of America (BAC.US) is expected to report an EPS of $1.01, which is 7% higher than the consensus of $0.94 [1] - State Street Bank's EPS is forecasted to be 6% above consensus, while Northern Trust (NTRS.US) is expected to be 3% higher [1] - Most super-regional banks are projected to be 1-3% above consensus, with Truist Financial (TFC.US) and Wells Fargo (WFC.US) both expected to be 3% higher [1] Group 2: Key Financial Metrics - The model incorporates a macro assumption of an additional 125 basis points rate cut by the end of 2026, with a focus on Citigroup, Bank of America, Goldman Sachs, and JPMorgan Chase (JPM.US) due to expected outperformance in investment banking fees and trading income [2] - Money center banks are expected to lead in asset growth, with JPMorgan Chase's average total assets projected to reach $4.43 trillion, an 8.4% year-over-year increase, and Bank of America expected to reach $3.47 trillion, a 5.5% increase [2] - The deposit structure shows a gradual decline in non-interest-bearing deposits, with Bank of America projected to have 26.0% in 2025, down from 26.7% in 2024 [2] - The net interest margin (NIM) is expected to remain stable, with a median estimate of 2.50% for 2025, while super-regional banks are projected to have higher NIMs [2] Group 3: Revenue Growth Drivers - Fee income is a core growth driver, with M&A fees expected to grow 30% year-over-year, significantly above the consensus growth of 11% [3] - Equity Capital Markets (ECM) fees are projected to increase by 41%, compared to a consensus of 30%, while Debt Capital Markets (DCM) fees are expected to grow by 4% against a consensus of 3% [3] - Money center banks like JPMorgan and Goldman Sachs are expected to see over 9% year-over-year growth in fee income for 2025 [3] Group 4: Capital Returns - The median dividend payout ratio for banks in 2025 is expected to be around 30%, with money center banks showing a slight decrease from 27% to 29% [3] - JPMorgan is projected to pay $5.80 per share in dividends, while Citigroup is expected to pay $2.32 per share [3] - Stock buybacks are anticipated to increase significantly, with JPMorgan expected to repurchase $38.01 billion in 2025, up from $18.84 billion in 2024, and Citigroup expected to repurchase $13.47 billion, a substantial increase from $2.5 billion in 2024 [3] Group 5: Overall Outlook - The report maintains a cautiously optimistic view on North American large banks, suggesting that money center banks will outperform due to investment banking and trading income, while super-regional banks show stable asset quality [4] - Trust banks are expected to face pressure on net interest margins but still demonstrate resilience supported by fee income [4]