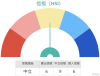
支撑位
Search documents
金属期权策略早报:金属期权-20251105
Wu Kuang Qi Huo· 2025-11-05 01:55
1. Report Industry Investment Rating No relevant information provided. 2. Core Viewpoints of the Report - For non - ferrous metals, construct a seller neutral volatility strategy as they are in a range - bound oscillation; for black metals, build a short - volatility portfolio strategy due to their large - amplitude fluctuations; for precious metals, create a spot hedging strategy following their significant decline from high levels [2]. 3. Summary by Related Catalogs 3.1 Futures Market Overview - The latest prices of various metal futures showed different trends, with most experiencing price drops. For example, copper (CU2512) dropped by 0.86% to 85,690, and aluminum (AL2512) decreased by 0.35% to 21,405. Trading volumes and open interests also varied among different metals [3]. 3.2 Option Factors - Volume and Open Interest PCR - PCR indicators describe the strength of option underlying market trends and potential turning points. For instance, the copper option's volume PCR was 0.61, and the open interest PCR was 0.78 [4]. 3.3 Option Factors - Pressure and Support Levels - From the perspective of the strike prices with the largest open interest in call and put options, the pressure and support levels of each metal option were identified. For example, the pressure level of copper was 90,000, and the support level was 84,000 [5]. 3.4 Option Factors - Implied Volatility - The implied volatility of each metal option showed different levels and trends. For example, the implied volatility of copper was 15.56% at the at - the - money strike, and the weighted implied volatility was 19.01%, showing a decrease of 1.39% [6]. 3.5 Strategy and Recommendations for Different Metals 3.5.1 Non - Ferrous Metals - **Copper**: The fundamentals showed inventory changes in major exchanges. The market was in a high - level consolidation with support. Option strategies included a short - volatility seller option portfolio strategy and a spot long - hedging strategy [7]. - **Aluminum**: Inventory data indicated a complex situation. The market showed a long - biased upward high - level oscillation. Strategies included a bullish call option spread strategy, a short - volatility strategy, and a spot collar strategy [9]. - **Zinc**: The fundamentals involved TC prices and inventory data. The market was in a fluctuating recovery with pressure. Strategies included a short - volatility strategy and a spot collar strategy [9]. - **Nickel**: Global inventory increased. The market was in a wide - range oscillation with short - side pressure. Strategies included a short - volatility strategy and a spot covered - call strategy [10]. - **Tin**: The supply side faced challenges. The market showed a short - term high - level oscillation with support. Strategies included a short - volatility strategy and a spot collar strategy [10]. - **Lithium Carbonate**: Inventory was being depleted. The market was in an oscillating recovery followed by a rapid decline. Strategies included a short - volatility strategy and a spot long - hedging strategy [11]. 3.5.2 Precious Metals - **Gold**: The Fed's policy influenced the market. The market showed a long - term upward trend with high - level consolidation. Strategies included a short - volatility neutral option seller portfolio strategy and a spot hedging strategy [12]. 3.5.3 Black Metals - **Rebar**: Inventory decreased. The market was in a weak short - side trend with pressure. Strategies included a short - volatility strategy and a spot long - covered - call strategy [14]. - **Iron Ore**: Port inventory increased. The market was in a weak oscillating downward trend with support and pressure. Strategies included a short - volatility strategy and a spot long - collar strategy [14]. - **Ferroalloy (Manganese Silicon)**: Production was stable with high inventory. The market was in a weak short - side trend. Strategies included a short - volatility strategy [15]. - **Industrial Silicon**: Inventory remained high. The market was in a large - range oscillating weak trend. Strategies included a short - volatility strategy and a spot hedging strategy [15]. - **Glass**: Production was stable, and inventory decreased. The market was in a weak trend with pressure. Strategies included a short - volatility strategy and a spot long - collar strategy [16].
11月3日【港股Podcast】恆指、小米集團、中海油、蔚來、快手、港交所
Ge Long Hui· 2025-11-04 19:51
Group 1 - The Hang Seng Index (HSI) closed at 26,158 points, near the middle line of the Bollinger Bands at 26,163 points, indicating a potential for slight upward movement if trading volume increases [1][2] - Investors are divided, with bullish investors targeting levels between 26,300 and 26,500, while bearish investors see strong resistance at 26,200, predicting a potential drop of 300 points [1][2] - Current resistance is estimated at around 26,600 points, with a possibility of reaching 26,679 points if the index breaks through this level [2] Group 2 - Xiaomi's stock price rose slightly to 44.72 HKD, with a first resistance level at 48.1 HKD, and a potential upward movement towards 53.8 HKD if this level is breached [9][10] - Technical signals for Xiaomi show 11 buy signals and 6 sell signals, indicating a slightly positive short-term outlook [9][10] - The support level for Xiaomi is around 42.6 HKD, and if it falls below this, it could drop to 40 HKD [9][10] Group 3 - CNOOC's stock price closed at 20.46 HKD, close to the upper Bollinger Band, with a support level at 19.7 HKD [14] - If CNOOC's stock price drops below 19.7 HKD, it may further decline to 19.2 HKD [14] Group 4 - NIO's stock price increased to 56.9 HKD, with a resistance level at 59.9 HKD, and a potential rise to 63.2 HKD if this level is surpassed [18] - Investors are advised to choose options with a strike price about 10% out of the money and longer expiration dates for better safety [18] Group 5 - Kuaishou's stock price closed at 73.45 HKD, with a resistance level at 78.2 HKD, and a potential rise to 85.7 HKD if this level is broken [25][26] - Technical signals indicate 10 buy signals and 5 sell signals, suggesting a slightly positive short-term outlook [25][26] Group 6 - Hong Kong Exchanges and Clearing (HKEX) closed at 428.8 HKD, with a resistance level at 439 HKD, and a potential rise to 449 HKD if this level is breached [32] - Technical signals show 9 buy signals and 5 sell signals, indicating a slight preference for buying [32]


Stock Of The Day: Trading Opportunities In Albemarle?
Benzinga· 2025-10-27 16:42
Core Viewpoint - Albemarle Corporation's stock is experiencing a decline of over 6.3% on Monday, despite a previous rise and a new 'buy' recommendation from a brokerage firm, indicating potential low-risk trading opportunities for some traders [1]. Market Dynamics - Traders often look to buy stocks at two key market levels: just above resistance levels and just above support levels [2]. - Resistance is defined as a price level where strong selling interest exists, causing upward price movements to pause or end [3]. - A breakout occurs when buyers overpower sellers at a resistance level, leading to a bullish trend as buyers begin to outbid each other [4]. Technical Analysis - The $108 price level has been identified as a resistance point for Albemarle, with traders potentially looking to buy if this level is broken [5]. - Should the stock decline, support is anticipated around $97.30, a former resistance level that may convert to support as sellers regret their previous sales [7]. - Buying activity at support levels can lead to price rallies as anxious buyers compete to secure shares [8]. Trading Strategy - Understanding resistance and support levels is crucial for traders to make informed decisions on order placements, which can enhance trading profitability [9].

10月16日【港股Podcast】恆指、比亞迪電子、小米、神華、舜宇科技、嗶哩嗶哩
Ge Long Hui· 2025-10-17 11:52
Group 1: Hang Seng Index (HSI) - The Hang Seng Index (HSI) experienced a slight decline of approximately 22 points, closing at 25,888 points, indicating a lack of clear market direction among investors [1] - Investors are divided, with some bullish investors waiting for the index to reach 26,250 points to fill the gap, while bearish investors anticipate a drop to the 25,200-25,400 range [1] - Current technical signals show a "neutral" market, with an equal number of buy and sell indicators, suggesting no clear trend [2] Group 2: BYD Electronics (00285) - BYD Electronics has seen an increase in trading volume over the past two days, indicating potential buying interest, with a resistance level around 43 HKD [8] - The stock is currently in a "neutral" technical state, similar to the HSI, with no clear direction indicated by the technical signals [8] - If the stock continues to rise, it may challenge the 43 HKD level, while a pullback could see it drop to the 38-39 HKD range [8] Group 3: Xiaomi Group (01810) - Xiaomi's stock has been on a downward trend, reaching a low of 47.32 HKD, but technical signals currently show a "buy" bias with 10 buy signals against 5 sell signals [14] - The short-term resistance level is around 52.7 HKD, while the support level is at 45.8 HKD, with a potential drop to 39.9 HKD if the support is breached [14] - The market sentiment is mixed, with both bullish and bearish perspectives present [14] Group 4: China Shenhua (01088) - China Shenhua's stock has performed well recently, closing at 40.98 HKD, but is considered to be at a relatively high level, with an RSI of 86 indicating overbought conditions [20] - Technical signals suggest a "sell" bias with 8 sell signals and 5 buy signals, indicating a potentially weaker trend [20] - The current resistance level is around 42.2 HKD, with a support level at 39.5 HKD [20] Group 5: Sunny Optical Technology (02382) - Sunny Optical has shown a rebound over the past two days but remains at low levels, with no clear reversal signals yet [26] - Technical analysis indicates a "buy" bias with 8 buy signals and 5 sell signals, suggesting a slightly stronger outlook [26] - The resistance level to watch for a potential rise to 88 HKD is around 85.4 HKD, with a possibility of reaching 89.7 HKD if this level is surpassed [26] Group 6: Bilibili (09626.HK) - Bilibili's stock has recently rebounded, closing at 212 HKD, approaching the middle line of the Bollinger Bands at around 215 HKD [30] - Current technical signals are "neutral," indicating no clear direction, and investors are advised to wait for further analysis [30] - The first support level is around 199 HKD, with a potential drop to 188 HKD if this level is breached [30]
金属期权策略早报:金属期权-20251014
Wu Kuang Qi Huo· 2025-10-14 03:19
1. Report Industry Investment Rating No relevant content provided. 2. Core Viewpoints of the Report - The metal sector is divided into non - ferrous metals, precious metals, and black metals. For non - ferrous metals, a neutral volatility seller strategy can be constructed as they are in a range - bound state; for black metals with large - amplitude fluctuations, a short - volatility portfolio strategy is suitable; for precious metals with an upward - breaking trend, a spot hedging strategy is recommended [2]. 3. Summary by Related Catalogs 3.1 Futures Market Overview - Copper (CU2511) closed at 86,520, up 1,710 (2.02%), with a trading volume of 29.14 million lots and an open interest of 20.18 million lots [3]. - Aluminum (AL2511) closed at 20,975, up 115 (0.55%), with a trading volume of 19.17 million lots and an open interest of 17.09 million lots [3]. - Other metals such as zinc, lead, nickel, etc., also have detailed price, trading volume, and open - interest data presented [3]. 3.2 Option Factors - Volume and Open Interest PCR - For copper options, the volume PCR is 0.74 (up 0.40), and the open - interest PCR is 0.71 (down 0.03) [4]. - Aluminum options have a volume PCR of 1.03 (up 0.63) and an open - interest PCR of 0.84 (up 0.11) [4]. - Different metals' option volume and open - interest PCR data reflect market sentiment and potential trend reversals [4]. 3.3 Option Factors - Pressure and Support Levels - Copper's pressure point is 92,000 and support point is 80,000 [5]. - Aluminum's pressure point is 21,400 and support point is 20,400 [5]. - These levels are derived from the strike prices of the maximum open - interest call and put options [5]. 3.4 Option Factors - Implied Volatility - Copper's at - the - money implied volatility is 22.38%, and the weighted implied volatility is 24.94% (down 0.46%) [6]. - Aluminum's at - the - money implied volatility is 9.91%, and the weighted implied volatility is 12.62% (up 0.09%) [6]. - The implied volatility data helps in formulating volatility - based option strategies [6]. 3.5 Option Strategies and Recommendations 3.5.1 Non - Ferrous Metals - **Copper Options**: Construct a short - volatility seller option portfolio strategy and a spot hedging strategy [7]. - **Aluminum/Alumina Options**: Build a neutral short - call and short - put option combination strategy and a spot collar strategy [9]. - **Zinc/Lead Options**: Adopt a neutral short - call and short - put option combination strategy and a spot collar strategy [9]. - **Nickel Options**: Implement a short - bearish call and put option combination strategy and a spot covered - call strategy [10]. - **Tin Options**: Use a short - volatility strategy and a spot collar strategy [10]. - **Lithium Carbonate Options**: Apply a short - bearish call and put option combination strategy and a spot long - put and short - call strategy [11]. 3.5.2 Precious Metals - **Gold/Silver Options**: Build a bullish call spread strategy, a long - biased short - volatility option seller portfolio strategy, and a spot hedging strategy [12]. 3.5.3 Black Metals - **Rebar Options**: Use a short - bearish call and put option combination strategy and a spot covered - call strategy [13]. - **Iron Ore Options**: Adopt a neutral short - call and short - put option combination strategy and a spot collar strategy [13]. - **Ferroalloy Options**: Implement a short - volatility strategy for manganese - silicon options [14]. - **Industrial Silicon/Polysilicon Options**: Build a short - volatility short - call and short - put option combination strategy and a spot long - put and short - call strategy [14]. - **Glass Options**: Use a short - volatility short - call and short - put option combination strategy and a spot collar strategy [15].
金属期权策略早报:金属期权-20251013
Wu Kuang Qi Huo· 2025-10-13 03:47
1. Report Industry Investment Rating No relevant content provided. 2. Core Viewpoints of the Report - For non - ferrous metals, build a seller's neutral volatility strategy as they are in a range - bound oscillation [2]. - For black metals, construct a short - volatility portfolio strategy due to their large - amplitude fluctuations [2]. - For precious metals, build a spot hedging strategy as they break upward [2]. 3. Summaries by Related Catalogs 3.1 Futures Market Overview - The latest prices of various metal futures have different changes. For example, copper (CU2511) dropped 4.46% to 83,030, while gold (AU2512) rose 0.42% to 913.26. The trading volumes and open interests also vary among different metals [3]. 3.2 Option Factors - Volume and Open Interest PCR - The volume and open interest PCR of different metal options have different trends. For instance, the volume PCR of copper decreased by 0.14 to 0.33, and the open interest PCR decreased by 0.02 to 0.74 [4]. 3.3 Option Factors - Pressure and Support Levels - From the perspective of option factors, different metal options have their own pressure and support levels. For example, the pressure level of copper is 92,000 and the support level is 80,000 [5]. 3.4 Option Factors - Implied Volatility - The implied volatility of different metal options shows different characteristics. For example, the weighted implied volatility of copper increased by 1.37 to 25.40%, while that of aluminum decreased by 0.35 to 12.53% [6]. 3.5 Strategies and Recommendations 3.5.1 Non - ferrous Metals - **Copper**: Build a short - volatility seller's option portfolio strategy and a spot hedging strategy. The pressure level is 92,000 and the support level is 80,000 [7]. - **Aluminum/Alumina**: Construct a short - neutral call + put option combination strategy and a spot collar strategy. The pressure level of aluminum is 21,400 and the support level is 20,000; for alumina, the pressure level is 3,000 and the support level is 2,800 [9]. - **Zinc/Lead**: Build a short - neutral call + put option combination strategy and a spot collar strategy. The pressure level of zinc is 22,000 and the support level is 21,800 [9]. - **Nickel**: Construct a short - bearish call + put option combination strategy and a spot covered - call strategy. The pressure level is 130,000 and the support level is 120,000 [10]. - **Tin**: Build a short - volatility strategy and a spot collar strategy. The pressure level is 320,000 and the support level is 270,000 [10]. - **Lithium Carbonate**: Construct a short - bearish call + put option combination strategy and a spot long - hedging strategy. The pressure level is 99,000 and the support level is 65,000 [11]. 3.5.2 Precious Metals - **Gold/Silver**: For gold, construct a bull - spread call option strategy, a short - volatility option seller's combination strategy, and a spot hedging strategy. The pressure level is 888 and the support level is 800 [12]. 3.5.3 Black Metals - **Rebar**: Build a short - bearish call + put option combination strategy and a spot covered - call strategy. The pressure level is 3,500 and the support level is 3,000 [13]. - **Iron Ore**: Construct a short - neutral call + put option combination strategy and a spot long - collar strategy. The pressure level is 850 and the support level is 750 [13]. - **Ferroalloys**: For manganese silicon, build a short - volatility strategy. The pressure level is 6,000 and the support level is 5,800 [14]. - **Industrial Silicon/Polysilicon**: Construct a short - volatility call + put option combination strategy and a spot hedging strategy. The pressure level of industrial silicon is 14,200 and the support level is 8,000 [14]. - **Glass**: Build a short - volatility call + put option combination strategy and a spot long - collar strategy. The pressure level is 1,200 and the support level is 1,000 [15].
农产品期权策略早报:农产品期权-20251010
Wu Kuang Qi Huo· 2025-10-10 03:25
Group 1: Overall Summary - The report is an agricultural product options strategy morning report for October 10, 2025, mainly covering the market conditions of various agricultural product options and providing corresponding option strategies [1][2]. - The agricultural product sector is divided into beans, oils, agricultural by - products, soft commodities, grains, and others. For each sector, some varieties are selected to provide option strategy suggestions [8]. Group 2: Market Conditions of Underlying Futures - Different agricultural product futures have different price changes, trading volumes, and open interest changes. For example, the price of soybean No.1 (A2511) is 3,960 with no change, the trading volume is 105,500 lots, and the open interest is 137,600 lots [3]. Group 3: Option Factors Volume and Open Interest PCR - The volume and open interest PCR of each option variety are different, which can be used to describe the strength of the option underlying market and whether the underlying market has a turning point. For example, the volume PCR of soybean No.1 option is 0.66 with a change of 0.06, and the open - interest PCR is 0.49 with a change of - 0.01 [4]. Pressure and Support Levels - The pressure and support levels of each option variety are obtained from the strike prices of the maximum open interest of call and put options. For example, the pressure level of soybean No.1 is 4000, and the support level is 3900 [5]. Implied Volatility - The implied volatility of each option variety also varies. For example, the at - the - money implied volatility of soybean No.1 is 10.295%, and the weighted implied volatility is 12.53% with a change of - 1.38% [6]. Group 4: Option Strategies for Different Varieties Oils and Oilseeds Options - **Soybean No.1**: Construct a short - biased call + put option combination strategy for volatility, and a long collar strategy for spot long - hedging [7]. - **Soybean Meal and Rapeseed Meal**: For soybean meal, construct a bear spread combination strategy for directionality, a short - biased call + put option combination strategy for volatility, and a long collar strategy for spot long - hedging [9]. - **Palm Oil, Soybean Oil, and Rapeseed Oil**: Construct a short - biased call + put option combination strategy for volatility and a long collar strategy for spot long - hedging [10]. - **Peanut**: Construct a bear spread combination strategy for directionality and a long + put + short out - of - the - money call option strategy for spot long - hedging [11]. Agricultural By - product Options - **Pig**: Construct a short - biased call + put option combination strategy for volatility and a spot long - covered call strategy [11]. - **Egg**: Construct a bear spread combination strategy for directionality, a short - biased call + put option combination strategy for volatility [12]. - **Apple**: Construct a short - biased long call + put option combination strategy for volatility [12]. - **Jujube**: Construct a short - biased long strangle option combination strategy for volatility and a spot long - covered call hedging strategy [13]. Soft Commodity Options - **Sugar**: Construct a short - biased call + put option combination strategy for volatility and a long collar strategy for spot long - hedging [13]. - **Cotton**: Construct a short - biased call + put option combination strategy for volatility and a spot long - covered call strategy [14]. Grain Options - **Corn and Starch**: Construct a short - biased call + put option combination strategy for volatility [14].
农产品期权策略早报-20250911
Wu Kuang Qi Huo· 2025-09-11 02:39
Group 1: Report Summary - The report is an agricultural product options strategy morning report dated September 11, 2025, covering various agricultural product options [1][2] - The overall market shows that oilseed and oil - related agricultural products are weakly volatile, while other products like agricultural by - products, soft commodities, and grains have different degrees of volatile or weak trends [2] - The recommended strategy is to construct an option portfolio strategy mainly based on sellers, along with spot hedging or covered strategies to enhance returns [2] Group 2: Market Overview of Underlying Futures - The report provides the latest prices, price changes, price change percentages, trading volumes, volume changes, open interests, and open interest changes of various agricultural product option underlying futures, including soybeans, soybean meal, palm oil, etc. [3] Group 3: Option Factor - Volume and Open Interest PCR - It presents the volume and open interest PCR data of different agricultural product options, which are used to describe the strength of the option underlying market and the turning point of the underlying market respectively [4] Group 4: Option Factor - Pressure and Support Levels - The pressure and support levels of various agricultural product option underlying assets are analyzed from the perspective of the strike prices with the largest open interest of call and put options [5] Group 5: Option Factor - Implied Volatility - The report shows the implied volatility data of different agricultural product options, including at - the - money implied volatility, weighted implied volatility, and its changes, as well as the difference between implied and historical volatilities [6] Group 6: Strategy and Recommendations for Different Agricultural Product Options Oilseed and Oil Options - **Soybean Options**: Based on the USDA report and market data, the soybean market has a certain pattern. The implied volatility of soybean options is at a relatively high level, and the market is weakly volatile. Strategies include constructing a neutral call + put option combination for volatility, and a long collar strategy for spot hedging [7] - **Soybean Meal and Rapeseed Meal Options**: Due to sufficient supply and limited downstream demand, the soybean meal market is under pressure. Option strategies include a bear spread strategy for direction, a short - biased call + put option combination for volatility, and a long collar strategy for spot hedging [8][9] - **Palm Oil, Soybean Oil, and Rapeseed Oil Options**: According to the MPOA data, the palm oil market has production, inventory, and export changes. Option strategies include a short - biased call + put option combination for volatility and a long collar strategy for spot hedging [10] - **Peanut Options**: In the off - season of consumption, the peanut market is weakly volatile. Strategies include a bear spread strategy for direction and a long collar strategy for spot hedging [11] Agricultural By - product Options - **Pig Options**: With changes in the piglet price and inventory, the pig market is weakly volatile. Strategies include a short - biased call + put option combination for volatility and a covered call strategy for spot [11] - **Egg Options**: Due to high supply and weak demand, the egg market is weak. Strategies include a bear spread strategy for direction, a short - biased call + put option combination for volatility [12] - **Apple Options**: Affected by inventory and new product listing, the apple market has a certain upward trend. Strategies include a short - biased call + put option combination for volatility [12] - **Jujube Options**: The jujube market has supply pressure and shows a short - term decline. Strategies include a short strangle option combination for volatility and a covered call strategy for spot [13] Soft Commodity Options - **Sugar Options**: With changes in Brazilian sugar production and global supply - demand forecasts, the sugar market is weakly bearish. Strategies include a short - biased call + put option combination for volatility and a long collar strategy for spot hedging [13] - **Cotton Options**: Due to the increase in Brazilian cotton production forecast, the cotton market is short - term weak. Strategies include a short - biased call + put option combination for volatility and a covered call strategy for spot [14] Grain Options - **Corn and Starch Options**: With the approaching of the new corn season and sufficient inventory of grain - using enterprises, the corn market is weakly bearish. Strategies include a short - biased call + put option combination for volatility [14] Group 7: Option Charts - The report provides various charts of different agricultural product options, including price trends, volume and open interest trends, implied volatility trends, etc., to visually display the market conditions of different options [16][33][53]
能源化工期权策略早报-20250911
Wu Kuang Qi Huo· 2025-09-11 02:33
Report Industry Investment Rating - Not provided in the document Core Viewpoints of the Report - The energy and chemical sector is mainly divided into energy, alcohols, polyolefins, rubber, polyesters, alkalis, and others. For each sector, options strategies and suggestions are provided for selected varieties. Each options variety's strategy report includes an analysis of the underlying asset's market, research on options factors, and options strategy recommendations [8] Summary by Relevant Catalogs 1. Overview of Underlying Futures Markets - The report presents the latest prices, price changes, price change percentages, trading volumes, volume changes, open interests, and open interest changes of various energy and chemical options' underlying futures contracts, including crude oil, liquefied petroleum gas (LPG), methanol, etc [3] 2. Options Factors - Volume and Open Interest PCR - The volume and open interest PCR values and their changes are provided for different options varieties, which are used to describe the strength of the underlying asset's market and potential turning points [4] 3. Options Factors - Pressure and Support Levels - The pressure and support levels of different options' underlying assets are determined from the strike prices with the largest open interest of call and put options [5] 4. Options Factors - Implied Volatility - The implied volatility data of different options varieties are presented, including at-the-money implied volatility, weighted implied volatility, and its changes, as well as the difference between implied and historical volatility [6] 5. Strategy and Suggestions for Each Option Variety Energy Options - **Crude Oil**: Fundamental factors include geopolitical uncertainties, long - term supply - demand imbalances, and negative macro - sentiment. The market shows a bearish trend with resistance. Options strategies include constructing a short - biased call + put options combination and a long collar strategy for spot hedging [7] - **LPG**: The domestic supply is ample, and demand is weak. The market is bearish. Options strategies involve constructing a short - biased call + put options combination and a long collar strategy for spot hedging [9] Alcohol Options - **Methanol**: The production volume has increased, and the market is bearish. Strategies include a bearish spread of put options, a short - biased call + put options combination, and a long collar strategy for spot hedging [9] - **Ethylene Glycol**: The inventory has decreased, and the market is bearish. Strategies include a short - volatility strategy and a long collar strategy for spot hedging [10] Polyolefin Options - For polypropylene, polyvinyl chloride, plastic, and styrene, strategies mainly focus on spot long - hedging by holding the underlying asset long, buying at - the - money put options, and selling out - of - the - money call options [10] Rubber Options - The market shows a gradually warming - up trend. Strategies include constructing a neutral call + put options combination to obtain time value and directional returns [11] Polyester Options - For PTA, the market is bearish. Strategies include constructing a short - biased call + put options combination to obtain time value [11] Alkali Options - **Caustic Soda**: The market is in a downward trend. Strategies include a long collar strategy for spot hedging [12] - **Soda Ash**: The supply is increasing, and the market is bearish. Strategies include a short - volatility combination and a long collar strategy for spot hedging [12] Urea Options - The market is in a weak and stagnant state. Strategies include constructing a short - biased call + put options combination and a long collar strategy for spot hedging [13] 6. Option Charts - Charts for various options, such as crude oil, LPG, methanol, etc., are provided, including price trends, trading volume, open interest, PCR, implied volatility, and historical volatility cone [15][35][55]
金属期权策略早报-20250908
Wu Kuang Qi Huo· 2025-09-08 02:37
Report Summary 1. Report Industry Investment Rating No relevant information provided. 2. Core Viewpoints - For non - ferrous metals, a neutral volatility seller strategy can be constructed as they show a weak and volatile trend; for the black series, a short - volatility portfolio strategy is suitable due to large - amplitude fluctuations; for precious metals, a spot hedging strategy can be built as they break upward [2]. 3. Summary by Relevant Catalogs 3.1 Futures Market Overview - The latest prices, price changes, trading volumes, and open interest of various metal futures contracts are presented, such as the copper CU2510 contract with a latest price of 79,440, a decline of 500, and a trading volume of 5.54 million lots [3]. 3.2 Option Factor - Volume and Open Interest PCR - Volume and open - interest PCR data for different metal options are provided, which are used to describe the strength of the option underlying market and the turning points of the underlying market [4]. 3.3 Option Factor - Pressure and Support Levels - Pressure and support levels for different metal options are analyzed from the perspective of the strike prices with the largest open interest of call and put options [5]. 3.4 Option Factor - Implied Volatility - Implied volatility data for different metal options are presented, including at - the - money implied volatility, weighted implied volatility, and the difference between implied and historical volatility [6]. 3.5 Strategy and Recommendations - **Non - ferrous Metals** - **Copper**: Based on the stable inventory, the upward - trending price, and the option factors, a short - volatility seller option portfolio strategy and a spot long - hedging strategy are recommended [7]. - **Aluminum/Alumina**: Given the inventory changes, price trends, and option factors, a bull - spread strategy, a short - neutral call + put option combination strategy, and a spot collar strategy are suggested [9]. - **Zinc/Lead**: Considering the supply and demand fundamentals, price trends, and option factors, a short - neutral call + put option combination strategy and a spot collar strategy are recommended [9]. - **Nickel**: Based on the industrial fundamentals, price trends, and option factors, a short - bearish call + put option combination strategy and a spot covered - call strategy are suggested [10]. - **Tin**: Given the inventory and price trends, and option factors, a short - volatility strategy and a spot collar strategy are recommended [10]. - **Lithium Carbonate**: Considering the production, inventory, price trends, and option factors, a short - bearish call + put option combination strategy and a spot long - hedging strategy are suggested [11]. - **Precious Metals** - **Gold/Silver**: Based on the macro - fundamentals, price trends, and option factors, a bull - spread strategy, a short - neutral volatility seller option portfolio strategy, and a spot hedging strategy are recommended [12]. - **Black Series** - **Rebar**: Given the production capacity utilization rate, price trends, and option factors, a short - bearish call + put option combination strategy and a spot covered - call strategy are suggested [13]. - **Iron Ore**: Considering the inventory, price trends, and option factors, a short - neutral call + put option combination strategy and a spot long - collar strategy are recommended [13]. - **Ferroalloys**: Based on the production capacity utilization rate, price trends, and option factors, a short - volatility strategy is recommended for manganese - silicon, and a short - volatility call + put option combination strategy and a spot hedging strategy are suggested for industrial silicon and polysilicon [14]. - **Glass**: Given the supply and demand fundamentals, price trends, and option factors, a short - volatility call + put option combination strategy and a spot long - collar strategy are recommended [15].