市盈率
Search documents
创业黑马:2025年前三季度净利润同比减亏1823.09万元
Sou Hu Cai Jing· 2025-10-21 10:31
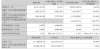
Financial Performance - The company's operating revenue for the reporting period was 31,617,723.60 yuan, representing a decrease of 45.42% compared to the same period last year [1] - The net profit attributable to shareholders of the listed company was -13,273,605.67 yuan, down 38.76% year-on-year [1] - The net profit attributable to shareholders after deducting non-recurring gains and losses was -13,430,139.45 yuan, a decrease of 34.01% compared to the previous year [1] - The basic and diluted earnings per share were both -0.0796 yuan, reflecting a decline of 39.40% [1] - The weighted average return on equity was -3.29%, a drop of 70.47% year-on-year [1] Cash Flow and Investment - The net cash flow from operating activities was -56,312,400 yuan, indicating a significant decrease [25] - The net cash flow from financing activities was -336,880 yuan, which increased by 701,420 yuan year-on-year [25] - The net cash flow from investing activities was -7,821,470 yuan, compared to -6,853,750 yuan in the same period last year [25] Asset and Liability Changes - As of the end of the reporting period, total assets were 545,106,542.55 yuan, down from 636,301,507.66 yuan at the end of the previous year [1] - The equity attributable to shareholders of the listed company decreased to 400,008,582.31 yuan from 423,688,638.69 yuan [1] - The company's cash and cash equivalents decreased by 40.55% compared to the end of the previous year, with a significant drop in its proportion of total assets [32] - The company's liabilities, including accounts payable, decreased by 31.59%, affecting their proportion of total assets [35] Shareholder Structure - As of the end of the third quarter of 2025, a new shareholder, Cao Xiaobing, replaced Wang Qifei from the previous quarter [44] - The shareholding proportions of existing shareholders such as Cui Zihao, Zhang Yuxia, and Wang Jiwen have increased [44] Valuation Metrics - As of October 21, the company's price-to-earnings ratio (TTM) was approximately -55.57 times, with a price-to-book ratio (LF) of about 12.13 times and a price-to-sales ratio (TTM) of approximately 29.36 times [1]


HBT Financial, Inc. (NASDAQ:HBT) Surpasses Earnings Estimates in Q3 2025
Financial Modeling Prep· 2025-10-20 22:00
Core Insights - HBT Financial, Inc. reported a third-quarter earnings per share (EPS) of $0.65, exceeding estimates and showing year-over-year improvement [2][6] - The company's revenue for the quarter was approximately $59.8 million, reflecting a 6% increase compared to the same period last year, despite being slightly below estimates [2][6] Financial Performance - The EPS of $0.65 surpassed the estimated $0.62 and improved from the previous year's EPS of $0.61 [2][6] - Revenue of $59.8 million was slightly below the estimated $60.8 million but represented a 6% year-over-year increase [2][6] Strategic Moves - HBT's merger with CNB Bank Shares is aimed at enhancing future earnings growth, presenting both opportunities and potential integration costs [3][6] - The company maintains a strong net interest margin and solid asset quality, which are essential for financial stability and growth prospects [3][6] Valuation Metrics - HBT has a price-to-earnings (P/E) ratio of approximately 9.92, indicating market valuation of its earnings [4] - The price-to-sales ratio is about 2.61, reflecting its market value relative to sales [4] - The enterprise value to sales ratio is around 2.87, showing the company's total valuation compared to its revenue [4] Financial Health - HBT's low debt-to-equity ratio of 0.17 indicates conservative use of debt [5] - The current ratio of 0.19 suggests potential liquidity challenges in meeting short-term obligations [5] - The company's earnings yield of about 10.08% provides a favorable return on investment for shareholders [5]

P/E Ratio Insights for Xylem - Xylem (NYSE:XYL)
Benzinga· 2025-10-20 16:42
Core Viewpoint - Xylem Inc. (NYSE:XYL) shows a positive stock performance with a current trading price of $145.99, reflecting a 0.05% increase, a 2.01% rise over the past month, and an 11.13% increase over the past year, leading to optimism among long-term shareholders [1] Group 1: P/E Ratio Analysis - The P/E ratio is a critical metric for assessing a company's market performance, comparing the current share price to the company's earnings per share (EPS), and is used by long-term investors to evaluate current performance against historical data and industry averages [5] - Xylem Inc. has a P/E ratio of 38.0, which is significantly higher than the Machinery industry average of 28.72, suggesting that shareholders may expect better performance from Xylem compared to its peers, although it raises concerns about potential overvaluation [6] - A higher P/E ratio may indicate that investors are willing to pay a premium for the stock due to expectations of future growth and rising dividends, but it is essential to consider this metric alongside other financial indicators and qualitative factors [8]

Weatherford International's Upcoming Earnings: A Look at NASDAQ:WFRD
Financial Modeling Prep· 2025-10-20 13:00
Core Viewpoint - Weatherford International plc is positioned positively in the oilfield services industry, with strong earnings expectations and a recent upgrade to a Zacks Rank 1 (Strong Buy) indicating a favorable outlook for investors [2][6]. Earnings Expectations - The company is set to release its quarterly earnings on October 21, 2025, with anticipated earnings per share (EPS) of $1.15 and revenue of approximately $1.18 billion [1][6]. Performance Track Record - Weatherford has consistently outperformed earnings estimates, achieving an average earnings surprise of 54.26% over the last two quarters [3][6]. - In the most recent quarter, Weatherford reported earnings of $1.87 per share, significantly exceeding the anticipated $0.97 per share, resulting in a surprise of 92.78% [3]. - In the previous quarter, the company surpassed the consensus estimate of $0.89 per share by reporting $1.03 per share, leading to a 15.73% surprise [4]. Valuation Metrics - The company's price-to-earnings (P/E) ratio is approximately 9.35, indicating market valuation of its earnings [4]. - Weatherford's price-to-sales ratio is about 0.87, reflecting investor willingness to pay per dollar of sales [4]. - The enterprise value to sales ratio stands at around 1.01, while the enterprise value to operating cash flow ratio is approximately 6.68 [5]. - The earnings yield is about 10.70%, suggesting a favorable return on investment based on earnings [5]. - The debt-to-equity ratio is approximately 1.16, indicating the proportion of debt used to finance the company's assets relative to shareholders' equity [5]. - Weatherford has a current ratio of about 2.21, demonstrating its ability to cover short-term liabilities with short-term assets [5].

3连板睿能科技:目前生产经营活动正常,不存在应披露未披露的信息
Di Yi Cai Jing· 2025-10-20 12:34
Core Viewpoint - The company has experienced significant stock price volatility, with a cumulative deviation of 20% in closing prices over three consecutive trading days, indicating abnormal trading activity [1] Group 1: Stock Performance - As of October 20, the company's A-share stock turnover rate is 18.04%, suggesting a high turnover risk [1] - The company's trailing twelve months (TTM) price-to-earnings (P/E) ratio is 221.3 times, while the static P/E ratio is 123.5 times [1] Group 2: Industry Comparison - The average P/E ratio for the computer, communication, and other electronic equipment manufacturing industry is 56.45 times, and for the software and information technology services industry, it is 68.36 times, indicating that the company's P/E ratios are significantly higher than industry averages [1] Group 3: Business Operations - The company is primarily engaged in the research, development, production, sales of industrial automation control products, and distribution of IC products [1] - Current production and operational activities are normal, with no significant changes in daily operations or external environment, and there is no undisclosed information that needs to be revealed [1]
三连板睿能科技:公司股票存在换手率较高风险
Zheng Quan Shi Bao Wang· 2025-10-20 12:22
人民财讯10月20日电,三连板睿能科技(603933)10月20日发布股票交易风险提示公告,截至10月20 日,公司A股股票换手率18.04%,存在换手率较高的风险,市盈率(TTM)为221.3倍、市盈率(静态)为 123.5倍。根据10月17日中证指数有限公司发布的证监会行业市盈率显示,公司所处的计算机、通信和 其他电子设备制造业市盈率为56.45倍,软件和信息技术服务业市盈率为68.36倍,市盈率高于同行业水 平。公司特别提醒投资者,注意投资风险,理性决策,审慎投资。 ...
合金投资:2025年前三季度净利润725.81万元 同比增长124.87%
Sou Hu Cai Jing· 2025-10-20 11:32
Financial Performance - The company's operating revenue for the reporting period is 657.12 million yuan, representing a year-on-year increase of 21.61% [1] - The net profit attributable to shareholders of the listed company is 26.82 million yuan, showing a significant increase of 4985.25% compared to the same period last year [1] - The net profit attributable to shareholders after deducting non-recurring gains and losses is 20.92 million yuan, up by 2787.02% year-on-year [1] - The basic and diluted earnings per share are both 0.0070 yuan, reflecting a remarkable increase of 6900.00% [1] - The weighted average return on equity is 1.37%, an increase of 1.34 percentage points [1] Cash Flow and Assets - The net cash flow from operating activities is 17.06 million yuan [1] - As of the end of the reporting period, total assets amount to 3.11 billion yuan, compared to 521.64 million yuan at the end of the previous year [1] - The equity attributable to shareholders of the listed company is 1.96 billion yuan, an increase from 1.89 billion yuan at the end of the previous year [1] Valuation Metrics - As of the market close on October 20, the company's price-to-earnings ratio (TTM) is approximately 167.2 times, the price-to-book ratio (LF) is about 13.37 times, and the price-to-sales ratio (TTM) is around 7.33 times [1] Shareholder Changes - The top ten circulating shareholders as of the end of the third quarter of 2025 include new shareholders such as Jiuzhou Hengchang Logistics Co., Ltd. and several individuals, replacing previous shareholders like Guanghui Energy Co., Ltd. and various international banks [39] - Jiuzhou Hengchang Logistics Co., Ltd. holds 79.88 million shares, accounting for 20.74% of the total share capital [40]
Price Over Earnings Overview: Guess - Guess (NYSE:GES)
Benzinga· 2025-10-17 19:00
Core Viewpoint - Guess Inc. has shown mixed performance with a slight increase in the short term but a significant decline over the past year, prompting long-term shareholders to reassess the company's price-to-earnings ratio [1]. Company Performance - The current share price of Guess Inc. is $16.79, reflecting a 0.03% decrease in the current market session [1]. - Over the past month, the stock has increased by 0.45%, but it has decreased by 10.49% over the past year [1]. Price-to-Earnings Ratio Analysis - The P/E ratio of Guess Inc. is 84.0, which is significantly higher than the aggregate P/E ratio of 22.58 for the Specialty Retail industry [6]. - A higher P/E ratio may suggest that the stock is overvalued, despite the potential for better future performance compared to its industry peers [6]. Investment Considerations - The P/E ratio is a useful metric for evaluating market performance, but it should be interpreted cautiously as it can indicate both undervaluation and weak growth prospects [8]. - Investors are encouraged to consider the P/E ratio alongside other financial metrics, industry trends, and qualitative factors for a comprehensive analysis [8].
P/E Ratio Insights for Caterpillar - Caterpillar (NYSE:CAT)
Benzinga· 2025-10-16 22:00
Core Viewpoint - Caterpillar Inc. has shown strong stock performance with a 15.85% increase over the past month and a 37.84% increase over the past year, leading to discussions about its valuation based on the price-to-earnings (P/E) ratio [1][6]. Group 1: Stock Performance - The current trading price of Caterpillar Inc. is $539.01, reflecting a 0.93% increase in the current session [1]. - Long-term shareholders are optimistic about the stock's performance due to its significant increases over the past month and year [1]. Group 2: P/E Ratio Analysis - The P/E ratio of Caterpillar Inc. is 27.19, which is higher than the Machinery industry's aggregate P/E ratio of 21.0, suggesting that the company may perform better than its industry peers [6]. - A higher P/E ratio could indicate that the stock is overvalued, despite the potential for better future performance [6]. Group 3: Limitations of P/E Ratio - The P/E ratio is a useful metric for assessing market performance but has limitations; it should not be used in isolation as other factors like industry trends and business cycles also affect stock prices [9]. - A lower P/E ratio can indicate undervaluation or a lack of expected future growth from shareholders [5][9].
Comerica Incorporated (NYSE:CMA) Quarterly Earnings Preview
Financial Modeling Prep· 2025-10-16 12:00
Core Viewpoint - Comerica Incorporated (NYSE:CMA) is a leading financial services company focused on commercial banking, retail banking, and wealth management, primarily operating in the United States [1] Financial Performance Expectations - Comerica is set to release its quarterly earnings on October 17, 2025, with an estimated earnings per share (EPS) of $1.28 and projected revenue of approximately $844 million [2][6] - Analysts expect a 4% increase in revenues year-over-year, although earnings may decline due to rising expenses and a reduction in net interest income (NII) [2][6] Historical Performance - The company has historically surpassed earnings estimates in three of the last four quarters, indicating potential for another earnings beat [3][6] Financial Metrics - Comerica's price-to-earnings (P/E) ratio is approximately 14.31, indicating moderate market valuation of its earnings [4] - The price-to-sales ratio is about 2.08, reflecting the company's market value relative to its revenue [4] - The enterprise value to sales ratio stands at around 2.78, indicating how the company's sales are valued [4] Debt and Liquidity Ratios - The debt-to-equity ratio is approximately 1.27, showing the proportion of debt used to finance assets relative to shareholders' equity [5] - The current ratio is around 0.22, highlighting the company's ability to cover short-term liabilities with short-term assets [5]
