中銀認沽證14387
Search documents
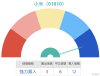
小米超賣觸底?搶反彈關鍵位全解析
Ge Long Hui· 2025-10-22 11:55
Core Viewpoint - Xiaomi's stock price is showing signs of a potential technical rebound after experiencing a period of adjustment, with current trading between 47.1 and 48.4 HKD, and an RSI indicator at 36 indicating oversold conditions [1][2]. Technical Analysis - The stock has fallen below the 10-day moving average (MA10) of 49.5 HKD and the 30-day moving average (MA30) of 53.65 HKD, creating a favorable entry point for investors [1]. - Multiple technical indicators are showing divergence, with momentum oscillators and VR ratio indicators signaling a buy, suggesting that a bottom is forming [1][2]. - Current short-term technical signals indicate a "strong buy" with 13 buy signals and 3 sell signals, reinforcing the notion that it may be a good time for short-term investors to consider buying [2]. Key Price Levels - The critical support level for Xiaomi is at 45.7 HKD; maintaining this level could provide a solid foundation for a rebound. A secondary support level is at 41 HKD [3]. - On the upside, the first resistance level is at 51.6 HKD, and if this is surpassed, the next target would be 55.7 HKD [3]. Derivative Products Performance - Recent performance of derivative products shows significant gains, with Societe Generale's bull certificate achieving a 95% increase over two days amid a 3.83% rise in the underlying stock [6]. - UBS's bull certificate also recorded a 75% increase, indicating strong market expectations for Xiaomi's rebound [6]. Investment Opportunities - For aggressive investors, Societe Generale's bull certificate with a recovery price of 45.5 HKD and a leverage of 14.9 times is recommended [9]. - More conservative strategies can consider UBS's bull certificate with a recovery price of 45 HKD and a leverage of 12.6 times [9]. - Investors anticipating a downturn may look at UBS's bear certificate and Morgan Stanley's bear certificate, both offering leverage of 6.1 times with a recovery price set at 57 HKD [9].

科技股波動加劇:小米當前價位的多空分析
Ge Long Hui· 2025-07-29 10:58
Core Viewpoint - Xiaomi Group's stock price is currently experiencing significant selling pressure, with a recent decline of 1.05% to HKD 56.8, indicating active market trading and a neutral signal without a clear direction [1][4]. Technical Analysis - The stock price is positioned slightly below the 10-day moving average of HKD 57.49, yet remains above the 30-day moving average of HKD 56.96 and the 60-day moving average of HKD 54.55, suggesting short-term adjustment pressure but no significant damage to the medium-term trend [1]. - Key support levels are identified at HKD 55.2 and HKD 53.6, while resistance levels are at HKD 58.4 and HKD 60.3. A rebound above HKD 57.5 could challenge the resistance at HKD 58.4, whereas a drop below HKD 55.2 may lead to a decline towards HKD 53.6 [4]. Market Sentiment - Technical indicators show mixed signals, with multiple moving averages issuing sell signals, but the overall market sentiment is not strongly bearish, as indicated by a sell strength of only 10. The RSI is at 53, indicating a neutral zone [4]. - Recent performance in the derivative market shows a significant increase in bearish instruments when Xiaomi's stock price fell by 2.82% on July 24, with notable gains in related put options [4]. Derivative Instruments - Investors looking for bullish positions may consider UBS call options (14816) with a strike price of HKD 61.05, offering a leverage of 5.9 times and low implied volatility. HSBC call options (14677) have the same strike price but offer slightly higher leverage at 6.1 times [7]. - For bearish investors, options such as Bank of China put options (14387) with a strike price of HKD 46.45 and leverage of 3.09 times, or UBS put options (17706) with a strike price of HKD 53.94 and leverage of 4.8 times, are available [7]. Investment Strategy - In the current market environment, a cautious approach is recommended, waiting for a clear breakout above HKD 57.5 or a drop below HKD 55.2 before making further moves. A range trading strategy could be beneficial, positioning call options near support levels and put options near resistance levels [13].

小米短線升勢延續定受阻?窩輪牛熊點樣拆局?
Ge Long Hui· 2025-06-24 10:29
Core Insights - Morgan Stanley reported that Xiaomi experienced over 30% year-on-year growth during the recent 618 shopping festival, with domestic business maintaining a strong growth momentum in Q2, accumulating a total payment amount of 35.5 billion RMB [1] - Goldman Sachs indicated that Xiaomi's electric vehicle factory phase two is preparing for production, with the YU 7 expected to be officially launched between late June and early July, which could be positive news for Xiaomi [1] - Technical analysis shows mixed signals; while overall signals indicate a buy with a strength of 15, some oscillators like the RSI are in overbought territory, suggesting potential short-term price adjustments [1][3] Technical Analysis - Xiaomi has two support levels at 52.3 and 54, with resistance levels at 58.4 and 60.4. The current price is 57.1, indicating a delicate balance between support and resistance [3] - The probability of an upward movement is 53%, with a 5-day volatility of 7.3%, reflecting market divergence in sentiment towards Xiaomi [3] Product Performance - Several products mentioned on June 19 performed well, with notable increases in warrants such as Citibank's warrant 13549 and HSBC's put warrant 14333, showing significant price appreciation within two days [3][5] Investment Opportunities - For those anticipating a rise in Xiaomi's stock price, Citibank's warrant 13549 offers the lowest premium with a leverage of 10.6 times and an exercise price of 61.5 [5] - For hedging against potential declines, HSBC's put warrant 14333 is recommended due to its low premium and implied volatility [6] Related Assets - Various warrants and certificates related to Xiaomi are available, including Citibank's warrant 13549 with a leverage of 10.6, and UBS's bear certificate 56421 with a leverage of 13.1 [7][8]
