RZGF(002629)
Search documents
业绩大涨叠加索赔新进展,一批信披违规上市企业的股民迎来利好
2 1 Shi Ji Jing Ji Bao Dao· 2025-11-07 13:43
Core Viewpoint - Several listed companies, including ST Huatuo, Tianwo Technology, and ST Emergency, have reported significant revenue and net profit growth for Q3 2025, despite facing issues related to securities fraud and regulatory penalties. This performance improvement provides a stronger basis for investor compensation through legal channels [1]. Group 1: ST Huatuo - ST Huatuo reported a quarterly revenue exceeding 10 billion yuan for the first time, with a net profit increase of 163.78% year-on-year [2]. - The company has faced regulatory penalties for financial misconduct from 2018 to 2022, with a total fine of 8 million yuan and accountability for its financial executives [2]. - Investors who purchased shares between April 27, 2019, and July 24, 2023, may be eligible for compensation [3]. Group 2: Tianwo Technology - Tianwo Technology achieved a revenue of 1.954 billion yuan in the first three quarters, a year-on-year increase of 14.83%, and a net profit surge of 950.20% [4]. - The company is currently dealing with over 100 compensation claims from shareholders, totaling approximately 13.84 million yuan [4]. - Investors who bought shares between April 28, 2017, and April 27, 2023, may also seek compensation [4]. Group 3: ST Emergency - ST Emergency reported total revenue of 591 million yuan, a year-on-year decrease of 18.06%, but a net profit increase of 58.96% [5]. - The company received penalties for accounting errors in its 2022 annual report, which overstated revenue by 31.37 million yuan [5]. - Investors who purchased shares between April 26, 2023, and December 19, 2023, may be eligible for compensation [5]. Group 4: Renzhi Co. - Renzhi Co. experienced a revenue decline of 47.95% year-on-year, with a net loss of 21.15 million yuan [6]. - The company has made progress in its securities fraud cases, with a court ruling requiring it to compensate investors [6]. - Investors who bought shares between August 28, 2020, and March 25, 2024, may still seek compensation [6].


油服工程板块11月4日跌0.78%,科力股份领跌,主力资金净流出1.47亿元
Zheng Xing Xing Ye Ri Bao· 2025-11-04 08:51
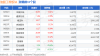
Core Insights - The oil service engineering sector experienced a decline of 0.78% on November 4, with Keli Co., Ltd. leading the drop [1] - The Shanghai Composite Index closed at 3960.19, down 0.41%, while the Shenzhen Component Index closed at 13175.22, down 1.71% [1] Market Performance - The following companies in the oil service engineering sector reported their closing prices and percentage changes: - Renji Co., Ltd. (002629): Closed at 8.77, up 0.80% [1] - China Oil Engineering (600339): Closed at 3.61, down 0.28% [1] - Bomei Co. (603727): Closed at 14.10, down 0.42% [1] - CNOOC Services (601808): Closed at 14.54, down 0.48% [1] - CNOOC Development (600968): Closed at 3.90, down 0.51% [1] - Huibo Yin (002554): Closed at 3.67, down 0.54% [1] - Beiken Energy (002828): Closed at 11.62, down 0.68% [1] - Haikou Lihuan (600583): Closed at 5.57, down 0.71% [1] - Zhun Oil Co. (002207): Closed at 8.22, down 1.08% [1] - Sinopec Oilfield Services (600871): Closed at 2.26, down 1.31% [1] Capital Flow - The oil service engineering sector saw a net outflow of 147 million yuan from institutional investors and 120 million yuan from speculative funds, while retail investors had a net inflow of 267 million yuan [2] - The capital flow for specific companies is as follows: - China Oil Engineering (600339): Net inflow of 30.57 million yuan from institutional investors [3] - CNOOC Development (600968): Net inflow of 8.39 million yuan from institutional investors [3] - Renji Co., Ltd. (002629): Net inflow of 7.18 million yuan from institutional investors [3] - Sinopec Oilfield Services (600871): Net outflow of 20.82 million yuan from institutional investors [3] - Zhongman Petroleum (603619): Net outflow of 25.07 million yuan from institutional investors [3]

油服工程板块11月3日涨1.98%,惠博普领涨,主力资金净流入2.86亿元
Zheng Xing Xing Ye Ri Bao· 2025-11-03 08:43
Core Insights - The oil service engineering sector experienced a rise of 1.98% on November 3, with Huibo Energy leading the gains [1] - The Shanghai Composite Index closed at 3976.52, up 0.55%, while the Shenzhen Component Index closed at 13404.06, up 0.19% [1] Stock Performance - Huibo Energy (002554) closed at 3.69, with a significant increase of 10.15% and a trading volume of 885,600 shares, amounting to 314 million yuan [1] - Tongyuan Petroleum (300164) saw a rise of 3.94%, closing at 6.07 with a trading volume of 1,109,500 shares [1] - Beiken Energy (002828) increased by 3.82%, closing at 11.70 with a trading volume of 255,600 shares [1] - Other notable performers include Zhongman Petroleum (619809) up 3.44%, Haiding Tian Station (600583) up 3.12%, and PetroChina Engineering (600339) up 1.69% [1] Capital Flow - The oil service engineering sector saw a net inflow of 286 million yuan from institutional investors, while retail investors experienced a net outflow of 136 million yuan [2][3] - Huibo Energy attracted a net inflow of 79.89 million yuan from institutional investors, while retail investors withdrew 44.58 million yuan [3] - Tongyuan Petroleum had a net inflow of 57.54 million yuan from institutional investors, with retail investors withdrawing 36.61 million yuan [3]

仁智股份龙虎榜数据(10月31日)
Zheng Quan Shi Bao Wang· 2025-10-31 14:59
Core Viewpoint - Renji Co., Ltd. experienced a significant decline of 8.31% in its stock price, with a trading volume of 8.32 billion yuan and a fluctuation of 21.67% on the day [1] Trading Activity - The stock had a turnover rate of 24.62%, indicating high trading activity [1] - Institutional investors net bought 13.15 million yuan, while brokerage seats collectively net bought 12.48 million yuan [1] - The stock was listed on the Shenzhen Stock Exchange due to its daily fluctuation reaching 21.67% [1] Institutional Participation - The top five trading departments accounted for a total transaction volume of 196 million yuan, with a buying amount of 111 million yuan and a selling amount of 85.24 million yuan, resulting in a net purchase of 25.63 million yuan [1] - Four institutional special seats were involved in the trading, with a total buying amount of 53.76 million yuan and a selling amount of 40.60 million yuan, leading to a net purchase of 13.15 million yuan [1] Fund Flow - The stock saw a net outflow of 60.84 million yuan from major funds, with a significant outflow of 37.36 million yuan from large orders and 23.48 million yuan from medium orders [1] - Over the past five days, the net outflow of major funds amounted to 41.83 million yuan [1]
油服工程板块10月31日跌0.68%,仁智股份领跌,主力资金净流出5885.64万元
Zheng Xing Xing Ye Ri Bao· 2025-10-31 08:48
Market Overview - The oil service engineering sector experienced a decline of 0.68% on October 31, with Renji Co. leading the drop [1] - The Shanghai Composite Index closed at 3954.79, down 0.81%, while the Shenzhen Component Index closed at 13378.21, down 1.14% [1] Stock Performance - Notable gainers in the oil service sector included: - Zhongman Petroleum (Code: 619809) with a closing price of 20.95, up 5.81% and a trading volume of 318,700 shares, totaling 665 million yuan [1] - Tongyuan Petroleum (Code: 300164) closed at 5.84, up 1.39% with a trading volume of 505,700 shares [1] - Conversely, Renji Co. (Code: 002629) saw a significant decline of 8.31%, closing at 8.61 with a trading volume of 891,800 shares, amounting to 832 million yuan [2] Capital Flow - The oil service sector saw a net outflow of 58.86 million yuan from institutional investors, while retail investors contributed a net inflow of 78.59 million yuan [2] - The capital flow for specific stocks indicated: - Zhongman Petroleum had a net inflow of 24.96 million yuan from institutional investors, while retail investors contributed a net inflow of 18.49 million yuan [3] - Renji Co. experienced a net outflow of 77.29 million yuan from institutional investors [3]
页岩气板块短线拉升
Mei Ri Jing Ji Xin Wen· 2025-10-31 02:28
Core Viewpoint - The shale gas sector experienced a short-term surge, with several companies seeing significant stock price increases, indicating a positive market sentiment towards this industry [1]. Group 1: Company Performance - Renji Co., Ltd. reached its daily limit up, indicating strong investor interest and confidence in its stock [1]. - Other companies that followed suit with stock price increases include Shenkai Co., Ltd., Deshi Co., Ltd., Petrochemical Machinery, Zhongyu Technology, and Litong Technology, reflecting a broader positive trend in the shale gas sector [1].
浙江仁智股份有限公司2025年第三季度报告
Shang Hai Zheng Quan Bao· 2025-10-30 22:43
Core Points - The company has ensured that the information disclosed is true, accurate, and complete, with no false records or misleading statements [1][2][12] - The third-quarter financial report has not been audited [3][7] - The company has announced the resignation of its securities affairs representative and appointed a new representative [8][19] Financial Data - The company reported that there are no adjustments or restatements needed for previous accounting data [3][4] - Non-recurring gains and losses include a tax refund of individual income tax [3] - The company has not classified any non-recurring gains and losses as recurring [3] Shareholder Information - The company disclosed that the controlling shareholder, Chen Zehong, applied for the release of restrictions on 67,347,567 shares, representing 15.8057% of the total share capital [5][6] - The release of these shares will be effective on October 20, 2025 [5] Board Meeting Resolutions - The board approved the third-quarter report with a unanimous vote [14][35] - The board also approved the reappointment of the auditing firm for the 2025 fiscal year, pending shareholder approval [15][36] - A second extraordinary general meeting for 2025 is scheduled for November 17, 2025 [21] Audit Firm Information - The company has proposed to continue with the auditing firm, Shanhui Certified Public Accountants, for the 2025 fiscal year [24][25] - The firm has a history of providing auditing services to various industries and has a significant number of registered accountants [26][27] - The firm has not faced any criminal penalties in the last three years, although it has received one administrative penalty [29]
仁智股份(002629.SZ)发布前三季度业绩,归母净亏损2115.12万元
智通财经网· 2025-10-30 11:48
Core Viewpoint - Renji Co., Ltd. reported a significant decline in revenue and net loss for the first three quarters of 2025, indicating potential challenges in its financial performance [1] Financial Performance - The company achieved an operating income of 68.54 million yuan, representing a year-on-year decrease of 47.95% [1] - The net loss attributable to shareholders of the listed company was 21.15 million yuan [1] - The net loss attributable to shareholders after deducting non-recurring gains and losses was 20.76 million yuan [1]
仁智股份(002629) - 关于变更公司证券事务代表的公告
2025-10-30 08:44
证券代码:002629 证券简称:仁智股份 公告编号:2025-041 浙江仁智股份有限公司 关于变更公司证券事务代表的公告 本公司及董事会全体成员保证信息披露内容的真实、准确和完整,没有虚 假记载、误导性陈述或重大遗漏。 证券事务代表陈珊女士联系方式如下: 联系地址:广东省深圳市福田区金田路 3088 号中洲大厦 24 层 2404 号 邮政编码:518000 电子邮箱:ofc_board@renzhi.cn 特此公告。 浙江仁智股份有限公司董事会 2025 年 10 月 31 日 浙江仁智股份有限公司(以下简称"公司")近日收到证券事务代表祝思颖 女士的辞职报告,因个人原因,祝思颖女士辞去公司证券事务代表职务,其辞职 报告自送达董事会之日起生效,祝思颖女士仍在公司担任其它职务。公司对祝思 颖女士在任职期间内为公司所作的贡献表示衷心感谢。 公司于 2025 年 10 月 30 日召开第七届董事会第二十一次会议,审议通过了 《关于变更公司证券事务代表的议案》,同意聘任陈珊女士担任公司证券事务代 表(简历见附件),协助董事会秘书开展工作,任期自本次董事会审议通过之日 起至第七届董事会届满之日止。 陈珊女士已经取 ...
仁智股份(002629) - 关于续聘2025年度审计机构的公告
2025-10-30 08:44
证券代码:002629 证券简称:仁智股份 公告编号:2025-040 浙江仁智股份有限公司 关于续聘2025年度审计机构的公告 本公司及董事会全体成员保证信息披露内容的真实、准确和完整,没有虚 假记载、误导性陈述或重大遗漏。 特别提示: (一)机构信息 1、基本信息 机构名称:上会会计师事务所(特殊普通合伙) 成立日期:2013年12月27日(系改制成立特殊普通合伙企业的成立日期) 组织形式:特殊普通合伙企业 注册地址:上海市静安区威海路755号25层 首席合伙人:张晓荣 截至2024年12月31日合伙人数量:112人 本次续聘会计师事务所符合财政部、国务院国资委、证监会印发的《国有企 业、上市公司选聘会计师事务所管理办法》(财会〔2023〕4 号)的规定。 浙江仁智股份有限公司(以下简称"公司"或"本公司")于 2025 年 10 月 30 日召开第七届董事会第二十一次会议,审议通过了《关于续聘 2025 年度审计机 构的议案》,同意续聘上会会计师事务所(特殊普通合伙) (以下简称"上会会计师 事务所")为公司 2025 年度审计机构,该议案尚需提交公司股东会审议。具体事 项如下: 一、拟续聘会计师事务所 ...