存货周转率
Search documents
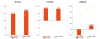
解析被动元件企业营运能力:分层明显 周转效率成竞争关键变量
Ju Chao Zi Xun· 2026-01-17 06:44
Core Insights - The operational capability is a critical reflection of asset management efficiency and an important dimension for measuring a company's core competitiveness in the semiconductor passive components industry [2] - There is a significant stratification in operational capabilities among 11 key listed companies in the A-share chip industry, with companies like Maijie Technology and Fenghua Advanced Technology demonstrating superior operational efficiency through effective inventory and accounts receivable management [2][5] - The differences in operational capabilities not only reflect internal management levels but are also closely related to downstream customer structures and product positioning, which will further impact cash flow health and market responsiveness [2][9] Operational Cycle - The operational cycle, which measures the efficiency from raw material procurement to revenue realization, shows a stark disparity among the 11 companies, indicating a "polarization" pattern [5] - Fenghua Advanced Technology leads with the shortest operational cycle of 174.44 days, followed closely by Maijie Technology at 179.30 days, and Taijing Technology at 208.38 days [5] - In contrast, Hongda Electronics has the longest operational cycle at 729.79 days, with Zhenhua Technology and Hongyuan Electronics also exceeding 500 days, indicating high asset occupation costs and significant operational efficiency pressures [5][6] Inventory Turnover Rate - The inventory turnover rate, a key indicator of inventory management efficiency, significantly affects capital occupation and market risk response capabilities [6] - Maijie Technology tops the industry with an inventory turnover rate of 4.37 times, followed by Fenghua Advanced Technology at 3.17 times and Shunluo Electronics at 2.95 times [6] - Conversely, Hongda Electronics has a low inventory turnover rate of only 0.64 times, with Zhenhua Technology and Hongyuan Electronics also below 1 time, indicating slow inventory turnover and high capital occupation pressure [6][9] Accounts Receivable Turnover Rate - The accounts receivable turnover rate directly relates to cash flow health, reflecting a company's bargaining power and collection management efficiency [7] - Sanhuan Group leads with an accounts receivable turnover rate of 3.33 times, indicating strong bargaining power and quick collection of sales proceeds [7] - In contrast, Hongda Electronics, Zhenhua Technology, and Hongyuan Electronics have low turnover rates of 0.87 times, 0.73 times, and 1.01 times respectively, suggesting prolonged collection periods [7] Asset Turnover Rates - The industry shows a "head concentration, tail lag" pattern in both current asset turnover and total asset turnover rates [8] - Shunluo Electronics leads in current asset turnover at 1.03 times, while Maijie Technology follows at 0.84 times, maximizing asset utilization efficiency [8] - Maijie Technology also leads in total asset turnover at 0.41 times, with Shunluo Electronics at 0.39 times, while companies like Canqin Technology and Dali Cap have the lowest at 0.19 times, indicating significant room for improvement in overall asset operational efficiency [8] Industry Analysis - The stratification in operational capabilities reflects a combination of customer structure, product positioning, and management levels [9] - Companies with a high proportion of military clients, such as Hongda Electronics and Zhenhua Technology, face longer operational cycles and slower accounts receivable turnover due to the procurement processes and payment mechanisms in the military industry [9] - In contrast, companies focusing on consumer electronics and automotive electronics, like Maijie Technology and Fenghua Advanced Technology, achieve higher operational efficiency through flexible market response mechanisms and effective internal management [9]


IPO雷达|中塑股份追溯调整三年财报,牵出补税旧账,多项合规问题受监管关切
Sou Hu Cai Jing· 2025-12-28 14:04
Core Viewpoint - The company, Guangdong Zhongsu New Materials Co., Ltd., is facing regulatory scrutiny due to declining product prices and retrospective adjustments to financial data over the past three years [1][7]. Financial Performance - The company's revenue for the years 2022 to 2025 (Q1) was approximately CNY 493 million, CNY 537 million, CNY 700 million, and CNY 152 million respectively, with net profits of CNY 51.92 million, CNY 79.24 million, CNY 100 million, and CNY 25.81 million [3][4]. - The gross profit margins for the same periods were 26%, 31.52%, 30.63%, and 33.20% respectively, indicating an overall improvement in profitability despite declining product prices [4]. Product Pricing Trends - The average selling price of high-performance engineering materials decreased from CNY 25,400 per ton in 2022 to CNY 18,700 per ton in 2023, while the price of specialty functional materials remained relatively stable [5]. - The company attributes the price decline of high-performance materials to fluctuations in upstream raw material prices and changes in product mix [5]. Customer Dynamics - The company’s largest customer, Yuyiao Ke, was noted to have fluctuated in its status as a top client, raising concerns about the stability and authenticity of sales [6]. - Sales to Yuyiao Ke dropped by 86.74% in 2024, and there were no transactions in the first quarter of 2025, attributed to changes in downstream demand and the customer's operational decisions [6]. Compliance and Financial Adjustments - The company is undergoing retrospective adjustments to its financial statements for 2022 to 2024, including changes to R&D expenses and operating costs, which have raised compliance concerns [8]. - The company reported a total of CNY 2.979 million in tax penalties due to prior year corrections, asserting that these issues do not indicate significant violations of regulations [8]. Internal Control and Operational Issues - The company has acknowledged issues with low inventory turnover rates, which were below industry averages, and a decline in capacity utilization rates from 84.01% in 2023 to 68.37% in 2025 [12][14]. - The company plans to address these operational challenges by introducing new clients in the automotive and energy storage sectors and gradually replacing existing production capacity with new investments [14].

华茂股份(000850.SZ):2025年三季报净利润为1.72亿元、同比较去年同期上涨12.84%
Xin Lang Cai Jing· 2025-10-31 01:56
Group 1 - The company's total operating revenue for Q3 2025 is 2.545 billion yuan, ranking 12th among disclosed peers, with an increase of 24.8478 million yuan compared to the same period last year, representing a year-on-year growth of 0.99% [1] - The net profit attributable to shareholders is 172 million yuan, ranking 11th among disclosed peers, with an increase of 19.529 million yuan compared to the same period last year, achieving a year-on-year growth of 12.84% [1] - The net cash flow from operating activities is 426 million yuan, ranking 9th among disclosed peers, with an increase of 302 million yuan compared to the same period last year, representing a year-on-year growth of 244.91% [1] Group 2 - The company's latest debt-to-asset ratio is 36.64%, a decrease of 0.48 percentage points from the previous quarter [3] - The latest gross profit margin is 10.76% [3] - The latest return on equity (ROE) is 3.77%, an increase of 0.27 percentage points compared to the same period last year [3] Group 3 - The diluted earnings per share are 0.19 yuan, an increase of 0.02 yuan compared to the same period last year, achieving a year-on-year growth of 13.25% [3] - The latest total asset turnover ratio is 0.35 times, remaining stable compared to the same period last year, with a year-on-year increase of 0.31 [3] - The latest inventory turnover ratio is 2.53 times, ranking 14th among disclosed peers [3] Group 4 - The number of shareholders is 30,700, with the top ten shareholders holding 479 million shares, accounting for 50.80% of the total share capital [3] - The largest shareholder is Anhui Huamao Group Co., Ltd., holding 46.41% of the shares [3]

国药一致(000028.SZ):2025年三季报净利润为9.57亿元、同比较去年同期下降10.18%
Xin Lang Cai Jing· 2025-10-31 01:56
Core Insights - The company reported a total revenue of 55.124 billion yuan for Q3 2025, ranking 4th among peers, with a year-on-year decrease of 2.38% [1] - The net profit attributable to shareholders was 0.957 billion yuan, ranking 6th among peers, reflecting a year-on-year decline of 10.18% [1] - The net cash flow from operating activities was -0.463 billion yuan, ranking 27th among peers, showing a significant year-on-year decrease of 136.15% [1] Financial Performance - The latest debt-to-asset ratio is 57.39%, ranking 13th among peers, with a decrease of 0.47 percentage points from the previous quarter and 0.96 percentage points from the same period last year [3] - The latest gross profit margin is 10.49%, ranking 20th among peers, down by 0.20 percentage points from the previous quarter and 0.39 percentage points year-on-year [3] - The latest return on equity (ROE) is 5.19%, ranking 14th among peers, with a decrease of 0.69 percentage points from the same period last year [3] Earnings and Ratios - The diluted earnings per share (EPS) is 1.72 yuan, ranking 2nd among peers, representing a year-on-year decrease of 9.95% [3] - The total asset turnover ratio is 1.12 times, ranking 6th among peers, with a slight decrease of 0.01 times year-on-year [3] - The inventory turnover ratio is 6.27 times, ranking 5th among peers, showing an increase of 1.99% year-on-year, marking three consecutive years of growth [3] Shareholder Structure - The number of shareholders is 41,400, with the top ten shareholders holding 345 million shares, accounting for 62.05% of the total share capital [3] - The largest shareholder is China National Pharmaceutical Group Co., Ltd., holding 56.06% of the shares [3]

滨化股份(601678.SH):2025年三季报净利润为1.92亿元
Xin Lang Cai Jing· 2025-10-31 01:56
Core Insights - The company reported a total revenue of 11.148 billion yuan and a net profit attributable to shareholders of 192 million yuan for Q3 2025 [1] - The net cash inflow from operating activities was 1.485 billion yuan [1] Financial Metrics - The latest debt-to-asset ratio is 52.37%, ranking 41st among disclosed peers, an increase of 3.34 percentage points year-on-year [3] - The latest gross profit margin is 10.24%, ranking 38th among disclosed peers, a decrease of 0.09 percentage points year-on-year [3] - The return on equity (ROE) is 1.68% [3] - The diluted earnings per share (EPS) is 0.10 yuan [3] - The total asset turnover ratio is 0.47 times [3] - The inventory turnover ratio is 7.18 times, a decrease of 2.31 times year-on-year, representing a decline of 24.32% [3] Shareholder Information - The number of shareholders is 76,400, with the top ten shareholders holding 554 million shares, accounting for 26.94% of the total share capital [3] - The top ten shareholders and their holdings are as follows: - Binzhou Heyi Industrial Investment Partnership (Limited Partnership): 9.76% - Zhang Zhongzheng: 5.82% - Binzhou Antai Holding Group Co., Ltd.: 2.06% - Shi Qinling: 1.98% - Yu Jiang: 1.77% - Tibet Shenzhoumu Fund Management Co., Ltd. - Shenzhoumu Quantum No. 1 Private Securities Investment Fund: 1.23% - Wang Liming: 1.17% - Hong Kong Central Clearing Limited: 1.14% - Binhua Group Co., Ltd. - First Employee Stock Ownership Plan: 1.11% - China Merchants Bank Co., Ltd. - Southern CSI 1000 ETF: 0.91% [3]

宏盛股份(603090.SH):2025年三季报净利润为6437.67万元
Xin Lang Cai Jing· 2025-10-31 01:56
Core Insights - Hongsheng Co., Ltd. (603090.SH) reported a total operating revenue of 554 million yuan for Q3 2025, ranking 139th among disclosed peers [1] - The net profit attributable to shareholders was 64.38 million yuan, with net cash inflow from operating activities at 77.53 million yuan, a decrease of 10.07 million yuan or 11.50% year-on-year [1][3] Financial Performance - The latest debt-to-asset ratio stands at 30.85%, an increase of 1.74 percentage points compared to the same period last year [3] - The gross profit margin is 25.50%, ranking 134th among disclosed peers, down 1.26 percentage points from the previous quarter and 1.76 percentage points year-on-year [3] - Return on equity (ROE) is reported at 10.50% [3] - The diluted earnings per share (EPS) is 0.64 yuan [3] - Total asset turnover ratio is 0.62 times, a decrease of 0.01 times year-on-year, reflecting a decline of 1.13% [3] - Inventory turnover ratio is recorded at 3.12 times [3] Shareholder Structure - The number of shareholders is 13,300, with the top ten shareholders holding a total of 60.01% of the total share capital, amounting to 60.01 million shares [3] - The largest shareholder is Niu Yuxia, holding 47.6% of the shares [3]

沃特股份(002886.SZ):2025年三季报净利润为3009.97万元
Xin Lang Cai Jing· 2025-10-31 01:40
Core Insights - The company reported a total revenue of 1.415 billion yuan for Q3 2025, with a net profit attributable to shareholders of 30.1 million yuan, ranking 50th among disclosed peers [1] - The company's latest debt-to-asset ratio is 51.46%, which is an increase of 1.97 percentage points compared to the same period last year, ranking 56th among peers [3] - The gross profit margin has decreased to 16.49%, down 1.42 percentage points year-on-year [3] - The return on equity (ROE) stands at 1.67%, ranking 53rd among disclosed peers [3] - The diluted earnings per share (EPS) is 0.11 yuan, ranking 47th among peers [4] - The total asset turnover ratio is 0.37 times, a decrease of 0.01 times year-on-year, ranking 45th among peers [4] - The inventory turnover ratio is 1.75 times, ranking 68th among peers [4] - The number of shareholders is 31,500, with the top ten shareholders holding 117 million shares, accounting for 44.51% of the total share capital [4] Shareholding Structure - The largest shareholder is Shenzhen Yinqiao Investment Co., Ltd., holding 13.92% [4] - The second-largest shareholder is Wu Xian, with a holding of 13.77% [4] - The third-largest shareholder is He Zheng, holding 13.34% [4]

圣阳股份(002580.SZ):2025年三季报净利润为1.60亿元、同比较去年同期下降3.70%
Xin Lang Cai Jing· 2025-10-31 01:40
Core Insights - The company reported a total revenue of 2.602 billion yuan for Q3 2025, marking a year-on-year increase of 15.43% and ranking 54th among peers [1] - The net profit attributable to shareholders was 160 million yuan, a decrease of 6.1521 million yuan compared to the same period last year, reflecting a decline of 3.70% [1] - The net cash inflow from operating activities was 11.1023 million yuan, an increase of 67.0087 million yuan year-on-year, achieving a consecutive increase for two years [1] Financial Ratios - The latest debt-to-asset ratio stands at 40.19%, which is an increase of 0.99 percentage points from the previous quarter and 4.87 percentage points from the same period last year, ranking 34th among peers [3] - The gross profit margin is reported at 18.10%, down 0.35 percentage points from the previous quarter and 0.98 percentage points year-on-year, ranking 42nd among peers [3] - The return on equity (ROE) is 6.88%, a decrease of 0.83 percentage points compared to the same period last year, ranking 20th among peers [3] Earnings Per Share and Turnover Ratios - The diluted earnings per share (EPS) is 0.35 yuan, a decrease of 0.02 yuan year-on-year, reflecting a decline of 5.41% and ranking 36th among peers [3] - The total asset turnover ratio is 0.68 times, an increase of 0.01 times year-on-year, showing a growth of 1.12% and ranking 9th among peers [3] - The inventory turnover ratio is 3.74 times, a decrease of 0.03 times year-on-year, reflecting a decline of 0.83% and ranking 36th among peers [3] Shareholder Information - The number of shareholders is 67,200, with the top ten shareholders holding 138 million shares, accounting for 30.31% of the total share capital [3] - The largest shareholder is Shandong Development Investment Holding Group Co., Ltd., holding 23.01% of the shares [3]
雅博股份(002323.SZ):2025年三季报净利润为-6031.41万元,同比亏损缩小
Xin Lang Cai Jing· 2025-10-31 01:37
Core Insights - The company reported a total revenue of 210 million yuan for Q3 2025, an increase of 21.66 million yuan or 11.49% compared to the same period last year [1] - The net profit attributable to shareholders was -60.31 million yuan, an increase of 3.67 million yuan compared to the same period last year [1] - The net cash inflow from operating activities was -5.42 million yuan, an increase of 135 million yuan compared to the same period last year [1] Financial Metrics - The latest debt-to-asset ratio is 63.63% [3] - The latest gross profit margin is 12.26%, an increase of 5.62 percentage points from the previous quarter [3] - The latest return on equity (ROE) is -17.25% [3] - The diluted earnings per share (EPS) is -0.03 yuan [3] - The total asset turnover ratio is 0.21 times, an increase of 0.05 times or 33.12% compared to the same period last year [3] - The inventory turnover ratio is 17.13 times, ranking 8th among disclosed peers, an increase of 7.10 times or 70.81% compared to the same period last year [3] Shareholder Information - The number of shareholders is 63,200, with the top ten shareholders holding 848 million shares, accounting for 39.97% of the total share capital [3] - The largest shareholder is Shandong Quanxing Technology Co., Ltd., holding 23.47% [3] - Other notable shareholders include Wuhan New Energy Industrial Development Co., Ltd. (4.48%) and Shiheng Special Steel Group Co., Ltd. (4.15%) [3]

澳洋健康(002172.SZ):2025年三季报净利润为4011.37万元
Xin Lang Cai Jing· 2025-10-31 01:37
Core Insights - The company reported a total revenue of 1.36 billion yuan for Q3 2025, a decrease of 141 million yuan compared to the same period last year, representing a year-on-year decline of 9.39% [1] - The net profit attributable to shareholders was 40.11 million yuan, ranking 26th among disclosed peers [1] - The company experienced a negative cash flow from operating activities amounting to -28.66 million yuan, ranking 45th among disclosed peers [1] Financial Metrics - The latest debt-to-asset ratio is 91.97%, ranking 51st among disclosed peers [3] - The gross profit margin is 14.27%, ranking 48th, with a decrease of 0.57 percentage points from the previous quarter [3] - The return on equity (ROE) is 22.97%, down 6.21 percentage points compared to the same period last year [3] - The diluted earnings per share (EPS) is 0.05 yuan, ranking 33rd among disclosed peers [3] - The total asset turnover ratio is 0.68 times, a decrease of 0.04 times year-on-year, representing a decline of 4.98% [3] - The inventory turnover ratio is 8.24 times [3] Shareholder Structure - The number of shareholders is 58,300, with the top ten shareholders holding a total of 276 million shares, accounting for 36.02% of the total share capital [3] - The largest shareholder is Aoyang Group Co., Ltd., holding 30.7% of the shares [3] - Other notable shareholders include Shen Qing (2.24%), Tui Jian (1.31%), and Li Anming (0.37%) [3]
