现金流状况
Search documents
山东黄金(600547)2025年三季报简析:营收净利润同比双双增长,盈利能力上升
Sou Hu Cai Jing· 2025-10-30 22:31
Core Viewpoint - Shandong Gold's Q3 2025 financial report shows significant growth in revenue and net profit, indicating improved profitability and operational efficiency [1]. Financial Performance - Total revenue for Q3 2025 reached 83.783 billion yuan, a year-on-year increase of 25.04% compared to 67.006 billion yuan in Q3 2024 [1]. - Net profit attributable to shareholders for Q3 2025 was 3.956 billion yuan, up 91.51% from 2.066 billion yuan in Q3 2024 [1]. - The gross profit margin improved to 18.01%, reflecting a year-on-year increase of 21.08% [1]. - The net profit margin rose to 6.47%, with a year-on-year increase of 30.93% [1]. - Total operating expenses (selling, administrative, and financial) amounted to 4.168 billion yuan, accounting for 4.97% of revenue, down 7.44% year-on-year [1]. Key Financial Metrics - Earnings per share (EPS) for Q3 2025 was 0.8 yuan, a significant increase of 105.13% from 0.39 yuan in Q3 2024 [1]. - Cash flow from operations per share was 3.3 yuan, up 44.65% year-on-year [1]. - The company's net asset value per share increased to 6.6 yuan, a rise of 21.68% compared to the previous year [1]. Market Position and Analyst Expectations - Analysts project the company's 2025 earnings to be around 6.759 billion yuan, with an average EPS forecast of 1.51 yuan [3]. - The company is held by notable fund managers, including Han Chuang from Dacheng Fund, who is recognized for his ability to identify growth stocks [3]. Fund Holdings - The largest fund holding Shandong Gold is the Yongying CSI Hong Kong and Shanghai Gold Industry ETF, with a scale of 11.669 billion yuan and a recent net value increase of 0.17% [4]. - Other funds have also increased their holdings in Shandong Gold, indicating positive sentiment in the market [4].


露笑科技(002617)2025年三季报简析:净利润同比增长5.17%,盈利能力上升
Sou Hu Cai Jing· 2025-10-29 22:40
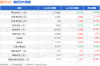
Core Insights - The company reported a total revenue of 2.761 billion yuan for Q3 2025, a slight decrease of 0.82% year-on-year, while the net profit attributable to shareholders increased by 5.17% to 246 million yuan [1] - In Q3 2025, the total revenue reached 1.009 billion yuan, reflecting a year-on-year increase of 13.99%, and the net profit attributable to shareholders surged by 78.57% to approximately 95.88 million yuan [1] - The company's profitability improved, with a gross margin increase of 1.68% to 21.98% and a net margin increase of 8.89% to 8.18% [1] Financial Performance - Total revenue for Q3 2025 was 2.761 billion yuan, compared to 2.784 billion yuan in Q3 2024, showing a decline of 0.82% [1] - Net profit attributable to shareholders for Q3 2025 was 246 million yuan, up from 234 million yuan in Q3 2024, marking a 5.17% increase [1] - The company reported a gross margin of 21.98% and a net margin of 8.18%, both showing improvements from the previous year [1] Cost and Expenses - Total selling, administrative, and financial expenses amounted to 228 million yuan, accounting for 8.26% of revenue, which is an 8.43% decrease year-on-year [1] - The company’s financial health is indicated by a significant increase in operating cash flow per share, which improved by 95.88% to -0.01 yuan [1] Asset and Liabilities - The company’s cash and cash equivalents decreased to 632 million yuan, down 4.23% from the previous year [1] - Accounts receivable increased by 24.18% to 2.56 billion yuan, indicating potential liquidity concerns [1] - Interest-bearing debt rose slightly by 1.37% to 2.98 billion yuan [1] Investment Returns - The company's return on invested capital (ROIC) was reported at 4.2%, with a historical median ROIC of 3.47% over the past decade, indicating weak investment returns [3] - The company has experienced three years of losses since its IPO, highlighting a fragile business model [3] Cash Flow and Financial Health - The cash flow situation is concerning, with cash and cash equivalents representing only 7.36% of total assets and 55.14% of current liabilities [4] - Financial expenses have reached 52.01% of the average operating cash flow over the past three years, indicating high financial burden [4] - Accounts receivable have reached 992.01% of profit, raising red flags about the company's collection efficiency [4]
比亚迪 (01211.HK):行业内卷下拖累卖车毛利逊预期
Xin Lang Cai Jing· 2025-09-02 07:02
Group 1 - The core viewpoint of the article highlights that BYD's gross margin has significantly declined due to intense price competition, leading to a continuous drop in per-vehicle profitability [3] - In response to industry challenges, the company has increased R&D and capital expenditures while providing additional incentives to dealers, resulting in heightened cost pressures and short-term profit constraints [3] - Although vehicle sales increased year-on-year in the first half of the year, there was a quarter-on-quarter decline in the second quarter, indicating intensified competition and difficulties in cost control [3] Group 2 - Looking ahead to the second half of the year, if the company can maintain steady sales growth and stabilize prices, it is expected to drive a recovery in per-vehicle profitability, with fixed cost pressures potentially easing as capacity utilization improves [3] - The company is actively promoting overseas capacity expansion and export growth, with new production bases in Thailand, Indonesia, and Brazil set to launch, which will enhance the proportion of overseas business and support long-term profit growth [3] - Despite facing short-term pressures from price wars and high investment impacting cash flow, the company's diversified business, technological leadership, and global market expansion are expected to help mitigate competitive risks [3]

前沿生物2025年中报简析:营收上升亏损收窄,盈利能力上升
Zheng Quan Zhi Xing· 2025-08-30 23:28
Financial Performance - The company reported total revenue of 58.64 million yuan for the first half of 2025, an increase of 14.85% year-on-year [1] - The net profit attributable to shareholders was -97.35 million yuan, showing a year-on-year improvement of 39.33% [1] - In Q2 2025, total revenue reached 30.31 million yuan, up 14.78% year-on-year, while the net profit attributable to shareholders was -53.23 million yuan, an increase of 49.18% year-on-year [1] Profitability Metrics - The gross margin for the reporting period was 30.99%, reflecting a year-on-year increase of 0.91% [1] - The net margin improved to -166.02%, a significant year-on-year increase of 47.18% [1] - Total selling, administrative, and financial expenses amounted to 69.20 million yuan, accounting for 118.01% of revenue, a decrease of 19.45% year-on-year [1] Key Financial Ratios - Earnings per share (EPS) improved to -0.26 yuan, a year-on-year increase of 39.53% [1] - The company’s net asset per share decreased to 2.79 yuan, down 11.69% year-on-year [1] - The operating cash flow per share was -0.26 yuan, a decrease of 10.13% year-on-year [1] Debt and Cash Flow Analysis - The company’s cash assets are considered healthy, but the average operating cash flow over the past three years is -72.77% of current liabilities [3] - The interest-bearing debt ratio reached 21.07%, indicating a concerning debt situation [3] - Historical data shows a median Return on Invested Capital (ROIC) of -12.89%, with the worst year being 2018 at -42.92% [3] Fund Holdings - The largest fund holding in the company is the Huatai-PineBridge Year-on-Year Stable Mixed A Fund, which holds 6,700 shares [4] - The fund's current scale is 0.86 billion yuan, with a recent net value of 1.2939 as of August 29, showing a 4.7% increase over the past year [4]

新泉股份2025年中报简析:营收净利润同比双双增长,应收账款上升
Zheng Quan Zhi Xing· 2025-08-30 23:27
Core Viewpoint - New Spring Co., Ltd. (603179) reported a strong performance in its 2025 mid-year financial results, with significant increases in revenue and net profit, although some profitability metrics showed declines [1]. Financial Performance - The total revenue for the first half of 2025 reached 7.459 billion yuan, a year-on-year increase of 21.01% compared to 6.164 billion yuan in 2024 [1]. - The net profit attributable to shareholders was 422 million yuan, up 2.8% from 411 million yuan in the previous year [1]. - In Q2 2025, total revenue was 3.94 billion yuan, reflecting a 26.41% year-on-year growth, while net profit for the quarter was 209 million yuan, an increase of 1.19% [1]. - The gross margin was 18.09%, down 4.76% year-on-year, and the net margin was 5.6%, down 15.46% [1]. - Total operating expenses (selling, administrative, and financial expenses) amounted to 501 million yuan, accounting for 6.72% of revenue, a slight decrease of 0.1% year-on-year [1]. Balance Sheet and Cash Flow - Accounts receivable increased significantly, with a year-on-year growth of 35.34%, reaching 4.113 billion yuan [1]. - Cash and cash equivalents decreased by 34.22%, totaling 2.6698 billion yuan [1]. - The company reported a significant decline in operating cash flow per share, which fell by 73.91% to 0.36 yuan [1]. - The company’s total interest-bearing debt rose by 24.4% to 3.135 billion yuan [1]. Investment Insights - The company's return on invested capital (ROIC) was 13.47%, indicating strong capital returns, while the historical median ROIC since its listing was 10.18% [3]. - Analysts expect the company's performance in 2025 to reach 1.206 billion yuan, with an average earnings per share forecast of 2.47 yuan [3]. - Notably, the company is held by two prominent fund managers, with increased positions in their portfolios [3][5]. Fund Management - The largest fund holding New Spring Co., Ltd. is the Quan Guo Xu Yuan Three-Year Holding Period Mixed A Fund, managed by Zhao Yi, which has a total scale of 11.201 billion yuan [5]. - The fund has shown a significant increase in value, with a 47.73% rise over the past year [5].

国轩高科2025年中报简析:营收净利润同比双双增长,短期债务压力上升
Zheng Quan Zhi Xing· 2025-08-30 23:27
Core Viewpoint - Guoxuan High-Tech (002074) reported a strong performance in its 2025 mid-year financial results, with significant increases in revenue and net profit compared to the previous year [1] Financial Performance - Total revenue reached 19.394 billion yuan, a year-on-year increase of 15.48% - Net profit attributable to shareholders was 367 million yuan, up 35.22% year-on-year - In Q2 alone, revenue was 10.338 billion yuan, reflecting an 11.33% increase year-on-year, while net profit for the quarter was 266 million yuan, up 31.68% year-on-year [1] - Gross margin stood at 16.42%, a slight decrease of 0.09% year-on-year, while net margin decreased by 7.95% to 1.71% [1] - Total operating expenses (selling, administrative, and financial expenses) amounted to 1.707 billion yuan, accounting for 8.8% of revenue, an increase of 15.68% year-on-year [1] Key Financial Ratios - Current ratio reached 0.88, indicating increased short-term debt pressure - Earnings per share (EPS) increased by 33.33% to 0.20 yuan, while operating cash flow per share rose significantly by 78.97% to 0.18 yuan [1] - The company's return on invested capital (ROIC) was reported at 2.98%, indicating weak capital returns historically [3] Cash Flow and Debt Analysis - The net cash flow from operating activities increased by 80.35%, attributed to higher collections [3] - The net increase in cash and cash equivalents decreased significantly by 158.83%, due to reduced cash flow from investment activities [3] - The company’s cash flow situation is concerning, with cash and cash equivalents to current liabilities at only 42.18% [4] Fund Holdings - The largest fund holding Guoxuan High-Tech is the Qianhai Kaiyuan Public Utilities Stock Fund, which has reduced its holdings [5] - Several funds have newly entered the top ten holdings of Guoxuan High-Tech, indicating growing interest in the company [5]

鼎胜新材2025年中报简析:营收净利润同比双双增长,公司应收账款体量较大
Zheng Quan Zhi Xing· 2025-08-30 23:27
Core Viewpoint - Ding Sheng New Materials (603876) reported a revenue increase of 15.94% year-on-year for the first half of 2025, reaching 13.314 billion yuan, while net profit rose by 2.33% to 188 million yuan [1] Financial Performance - Total revenue for Q2 2025 was 6.857 billion yuan, up 7.77% year-on-year, but net profit for the same quarter decreased by 33.0% to 103 million yuan [1] - The company's gross margin was 8.82%, down 10.16% year-on-year, and net margin was 1.43%, down 10.52% year-on-year [1] - Total operating expenses (selling, administrative, and financial) amounted to 255 million yuan, accounting for 1.92% of revenue, a decrease of 7.26% year-on-year [1] - Earnings per share remained stable at 0.21 yuan, while operating cash flow per share increased by 42.83% to 0.30 yuan [1] Balance Sheet Highlights - Accounts receivable increased by 19.16% year-on-year to 3.789 billion yuan, representing 1258.34% of the latest annual net profit [1][3] - Cash and cash equivalents decreased by 16.86% to 6.836 billion yuan [1] - Interest-bearing liabilities rose by 4.11% to 7.48 billion yuan, with a debt-to-asset ratio of 27.17% [3] Investment Insights - The company's return on invested capital (ROIC) was 2.73%, indicating weak capital returns, with a historical median ROIC of 5.74% since its IPO [1] - The company relies heavily on research and development for its business model, necessitating further investigation into the underlying drivers of this approach [2] Fund Holdings - The largest fund holding Ding Sheng New Materials is the China Merchants Quantitative Selected Stock A, which holds 6.6963 million shares and has seen a 73.66% increase over the past year [4]

智翔金泰2025年中报简析:营收上升亏损收窄,盈利能力上升
Zheng Quan Zhi Xing· 2025-08-30 23:27
Core Viewpoint - The financial performance of Zhixiang Jintai (688443) shows significant revenue growth but continues to report net losses, indicating potential challenges in profitability despite improvements in certain financial metrics [1][2]. Financial Performance Summary - Total revenue for the first half of 2025 reached 45.39 million yuan, a staggering increase of 358,429.65% year-on-year [1]. - The net profit attributable to shareholders was -289 million yuan, reflecting a year-on-year increase of 20.07% [1]. - In Q2 2025, total revenue was 25.24 million yuan, up 398,555.52% year-on-year, while the net profit attributable to shareholders was -169 million yuan, an increase of 14.94% year-on-year [1]. - Gross margin improved to 83.25%, a year-on-year increase of 27% [1]. - Net margin was reported at -637.31%, with a year-on-year increase of 99.98% [1]. - Total expenses (selling, administrative, and financial) amounted to 132 million yuan, accounting for 289.8% of revenue, a decrease of 99.95% year-on-year [1]. Cash Flow and Debt Analysis - The company has a healthy cash asset position, but the average operating cash flow over the past three years is -104.91% relative to current liabilities [2]. - The interest-bearing debt ratio has reached 30.43%, with the average operating cash flow over the past three years remaining negative [2]. Accounts Receivable and Inventory Concerns - The accounts receivable situation is concerning, with a significant increase in receivables year-on-year [3]. - Inventory levels are high, with inventory to revenue ratio at 203.01% [3]. Fund Holdings - The largest fund holding Zhixiang Jintai is the Dongfang Hong Medical Upgrade Stock Initiation A, with 2.45 million shares, which has seen a reduction in holdings [4]. - Other funds maintaining or increasing their positions include Penghua Healthcare Stock and Zhongyin Securities Health Industry Mixed Fund [4].

美埃科技2025年中报简析:营收净利润同比双双增长,应收账款上升
Zheng Quan Zhi Xing· 2025-08-30 23:26
Core Viewpoint - Meiye Technology (688376) reported a revenue increase of 23.51% year-on-year for the first half of 2025, reaching 935 million yuan, while net profit rose by 5.53% to 98.02 million yuan. However, the second quarter showed a decline in net profit by 2.42% despite a revenue increase of 27.73% [1]. Financial Performance - Total revenue for the first half of 2025 was 935 million yuan, up from 757 million yuan in the same period of 2024, marking a 23.51% increase [1]. - Net profit attributable to shareholders reached 98.02 million yuan, compared to 92.88 million yuan in 2024, reflecting a 5.53% increase [1]. - The gross profit margin decreased to 27.64%, down 6.64% year-on-year, while the net profit margin fell to 11.35%, a decrease of 6.85% [1]. - The total of selling, administrative, and financial expenses amounted to 122 million yuan, accounting for 13.04% of revenue, which is an increase of 6.82% year-on-year [1]. - Earnings per share increased to 0.73 yuan, up 5.8% from 0.69 yuan in 2024 [1]. Cash Flow and Debt Situation - Cash flow per share improved significantly to 0.52 yuan, a 181.81% increase from -0.64 yuan in the previous year [1]. - The company’s receivables rose significantly, with accounts receivable increasing by 52.7% to 1.222 billion yuan [1]. - The company’s interest-bearing liabilities surged by 103.83% to 1.159 billion yuan [1]. Investment Insights - The company's return on invested capital (ROIC) was reported at 8.24%, indicating average capital returns, with a historical median ROIC of 14.05% since its listing [3]. - The cash flow situation is concerning, with cash and cash equivalents covering only 79.06% of current liabilities, and the average operating cash flow over the past three years being negative [3]. - The debt situation is also a concern, with an interest-bearing asset-liability ratio of 27.42% and negative average operating cash flow over the past three years [3]. Fund Holdings - The largest fund holding Meiye Technology is the Huaxia Value Selection Mixed Fund, which increased its holdings to 1.1419 million shares [4]. - Other funds, such as the Green High Dividend Preferred Mixed Fund A and Huaxia Xingxia Value One-Year Holding Mixed Fund, also increased their positions in the company [4].

德联集团2025年中报简析:营收净利润同比双双增长,公司应收账款体量较大
Zheng Quan Zhi Xing· 2025-08-30 23:26
Financial Performance - The company reported a total revenue of 2.596 billion yuan for the first half of 2025, representing a year-on-year increase of 17.23% [1] - The net profit attributable to shareholders reached 59.36 million yuan, up 17.68% year-on-year [1] - In Q2 2025, total revenue was 1.509 billion yuan, with a year-on-year growth of 22.15%, and net profit was 31.39 million yuan, increasing by 10.63% [1] Key Financial Ratios - Gross margin decreased to 12.37%, down 14.71% year-on-year, while net margin slightly declined to 2.23%, a decrease of 0.83% [1] - The total of selling, administrative, and financial expenses was 193 million yuan, accounting for 7.43% of revenue, which is a reduction of 13.15% year-on-year [1] - Earnings per share rose to 0.08 yuan, reflecting a 14.29% increase, and operating cash flow per share improved to 0.32 yuan, up 16.4% [1] Balance Sheet Highlights - The company’s accounts receivable amounted to 749 million yuan, down 12.71% from the previous year, but the accounts receivable to net profit ratio reached 1088.37% [1][2] - Cash and cash equivalents increased significantly to 266.56 million yuan, a rise of 65.69% year-on-year [1] - Interest-bearing debt slightly decreased to 992.66 million yuan, a reduction of 0.83% [1] Investment Insights - The company's return on invested capital (ROIC) was reported at 2.06%, indicating weak capital returns, with a historical median ROIC of 5.1% over the past decade [1] - The company relies heavily on research and marketing for its performance, necessitating a closer examination of these drivers [2] - The largest fund holding the company’s shares is the Huaxia Panyi One-Year Open Mixed Fund, which has reduced its holdings [3]
