二手房交易
Search documents
上海一小区多套房挂牌价格一致,有业主组建二手房“挂牌价同盟”?相关中介门店回应
第一财经· 2025-11-21 13:12
Core Viewpoint - The article discusses the phenomenon of multiple similar-priced listings for residential properties in the "Century Jiangwan" community in Shanghai's Xinjiangwan City area, suggesting a potential coordinated pricing strategy among homeowners, although real estate agents indicate that this is not the case [3][7]. Group 1: Pricing Trends - Several listings for 93 square meter apartments in the Century Jiangwan community are priced closely, with four units listed at 14.6 million yuan and one at 14.7 million yuan [3][10]. - The average listing price for the community in October was 157,400 yuan per square meter, while the average transaction price in September was 135,100 yuan per square meter [10]. Group 2: Market Activity - Real estate agents reported an increase in transaction activity, with their store closing deals for one unit each in September and October, indicating an improvement compared to earlier in the year [11]. - The average number of property viewings per agent has risen to 3-5 groups per person per week, showing a significant increase since the "8.25 new policy" was implemented [11].


美国10月二手房销售小幅回升 抵押贷款利率回落助推成交 但复苏或难持续
智通财经网· 2025-11-20 22:26
Core Insights - October's existing home sales in the U.S. showed improvement due to a temporary decline in mortgage rates, but analysts warn that this recovery may not be sustainable [1] - The National Association of Realtors (NAR) reported that seasonally adjusted annualized sales reached 4.1 million units in October, reflecting a month-over-month increase of 1.2% and a year-over-year increase of 1.7% [1] Sales and Inventory - The inventory of homes for sale decreased to 1.52 million units in October, down 0.7% month-over-month, but still nearly 11% higher than the same period last year [1] - The current sales pace indicates a market inventory of only 4.4 months, suggesting a tight supply [1] Pricing Trends - The median price of existing homes in the U.S. reached $415,200 in October, marking a year-over-year increase of 2.1%, continuing a streak of 28 consecutive months of year-over-year price increases [1] Buyer Dynamics - Danielle Hale, Chief Economist at Realtor.com, noted that while mortgage rates have decreased and seasonal competition has lessened, housing affordability remains a core issue limiting the rebound in transaction volumes [2] - The average time homes spent on the market increased to 34 days in October, compared to 29 days in the same month last year [2] First-Time Homebuyers - The proportion of first-time homebuyers improved to 32%, up from 27% year-over-year, although regional disparities exist [2] - Lawrence Yun, NAR's Chief Economist, indicated that first-time buyers in the Northeast face the greatest challenges due to supply shortages, while the Midwest shows stronger performance due to more affordable prices and adequate supply [2] Market Segmentation - The recovery in the housing market is characterized by a "luxury-led" structure, with sales of homes priced over $1 million increasing by over 16% year-over-year, while homes priced below $100,000 saw a nearly 3% decline [2]
二手挂牌 | 10月京沪深新增挂牌量同环比双降
克而瑞地产研究· 2025-11-18 09:43
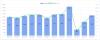
Core Viewpoint - The overall second-hand housing market transaction scale is expected to continue its fluctuating trend, with a gradual decline in transactions observed in October 2025 [2][12]. Market Transaction Trends - In October 2025, the transaction volume of second-hand houses in 30 key cities decreased by 11% month-on-month and 23% year-on-year, with a cumulative year-on-year growth narrowing to 6% [2]. - The new listing volume in key cities such as Beijing, Shanghai, and Shenzhen showed a consistent decline, with Shenzhen experiencing a year-on-year drop of 35% [4][12]. Listing Volume Analysis - The total new listings in Beijing, Shanghai, Shenzhen, and Hangzhou decreased by 9% month-on-month and 20% year-on-year in October [4]. - Specific data for October 2025 shows: - Beijing: 15,602 listings (-15% MoM, -20% YoY) - Shanghai: 14,612 listings (-4% MoM, -10% YoY) - Shenzhen: 5,521 listings (-17% MoM, -35% YoY) - Hangzhou: 6,402 listings (+6% MoM, -26% YoY) [6]. Price Segment Insights - In terms of price segments, there is an increase in the proportion of listings priced below 5 million and 30 million in Beijing, Shanghai, Shenzhen, and Hangzhou, while the proportion of listings priced between 5 million and 30 million has decreased [6]. - The listing activity for properties priced below 1 million has increased, indicating a growing willingness among owners to sell in the lower price segment [6][12]. Area Segment Insights - The new listing volume by area shows varied trends across the four cities: - Beijing and Hangzhou saw increases in listings for properties sized 50-70 square meters and 120-160 square meters, while Shanghai saw significant increases in listings for properties under 90 square meters [10][11]. - In Shenzhen, the increase in listings was more dispersed across various size segments, reflecting the overall price segment performance [10]. Future Market Outlook - The second-hand housing market is expected to maintain a fluctuating transaction scale due to prolonged transaction cycles and relatively high levels of listing inventory [12]. - The continuous decline in second-hand housing prices since the third quarter has diminished their stimulating effect on transaction volumes, particularly for first-time buyers, leading to an increase in market observation sentiment [12].

10月杭州成交了5934套二手房
Mei Ri Shang Bao· 2025-11-05 22:27
Core Insights - The real estate market in Hangzhou has experienced a significant decline in second-hand housing transactions, with October seeing a total of 5,934 units sold, a 6.9% decrease from September and marking the lowest monthly sales since March [1] - Year-on-year comparisons show a more than 30% drop in transaction volume compared to October of the previous year, highlighting a lack of buyer confidence and a prevalent wait-and-see attitude among potential purchasers [1] - The average transaction price for second-hand residential properties in October was 26,773 yuan per square meter, reflecting a 0.2% decrease from September and a substantial 9.0% drop from the same month last year [1] Market Trends - The decline in prices is widespread, with over 70% of neighborhoods experiencing price drops exceeding 20%, and 40% of neighborhoods seeing declines over 30% compared to market peaks [1][2] - Non-core areas such as Linping, southern Xiaoshan, and Qiantang have shown particularly pronounced price corrections, with average declines of over 20% [2] - In contrast, core improvement areas like Aoti and Shinfang have seen more moderate price reductions, with recent price trends stabilizing [2] Transaction Structure - Smaller, lower-priced properties continue to dominate the market, with the proportion of transactions for units of 90 square meters or less increasing by 0.9% compared to September [2] - The share of properties priced between 2 million and 3 million yuan has risen by 1.1%, while the share of properties priced at 8 million yuan and above has increased by 0.6% [2] Top Transactions - The top-selling property in October was the Jiangxiangyunlu in southern Xiaoshan, which sold 33 units at an average price of 16,477 yuan per square meter, marking a 14% increase in sales volume from the previous month [3] - The Fengshouhu Jiayuan, another notable property, saw a remarkable 333% increase in sales volume, with 13 units sold at an average price of 15,689 yuan per square meter [4] - The transaction rankings indicate a strong presence of affordable housing projects, with 13 out of the top 20 properties sold in October priced below 30,000 yuan per square meter [2][5]
你家是涨是跌?下沙近30日二手房成交数据出炉!下沙多个小区成交均价“1字头”
Sou Hu Cai Jing· 2025-11-04 10:48
Market Overview - The second-hand housing market in Hangzhou remains weak in October, with transaction volume, prices, and market sentiment all in a downward trend [1] - Approximately 5,900 second-hand homes were sold in the Hangzhou urban area in October, a decrease of 7.5% from September's 6,377 units and a 35.3% drop from 9,120 units in October of the previous year [1] Transaction Trends - The market has experienced a continuous decline in transaction volume for seven consecutive months since the end of the "small spring" in March [1] - In contrast to last year, when favorable policies stimulated market sentiment and led to a rebound in transaction volume, this year has seen a persistent downturn [1] Price Dynamics - The average transaction prices are also hitting new lows, particularly in older neighborhoods where prices have dropped over 40% from their peak in 2021, with a year-on-year decline of 5-10% [1] - Non-core areas like Linping, southern Xiaoshan, and Xiasha have seen prices fall by more than 30% compared to their peak [1] Buyer Behavior - The current market demand is heavily concentrated on low-priced properties, with homes priced below 2 million yuan becoming the mainstay of transactions [2] - This trend has been strengthening since the beginning of the year, indicating a structural shift in buyer preferences towards price-sensitive first-time homebuyers [2]

杭州二手房:10月网签量降、均价降,同比降幅大
Sou Hu Cai Jing· 2025-11-04 06:51
Core Insights - In October 2023, the second-hand housing transaction volume in Hangzhou decreased both in quantity and price, indicating a continued downward trend in the market [1] Group 1: Transaction Volume - The number of second-hand housing transactions in Hangzhou was 5,934 units in October, representing a month-on-month decline of 6.9% and a year-on-year decline of 35% [1] - This marks the seventh consecutive month of declining transaction volume, contrasting sharply with the rebound seen in October of the previous year [1] Group 2: Price Trends - The average transaction price for second-hand residential properties in Hangzhou was 26,773 yuan per square meter in October, reflecting a month-on-month decrease of 0.2% and a year-on-year decrease of 9% [1]
京沪二手房成交环比涨幅均超46%
3 6 Ke· 2025-10-28 02:13
Market Analysis - The Beijing second-hand housing market has shown significant fluctuations, with a recent weekly transaction of 3,262 units, a week-on-week increase of 46.5%, but still down 12.6% compared to mid-September [4][5] - The Shanghai second-hand housing market has experienced a notable recovery, with transactions reaching 6,588 units during the week of October 20-26, marking a 47.6% increase week-on-week, the highest in six weeks [8][10] - The Shenzhen second-hand housing market has also shown a rebound, with transactions of 1,182 units, up 21% week-on-week, continuing a trend of recovery after a significant drop during the National Day holiday [13][15] - The Hangzhou second-hand housing market has seen a moderate recovery, with 1,284 units sold, a 5% increase week-on-week, indicating a return to normal transaction levels [18][20] - The Chengdu second-hand housing market has shown significant volatility, with transactions of 4,213 units, a week-on-week increase of 36.2%, recovering from a sharp decline during the holiday [23][25] - The Ningbo second-hand housing market has experienced a notable rebound, with 2,776 units sold, a 21.1% increase week-on-week, indicating a recovery from previous low transaction levels [28][30] - The Dongguan second-hand housing market has shown a significant recovery, with transactions of 845 units, a 61.3% increase week-on-week, reflecting a strong rebound after a low point during the holiday [33][35]
别再降价了!二手房快速成交的3个隐藏逻辑与5个实操技巧
Sou Hu Cai Jing· 2025-10-24 04:08
Core Insights - The real estate market is entering a new cycle with a significant increase in second-hand housing listings, necessitating a fresh strategy for sellers to successfully sell their properties [1] Group 1: Pricing Strategies - Many sellers mistakenly pursue the "highest price" based on historical sales, leading to prolonged listings without interest. A more effective approach is the "gradient pricing method," where properties are listed at about 5% below market value to attract initial buyers, potentially resulting in multiple offers within 1-2 weeks and a final sale price exceeding expectations [3] Group 2: Buyer Experience - The younger generation, particularly Gen Z, is becoming the primary force in home buying, with 90% of buyers utilizing VR tours and short videos to filter listings. Investing a budget of around a thousand yuan for professional immersive video tours can significantly increase inquiries, with such listings averaging three times more interest than standard ones [4] Group 3: Agency Collaboration - The traditional model of listing with multiple agencies often leads to price competition among agents. A more effective strategy is the "exclusive commission + bonus" model, where sellers sign short-term exclusive agreements with top agencies and set a sales target slightly above market price, incentivizing agents with bonuses for achieving these goals [5] Group 4: Creating Scarcity - Sellers can create a sense of urgency by scheduling viewings during peak times, using phrases like "owner has already secured a new home" or "only accepting buyers who can sign within a week" in listings, and strategically revealing competing offers to interested buyers [7] Group 5: Legal Value Additions - Organizing essential documents such as renovation contracts, property payment records, and school district eligibility can significantly reduce buyer decision-making time. Properties with complete documentation see an average sales cycle reduction of 40% [7] Group 6: Innovative Selling Trends - Some sellers are experimenting with virtual open houses on VR platforms, allowing overseas buyers to view properties remotely. While still niche, this innovative approach can generate buzz and enhance the property's marketability [8] - The second-hand housing market has shifted from a focus on location to a comprehensive value comparison, with successful sellers treating the selling process as a targeted marketing campaign. The key to quick sales lies not in price reduction but in redefining the property's value presentation [8]

美国9月成屋销售环比升1.5% 库存触及近五年高位
Zhi Tong Cai Jing· 2025-10-23 15:47
Core Insights - The National Association of Realtors (NAR) reported a 1.5% month-over-month increase in existing home sales for September, with an annualized sales pace of 4.06 million units, driven by a decline in mortgage rates and improved housing affordability [1][2] - Inventory levels have returned to near five-year highs, with approximately 1.55 million homes for sale, a 1.3% increase from August and a 14% increase year-over-year, although still below pre-pandemic levels [1][2] - The median sales price for existing homes rose to $415,200, marking a 2.1% year-over-year increase and the 27th consecutive month of price growth [1][2] Sales by Property Type - Detached home sales were annualized at 3.69 million units, up 1.7% month-over-month and 4.5% year-over-year, with a median price of $420,700, reflecting a 2.3% increase [2] - Condominium and co-op sales remained stable at an annualized rate of 370,000 units, with a median price of $360,300, showing a slight decline of 0.6% year-over-year [2] Regional Performance - The Northeast region saw annualized sales of 490,000 units, a 2.1% increase month-over-month and a 4.3% increase year-over-year, with a median price of $500,300, up 4.1% [2] - The Midwest experienced a decline in sales to 940,000 units, down 2.1% month-over-month but up 2.2% year-over-year, with a median price of $320,800, reflecting a 4.7% increase [2] - The South reported annualized sales of 1.86 million units, a 1.6% increase month-over-month and a 6.9% increase year-over-year, with a median price of $364,500, up 1.2% [2] - The West region had annualized sales of 770,000 units, a significant 5.5% increase month-over-month but flat year-over-year, with a median price of $619,100, showing a slight increase of 0.4% [2] Market Dynamics - The median time from listing to sale increased to 33 days, up from 31 days last month and 28 days last year [2] - First-time homebuyers accounted for 30% of sales, up from 28% in July and 26% year-over-year, while cash transactions rose to 30% [2] - The share of investors and second-home buyers decreased to 15%, down from 21% last month and 16% year-over-year [2] Financing Conditions - The average 30-year fixed mortgage rate was 6.35% in September, down from 6.59% in August but higher than 6.18% a year ago, which may support sales momentum in the fourth quarter [3]
揭秘:低于市场价30%的二手房,背后藏着这些猫腻
Sou Hu Cai Jing· 2025-10-23 09:26
Core Insights - The current second-hand housing market is characterized as a "price battlefield," with numerous low-priced listings attracting first-time buyers, but many of these properties carry hidden risks [1] Group 1: Foreclosure Properties - Foreclosure properties are often priced about 30% below market value, making them attractive to buyers, but they come with significant risks, including difficulties in evicting previous owners [3] - Buyers should conduct thorough background checks on previous owners, inspect the actual occupancy of the property, reserve 10-15% of the budget for potential eviction costs, and consider hiring professional auction agencies for due diligence [3] Group 2: Renovated Properties - "Renovated properties" are often old homes that have been cheaply refurbished with substandard materials, leading to potential health hazards such as excessive formaldehyde levels and poor construction quality [4] - Buyers can identify these properties by checking for strong odors, inspecting electrical systems, and using professional equipment to test for formaldehyde before signing contracts [4] Group 3: Urgent Sale Properties - Properties marketed as "urgent sales" at prices significantly below market value may hide serious issues, such as impending foreclosure or being classified as "haunted" due to past tragedies [5] - To mitigate risks, buyers should consult neighbors, verify property status at real estate registration centers, include clauses in contracts to ensure the property is not a "haunted house," and conduct nighttime inspections of the neighborhood [5]
