SHENHUO COAL&POWER(000933)
Search documents
神火股份股价跌5.08%,中欧基金旗下1只基金重仓,持有2.85万股浮亏损失3.56万元
Xin Lang Cai Jing· 2025-10-28 06:00
Core Viewpoint - Shenhuo Co., Ltd. experienced a 5.08% decline in stock price, closing at 23.34 CNY per share, with a trading volume of 988 million CNY and a turnover rate of 1.83%, resulting in a total market capitalization of 52.5 billion CNY [1] Company Overview - Shenhuo Co., Ltd. is located in Yongcheng, Henan Province, and was established on August 31, 1998, with its listing date on August 31, 1999. The company primarily engages in the production, processing, and sales of aluminum products and coal, as well as power generation and supply [1] - The revenue composition of Shenhuo Co., Ltd. is as follows: electrolytic aluminum 69.40%, coal 14.11%, aluminum foil 6.41%, aluminum foil raw materials 4.44%, trading 3.82%, other businesses 1.73%, transportation 0.05%, anode carbon blocks 0.03%, and type coke 0.03% [1] Fund Holdings - According to data, one fund under China Europe Fund has a significant holding in Shenhuo Co., Ltd. The fund, China Europe Kangyu Mixed A (004442), held 28,500 shares in the second quarter, unchanged from the previous period, accounting for 0.96% of the fund's net value, making it the fourth-largest holding [2] - The estimated floating loss for the fund today is approximately 35,600 CNY [2] Fund Manager Information - The fund manager of China Europe Kangyu Mixed A (004442) is Huang Hua and Li Bo. As of the report, Huang Hua has a cumulative tenure of 8 years and 221 days, with the fund's total asset size at 7.318 billion CNY and a best return of 48.07% during his tenure [3] - Li Bo has a cumulative tenure of 1 year and 354 days, with the fund's total asset size at 9.883 billion CNY and a best return of 42.22% during his tenure [3]
河南神火高质量产业投资发展合伙企业成立
Zheng Quan Shi Bao Wang· 2025-10-28 04:49
Group 1 - The establishment of Henan Shenhuo High-Quality Industry Investment Development Partnership (Limited Partnership) with a capital contribution of 1.512 billion yuan [1] - The business scope includes private equity investment, investment management, and asset management activities [1] - The company is jointly held by Shenhuo Co., Ltd. (000933) and Henan Asset Management Co., Ltd. among others [1]
神火股份等成立高质量产业投资发展合伙企业
2 1 Shi Ji Jing Ji Bao Dao· 2025-10-28 02:39
Core Insights - A new investment partnership named Henan Shenhuo High-Quality Industry Investment Development Partnership (Limited Partnership) has been established with a capital contribution of 1.512 billion RMB [1] - The partnership is managed by Anhui Jiangkong Chuangfu Private Equity Fund Management Co., Ltd., focusing on private equity investment, investment management, and asset management activities [1] - Key partners include Shenhuo Co., Ltd., Henan Asset Management Co., Ltd., Anhui Jiangkong Chuangfu Private Equity Fund Management Co., Ltd., and Henan Asset Fund Management Co., Ltd. [1] Partner Information - Shenhuo Co., Ltd. holds a significant stake of 79.3651% in the partnership [3] - Henan Asset Management Co., Ltd. has a 19.8413% stake and is state-controlled [3] - Anhui Jiangkong Chuangfu Private Equity Fund Management Co., Ltd. and Henan Asset Fund Management Co., Ltd. hold smaller stakes of 0.6614% and 0.1323%, respectively [3]


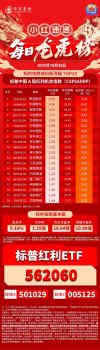
小红日报|常宝股份领涨,标普红利ETF(562060)标的指数收涨0.35%
Xin Lang Ji Jin· 2025-10-28 02:24
Core Insights - The article highlights the top-performing stocks in the S&P China A-Share Dividend Opportunity Index, showcasing significant daily and year-to-date gains along with dividend yields [1] Group 1: Stock Performance - 常宝股份 (002478.SZ) leads with a daily increase of 9.95% and a year-to-date gain of 32.86%, with a dividend yield of 3.24% [1] - 宇通客车 (600066.SH) shows a daily rise of 4.56% and a year-to-date increase of 25.01%, with a dividend yield of 6.41% [1] - 海容冷链 (603187.SH) has a daily gain of 4.31% and a year-to-date performance of 42.24%, with a dividend yield of 3.25% [1] - 中创智领 (601717.SH) exhibits a remarkable year-to-date increase of 106.18%, with a daily rise of 3.77% and a dividend yield of 4.47% [1] - 岱美股份 (603730.SH) reports a daily increase of 2.99% and a year-to-date gain of 14.45%, with a dividend yield of 3.56% [1] Group 2: Dividend Yields - 农业银行 (601288.SH) has a year-to-date increase of 60.07% and a dividend yield of 2.96%, with a daily rise of 2.38% [1] - 浙能电力 (600023.SH) shows a slight year-to-date decline of -0.33% but offers a high dividend yield of 6.42% with a daily increase of 2.32% [1] - 神火股份 (000933.SZ) has a year-to-date gain of 49.82% and a dividend yield of 3.24%, with a daily rise of 2.25% [1] - 友发集团 (601686.SH) reports a year-to-date increase of 36.89% and a dividend yield of 4.07%, with a daily rise of 2.16% [1]
神火股份等成立高质量产业投资发展合伙企业,出资额15.12亿
Xin Lang Cai Jing· 2025-10-28 01:47
Core Insights - A new investment partnership named Henan Shenhuo High-Quality Industry Investment Development Partnership (Limited Partnership) has been established, with a total investment of 1.512 billion RMB [1] Group 1: Company Formation - The executing partner is Anhui Jiangkong Chuangfu Private Fund Management Co., Ltd. [1] - The partnership's business scope includes private equity investment, investment management, asset management, and venture capital activities [1] Group 2: Investment Structure - The partnership is jointly funded by Shenhuo Co., Ltd., Henan Asset Management Co., Ltd., Anhui Jiangkong Chuangfu Private Fund Management Co., Ltd., and Henan Asset Fund Management Co., Ltd. [1]
神火股份(000933) - 河南神火煤电股份有限公司2025年第二次临时股东大会决议公告
2025-10-27 12:07
证券代码:000933 证券简称:神火股份 公告编号:2025-070 特别提示: 1、本次股东大会未出现增加、修改、否决议案的情形。 2、本次股东大会不涉及变更以往股东大会已通过的决议。 一、会议召开和出席情况 1、会议召开情况 (1)现场会议召开时间为:2025 年 10 月 27 日(星期一)15:00 网络投票时间为:通过深圳证券交易所交易系统进行网络投票的 具体时间为:2025 年 10 月 27 日 9:15-9:25、9:30-11:30、13:00-15:00; 通过深圳证券交易所互联网投票系统投票的具体时间为:2025 年 10 月 27 日 9:15-15:00。 (2)召开地点:河南省永城市东城区东环路北段 369 号公司本 部 2 号楼九楼第二会议室 (3)召开方式:现场投票与网络投票相结合 (4)召集人:公司董事会 河南神火煤电股份有限公司 2025 年第二次临时股东大会决议公告 本公司及董事会全体成员保证信息披露的内容真实、准确和完整,没有虚假记载、误 导性陈述或重大遗漏。 (5)主持人:董事长李宏伟先生 本次股东大会的召开程序符合有关法律、行政法规、部门规章、 规范性文件、深圳证 ...
神火股份(000933) - 河南亚太人律师事务所关于河南神火煤电股份有限公司2025年第二次临时股东大会的法律意见书
2025-10-27 12:04
河南亚太人律师事务所 关于河南神火煤电股份有限公司 2025 年第二次临时股东大会的 法 律 意 见 书 亚律法字(2025)第 1027 号 二零二五年十月二十七日 河南亚太人律师事务所 2、本所律师仅对本次股东大会的召集程序、召开程序、出席会议人员资格、 召集人资格、表决程序及表决结果(以下简称"股东大会相关事项")发表法律意 见。本所律师同意将本法律意见书作为本次大会其他信息披露资料一并公告。 关于河南神火煤电股份有限公司 2025 年第二次临时股东大会的 法 律 意 见 书 致:河南神火煤电股份有限公司 根据《中华人民共和国证券法》(以下简称《证券法》)、《中华人民共和国 公司法》(以下简称《公司法》)、《律师事务所从事证券法律业务管理办法》、 《律师事务所证券法律业务执行规则(试行)》等法律、法规、其他有关规范性文 件的要求和《河南神火煤电股份有限公司公司章程》(以下简称《公司章程》)的 规定,河南亚太人律师事务所(以下简称"本所")接受河南神火煤电股份有限公 司(以下简称"公司")的委托,指派鲁鸿贵、杨学林律师(以下简称"本所律 师")参加公司 2025 年第二次临时股东大会(以下简称"本次股东大 ...
铝行业周报:宏观利好,去库延续,铝价突破21000元/吨-20251026
Guohai Securities· 2025-10-26 13:03
Investment Rating - The report maintains a "Recommended" rating for the aluminum industry [1] Core Views - The macroeconomic environment is favorable, with continued destocking trends and aluminum prices breaking through 21,000 RMB/ton [1][8] - The demand for aluminum is expected to remain stable, supported by ongoing economic growth and a favorable policy environment [13] - The aluminum industry is projected to maintain high prosperity due to limited supply growth and potential demand increases [13] Summary by Sections 1. Prices - As of October 24, the LME three-month aluminum closing price was 2,856.5 USD/ton, up 315.0 RMB/ton week-on-week, a 1.5% increase [17] - The Shanghai aluminum active contract closed at 21,225.0 RMB/ton, reflecting a week-on-week increase of 315.0 RMB/ton [23] 2. Production - In September 2025, the electrolytic aluminum production was 3.615 million tons, a decrease of 11.8 thousand tons month-on-month [55] - The alumina production for the same month was 7.604 million tons, down 13.5 thousand tons month-on-month [55] 3. Inventory - As of October 23, the national aluminum ingot inventory was recorded at 618,000 tons, with a week-on-week decrease of 9,000 tons [9] - The domestic aluminum rod inventory increased to 145,000 tons, with a week-on-week decrease of 3,000 tons [9] 4. Key Companies and Earnings Forecast - China Hongqiao (1378.HK) is rated "Buy" with an EPS forecast of 2.65 RMB for 2025 [7] - Tianshan Aluminum (002532.SZ) is also rated "Buy" with an EPS forecast of 1.00 RMB for 2025 [7] - Shenhuo Co. (000933.SZ) is rated "Buy" with an EPS forecast of 2.13 RMB for 2025 [7] 5. Supply and Demand - Domestic supply remains stable, while overseas supply disruptions have occurred, such as Century Aluminum's production halt in Iceland [9] - The demand side shows a mixed picture, with high aluminum prices suppressing downstream purchasing enthusiasm [9]
有色金属周报20251026:需求旺季叠加供给扰动,工业金属价格上行-20251026
Minsheng Securities· 2025-10-26 08:35
Investment Rating - The report maintains a "Recommended" rating for several companies in the non-ferrous metals sector, including Zijin Mining, Luoyang Molybdenum, and China Aluminum [5][6]. Core Views - The report highlights that industrial metal prices are expected to remain strong due to seasonal demand and supply disruptions, particularly for copper and aluminum [2][3]. - Energy metals like lithium and cobalt are projected to perform well, driven by strong demand in the energy storage market and supply constraints [3]. - Precious metals are anticipated to experience price fluctuations in the short term, but long-term trends remain bullish due to central bank gold purchases and weakening dollar credit [4]. Summary by Sections Industrial Metals - Copper prices are supported by macroeconomic sentiment and supply disruptions, with the SMM import copper concentrate index at $51.2/ton, down $0.6/ton month-on-month [2]. - Aluminum demand is robust, particularly from the automotive sector, with domestic aluminum ingot social inventory at approximately 618,000 tons, down 9,000 tons week-on-week [2]. - Key companies recommended include Luoyang Molybdenum, Zijin Mining, and China Aluminum [2]. Energy Metals - Lithium supply is increasing due to new production lines, while demand from the energy storage market is exceeding expectations, supporting strong prices [3]. - Cobalt prices are rising due to supply concerns from the Democratic Republic of Congo, with Chinese companies receiving fewer export quotas than expected [3]. - Recommended companies include Huayou Cobalt and Yichun Lithium [3]. Precious Metals - Gold prices are experiencing short-term volatility due to optimistic international conditions, but long-term outlook remains positive with central bank purchases [4]. - Silver prices are influenced by industrial demand and follow gold's price movements [4]. - Recommended companies include Western Gold and Shandong Gold [4].
价值重估进行时:工业金属电解铝:弹性与红利的完美融合
Tianfeng Securities· 2025-10-26 08:12
Industry Rating - The industry rating for the electrolytic aluminum sector is maintained at "Outperform" [1] Core Viewpoints - The electrolytic aluminum sector is characterized by a perfect blend of resilience and dividend value, indicating a revaluation process is underway [1][3] - The sector's average dividend yield is projected to be 6.0% by the end of 2024, ranking it first among major high-dividend industries, with China Hongqiao's yield reaching 13.7% [2][19] - The report emphasizes the transition of the electrolytic aluminum stocks from being viewed as highly cyclical assets to becoming quality scarce assets with both price elasticity and dividend support [9][19] Summary by Sections 1. Current Dividend Yield of the Electrolytic Aluminum Sector - As of the end of 2024, the weighted average dividend yield for the electrolytic aluminum sector is estimated at 6.0%, leading among high-dividend industries [2][19] - China Hongqiao's dividend yield is notably high at 13.7%, significantly above other industry leaders [20][21] - The overall trend indicates a clear increase in dividend levels across the sector, with many companies raising their dividend guidance for 2025 [24] 2. Sources of Dividend Value Beyond Resilience - The sector's profitability is expected to remain high due to a tightening supply-demand balance, with domestic production capacity nearing its ceiling [6][28] - The report highlights that the capital expenditure peak has passed, leading to improved asset structure and quality within the sector [45][52] - The transition from a focus on scale expansion to quality enhancement is evident, with a clear path for converting high profits into cash flow and shareholder returns [6][39] 3. Will the Valuation of the Electrolytic Aluminum Sector Increase? - Historical comparisons with coal and China Hongqiao suggest that the market is willing to assign higher valuations to dividend-paying assets, recognizing their asset quality and stable cash flows [4] - The price-to-earnings (PE) ratios for leading companies in high-dividend sectors have shown significant improvement since 2023, indicating potential for further valuation increases [4][19] - The overall trend in the sector shows a marked increase in dividend payout ratios, with several companies indicating higher future dividends [24] 4. Stock Selection in the Electrolytic Aluminum Sector - The report recommends focusing on high-dividend companies such as China Hongqiao and Zhongfu Industrial, as well as those with increasing dividend potential like China Aluminum and Shenhuo [5] - The sector is viewed as a combination of offensive aluminum price exposure and defensive dividend asset characteristics, suggesting a favorable investment outlook [5][9]