泰康基金
Search documents
10/30财经夜宵:得知基金净值排名及选基策略,赶紧告知大家
Sou Hu Cai Jing· 2025-10-30 16:12
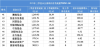
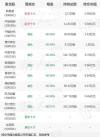
Core Insights - The article provides a ranking of mutual funds based on their net asset value changes over a specified period, highlighting the top-performing and underperforming funds in the market [2][4][6]. Fund Performance Summary Top 10 Funds by Net Value Growth - The top 10 funds with the highest net value growth as of October 30, 2025, include: 1. 泰信发展主题混合 (1.7060) 2. 泰信现代服务业混合 (1.9470) 3. 万家国企动力混合A (1.3913) 4. 万家国企动力混合C (1.3793) 5. 泰康资源精选股票发起A (1.3115) 6. 泰康资源精选股票发起C (1.3062) 7. 华夏瑞益混合A3 (1.7162) 8. 华夏瑞益混合A1 (1.6966) 9. 华夏瑞益混合A2 (1.7093) 10. 华夏行业甄选混合C (1.2776) [2][4]. Bottom 10 Funds by Net Value Growth - The bottom 10 funds with the lowest net value growth as of October 30, 2025, include: 1. 方正富邦科技创新C (1.6445) 2. 方正富邦科技创新A (1.6727) 3. 汇安量化优选A (0.9735) 4. 宝盈转型动力混合C (2.3336) 5. 汇安量化优选C (0.9265) 6. 宝盈转型动力混合A (2.3744) 7. 中航远见领航混合发起A (1.3431) 8. 中航远见领航混合发起C (1.3331) 9. 国融融信消费严选混合A (0.9044) 10. 国融融信消费严选混合C (0.8908) [4][6]. Market Analysis - The Shanghai Composite Index experienced fluctuations, opening low and then rising before a subsequent drop, with a total trading volume of 2.46 trillion. The number of advancing stocks was 1242, while declining stocks numbered 4100 [6]. - The steel industry led the market, while sectors such as communication equipment, internet, and semiconductors saw declines exceeding 2% [6]. Fund Holdings Overview Top Holdings in High-Performing Funds - The top holdings in the high-performing funds include companies in the new energy sector, such as 赣锋锂业 and 永兴材料, with significant price increases [7]. - The concentration of top holdings in these funds is approximately 81.95%, indicating a strong focus on the new energy industry [7]. Top Holdings in Underperforming Funds - The underperforming funds have significant holdings in the artificial intelligence sector, with companies like 中芯国际 and 英维克 showing notable declines [7]. - The concentration of top holdings in these funds is around 57.24%, reflecting a focus on technology and AI-related investments [7].


分化加剧!鹏扬、泰康、国联安单季增长超50亿,国联下滑80亿排名降5位,财通证券资产失守千亿大关
Xin Lang Ji Jin· 2025-10-30 10:13
Core Insights - The public fund industry continues to show a significant disparity in scale, with 47 companies exceeding 100 billion yuan, 19 over 300 billion yuan, and 14 surpassing 500 billion yuan [1] Group 1: Industry Overview - The overall competition in the public fund industry is characterized by "the strong getting stronger, a stalemate in the middle, and movements at the tail" [1] - The ranking of public fund companies by non-monetary scale has been refreshed, indicating a dynamic market environment [1] Group 2: Performance of Specific Companies - Pengyang Fund, Taikang Fund, and Guolian An Fund showed the most stable performance in the 41-50 ranking tier, with respective increases of 50.39 million yuan, 54.48 million yuan, and 52 million yuan in non-monetary scale [3] - Chuangjin Hexin Fund experienced a slight decrease of 24.20 million yuan in the quarter but maintained a positive growth of 102.84 million yuan year-to-date, indicating a solid business foundation [3] - Caizhong Securities Asset faced severe challenges, with a significant drop of 94.34 million yuan in the quarter, falling below the 100 billion yuan threshold [3] Group 3: Competitive Dynamics - The competition around the 100 billion yuan threshold is intensifying, with Caizhong Securities Asset dropping below this mark while other institutions are fiercely competing around this line [4] - Institutions like Guolian Fund and Zhongjia Fund are experiencing deep adjustments, with Guolian Fund's scale shrinking by 80.32 million yuan in the quarter, marking it as the most pressured institution in the group [3][4]
机构风向标 | 力聚热能(603391)2025年三季度已披露持仓机构仅5家
Xin Lang Cai Jing· 2025-10-30 01:36
Core Viewpoint - Lijun Thermal Energy (603391.SH) reported a decline in institutional ownership in its Q3 2025 report, with a total of 5 institutional investors holding 10.7173 million shares, representing 11.78% of the total share capital, a decrease of 0.85 percentage points from the previous quarter [1] Institutional Ownership - As of October 29, 2025, 5 institutional investors disclosed their holdings in Lijun Thermal Energy, totaling 10.7173 million shares, which is 11.78% of the company's total share capital [1] - The institutional investors include Huzhou Xinran Enterprise Management Partnership, Huatai Securities Co., Barclays Bank PLC, Beijing Qianxiang Private Fund Management Co., and Huizhong Qiyuan Future Mixed Initiation A [1] - The overall institutional ownership percentage decreased by 0.85 percentage points compared to the previous quarter [1] Public Fund Holdings - One new public fund disclosed its holdings this quarter, namely Huizhong Qiyuan Future Mixed Initiation A [1] - A total of 88 public funds that were previously disclosed did not report their holdings this quarter, including Taikang Quality Life Mixed A, Taikang Strategy Preferred Mixed, Taikang Jingtai Return Mixed A, GF Jixiang Bond A, and Southern CSI 2000 ETF [1]
“黄金”赛道,落袋为安!
Zhong Guo Ji Jin Bao· 2025-10-29 06:56
Core Insights - Recent three trading days saw over 5 billion yuan net outflow from gold ETFs, indicating profit-taking behavior among investors [2][8] - The Shanghai Composite Index approached the 4000-point mark, supported by significant inflows into broad-based ETFs, particularly the CSI 300 ETF and SSE 50 ETF [2][7] ETF Market Overview - As of October 28, the total scale of 1231 stock ETFs (including cross-border ETFs) reached 4.42 trillion yuan, with a net inflow of only 2.14 billion yuan on that day [3] - Bond ETFs and broad-based ETFs led the net inflows, with 41.55 billion yuan and 38.99 billion yuan respectively, while thematic industry ETFs experienced a net outflow of 40.23 billion yuan [5] Specific ETF Performance - On October 28, the CSI 300 ETF and SSE 50 ETF each saw net inflows exceeding 14 billion yuan, making them the only stock ETFs with inflows over 10 billion yuan that day [7] - The Tianhong Sci-Tech Bond ETF and Taikang Sci-Tech Bond ETF reported net inflows of over 28 billion yuan and 9 billion yuan respectively [8] Fund Management Insights - E Fund's ETFs have shown significant growth, with the latest scale reaching 831 billion yuan, an increase of 230.35 billion yuan since 2025 [5] - In the context of the A-share market, structural opportunities and volatility are expected, with a focus on indices like the CSI 500 and CSI 300, as well as liquidity-sensitive assets such as the Hang Seng Tech Index [7]

“黄金”赛道,落袋为安!
中国基金报· 2025-10-29 06:51
Core Viewpoint - Recent data indicates that over the past three trading days, gold ETFs have experienced a net outflow of more than 5 billion yuan, attributed to profit-taking following a decline in gold prices [2][8]. Summary by Sections Stock ETF Market - As of October 28, the total scale of the stock ETF market (including cross-border ETFs) reached 4.42 trillion yuan, with a net inflow of only 2.14 billion yuan on that day [4]. - The Shanghai Composite Index reached the 4000-point mark, supported by significant inflows into broad-based ETFs, particularly the CSI 300 ETF, SSE 50 ETF, and CSI A500 ETF [9][10]. Fund Flows - In terms of major categories, bond ETFs and broad-based ETFs saw the highest net inflows, amounting to 4.155 billion yuan and 3.899 billion yuan, respectively, while industry-themed ETFs faced a net outflow of 4.023 billion yuan [6]. - Specific ETFs tracking the AAA Sci-Tech Bond Index and the SGE Gold 9999 Index saw significant movements, with the former gaining a net inflow of 3.811 billion yuan and the latter experiencing a net outflow of 1.46 billion yuan [6]. Large Fund Companies - Major fund companies like E Fund and Huaxia Fund reported continued net inflows in several ETFs, with E Fund's ETFs reaching a total scale of 831 billion yuan, an increase of 230.35 billion yuan since 2025 [7]. - On October 28, notable inflows included 280 million yuan into the A500 ETF and 170 million yuan into the pharmaceutical ETF from E Fund [7]. Gold ETF Performance - The gold ETF market has seen significant profit-taking, with a total net outflow exceeding 5 billion yuan over the last three trading days, indicating a shift in investor sentiment [8][14].

上亿元,基金密集发红包,多只ETF成“大户”
Zheng Quan Shi Bao· 2025-10-27 02:04
Core Insights - The year-end fund distribution trend continues to rise, with bond and passive index funds becoming the main focus, as several funds have single distribution amounts exceeding 1 billion [1][3][5] Fund Distribution Overview - A significant number of funds have distributed over 1 billion in a single payout, indicating a sustained year-end distribution trend [3] - Large distributions are primarily concentrated in bond funds and passive index funds, with notable payouts such as 2.25 billion from Guangfa Ju Xin A and 3.58 billion from Huashan Shanghai 180 ETF [3][5] - Many funds have implemented multiple distributions within the year, showcasing a trend towards normalization of distributions [3] ETF Dominance - ETFs are identified as the "red envelope big spenders," with large-scale passive products leading the distribution trend, such as Huaxia CSI 300 ETF distributing 28.7 billion [5][6] - The scale and stable returns of passive products contribute to their dominance in the distribution market, with nearly all major distributors being broad-based ETFs [5][6] Market Trends - The current distribution pattern reflects a market preference for stability and cash flow returns, with funds like Wan Jia North Exchange Wisdom Two-Year Open A achieving a distribution ratio of 21.17% [3][6] - The trend indicates that ETF distributions are likely to become a regular occurrence, as fund companies recognize the importance of distributions in enhancing investor experience and stabilizing capital [6]
上亿元!基金密集发红包 多只ETF成“大户”
Zheng Quan Shi Bao· 2025-10-27 00:17
Core Insights - The year-end fund distribution trend continues, with bond and passive index funds becoming the main focus, as several funds have single distributions exceeding 100 million yuan [1][2][3] Group 1: Fund Distribution Trends - A significant number of funds have distributed over 1 billion yuan recently, indicating a sustained year-end distribution trend [2] - Large distributions are primarily concentrated in bond funds and passive index funds, with notable examples including Guangfa Ju Xin A distributing 225 million yuan and Huaxia Shanghai-Shenzhen 300 ETF distributing 2.87 billion yuan [2][3] - Many funds have implemented multiple distributions within the year, reflecting a trend towards normalization of distributions [2] Group 2: ETF Dominance - ETFs are identified as the "red envelope big spenders," with large-scale passive products leading the distribution trend [3][4] - The Huatai-PineBridge Shanghai-Shenzhen 300 ETF has a single distribution exceeding 8 billion yuan, while other ETFs like Huaxia and E Fund also have significant distributions [3][4] - The structure of the market shows a preference for stable cash flow returns, with ETFs meeting this demand due to their large scale and stable earnings accumulation [4] Group 3: Future Outlook - ETF distributions are expected to become a norm as passive product scales continue to grow and investor structures mature [5] - Fund companies are increasingly recognizing the importance of distributions in enhancing investment experiences and stabilizing capital [5]
上亿元!基金密集发红包,多只ETF成“大户”
券商中国· 2025-10-26 23:34
Core Viewpoint - The year-end fund dividend trend is intensifying, with bond and passive index funds becoming the main contributors, as several funds have single dividends exceeding 100 million yuan [1][3]. Group 1: Fund Dividend Trends - The recent surge in fund dividends has seen multiple funds distributing over 100 million yuan in a single payout, indicating a continuation of the year-end dividend trend [3]. - Large dividends are primarily concentrated in bond funds and passive index funds, with notable payouts from mixed secondary bond funds and long-term pure bond funds [3][4]. - The trend of multiple dividends within the year is evident, with several funds having distributed dividends multiple times, reflecting a normalization of dividend payouts [3]. Group 2: ETF Dominance - ETFs are identified as the "big red envelope" contributors, with significant dividend amounts concentrated in these products, showcasing their scale advantages and stable returns [2][4]. - Major ETFs like Huaxia CSI 300 ETF and E Fund CSI 300 ETF have reported dividends exceeding 20 billion yuan, highlighting their role as the main players in the dividend market [4][6]. - The increasing scale and maturity of investor structures in ETFs suggest that dividends are transitioning from a temporary reward to a long-term norm, enhancing the attractiveness of these funds [2][6]. Group 3: Market Dynamics - The current dividend landscape reflects a market preference for stability, with investors favoring cash flow returns amid market fluctuations [6]. - The characteristics of large-scale ETFs, including high fund concentration and stable asset performance, contribute to their ability to generate substantial dividends [6]. - The outlook suggests that ETF dividends are likely to become a regular occurrence, as fund companies recognize the importance of dividends in enhancing investor experience and stabilizing capital [6].

泰康基金魏军旗下泰康中证A500ETF三季报最新持仓,重仓宁德时代
Sou Hu Cai Jing· 2025-10-26 21:39
Core Insights - The TaiKang Zhongzheng A500 ETF, managed by Wei Jun, reported a net value growth rate of 23.61% over the past year [1] Group 1: Fund Performance - The fund's top ten holdings saw the addition of new stocks, including Xinyi Technology and Zhongji Xuchuang, while major reductions were made in holdings like CATL and Kweichow Moutai [1] - CATL remains the largest holding at 3.77% of the fund's portfolio, despite a 50.56% reduction in shares held [1] Group 2: Changes in Holdings - New entries in the top ten holdings include: - Xinyi Technology (300502) with 132,000 shares valued at 48 million [1] - Zhongji Xuchuang (300308) with 118,100 shares valued at 48 million [1] - Significant reductions in holdings include: - CATL (300750) with a 50.56% decrease, now holding 350,900 shares valued at 141 million [1] - Kweichow Moutai (600519) with a 50.59% decrease, now holding 83,200 shares valued at 120 million [1] - Ping An Insurance (601318) with a 50.58% decrease, now holding 1,427,800 shares valued at 79 million [1]
泰康先进材料股票基金发起式清盘 成立3年小幅亏损
Zhong Guo Jing Ji Wang· 2025-10-24 08:15
中国经济网北京10月24日讯 今日,泰康基金发布泰康先进材料股票型发起式证券投资基金清算报告。 报告称,泰康先进材料股票型发起式证券投资基金于2022年6月7日经中国证监会证监许可【2022】1168 号文批准,于2022年7月26日起《泰康先进材料股票型发起式证券投资基金基金合同》(以下简称"《基金合 同》")生效。 该基金《基金合同》"第五部分 基金备案"之"三、基金存续期内的基金份额持有人数量和资产规模"规 定:"基金合同生效之日起3年后的对应日,若基金资产净值低于2亿元,基金合同自动终止,且不得通过召 开基金份额持有人大会延续基金合同期限。"该基金《基金合同》生效之日起三年后的对应日为2025年7月26 日。截至2025年7月26日日终,该基金的资产净值低于2亿元人民币,触发上述《基金合同》终止情形。 泰康先进材料股票发起自成立以来就由刘少军管理,资料显示,刘少军2017年7月加入泰康公募,任泰 康基金股票研究员、股票基金经理,2022年7月26日起任基金经理。刘少军目前还管理着泰康资源精选股票 发起式基金,该基金成立于今年8月12日,目前仅运作了2个月,截至10月23日,其A/C份额的收益率分别为 ...
