沪深300指数
Search documents
4只沪深300指数ETF成交放量 成交额环比均增加超亿元
Zheng Quan Shi Bao Wang· 2025-10-31 11:20
Core Insights - The total trading volume of the CSI 300 Index ETFs reached 10.399 billion yuan today, an increase of 3.989 billion yuan from the previous trading day, representing a growth rate of 62.22% [1] Trading Volume Analysis - Huatai-PB CSI 300 ETF (510300) had a trading volume of 6.852 billion yuan, up by 2.896 billion yuan, with a growth rate of 73.22% [1] - Harvest CSI 300 ETF (159919) recorded a trading volume of 1.269 billion yuan, increasing by 548 million yuan, with a growth rate of 76.03% [1] - E Fund CSI 300 ETF (510310) saw a trading volume of 974 million yuan, up by 303 million yuan, with a growth rate of 45.17% [1] - Notably, Guolianan CSI 300 ETF (515660) and ICBC CSI 300 ETF (510350) experienced significant increases in trading volume, with growth rates of 1653.26% and 89.98% respectively [1] Market Performance - As of market close, the CSI 300 Index (000300) fell by 1.47%, while the average decline for related ETFs was 1.31% [1] - The ETFs with the largest declines included Invesco Great Wall CSI 300 Enhanced Strategy ETF (159238) and 300 Index ETF (510370), which dropped by 1.60% and 1.53% respectively [1]
近一年超八成指增基金获超额收益 沪深300赛道再添新品
Zhong Zheng Wang· 2025-10-31 10:33
Core Insights - The A-share market has experienced a structural rally since the second half of 2025, with index-based products becoming the primary investment method for participants [1] - The average net value growth rate of index-enhanced funds in the past year is 35.54%, outperforming the benchmark by 6.93%, with over 80% of these funds achieving excess returns [1] - The launch of the Guangfa CSI 300 Index Quantitative Enhanced Fund reflects the growing interest in index-enhanced products, which aim to optimize investment portfolios based on quantitative analysis and fundamental research [1][3] Market Overview - As of the end of Q3, the total management scale of public funds reached 36.45 trillion yuan, an increase of 2.41 trillion yuan from the end of Q2, with stock index funds seeing the largest growth in the stock fund category [1] - The stock index fund segment saw a quarterly increase of 1.06 trillion yuan, with index-enhanced products experiencing a significant growth rate of 21.15% [1] Fund Performance - The returns of index-enhanced funds can be divided into Beta returns from the underlying index's rise and Alpha returns from active management [2] - The CSI 300 Index, which consists of the 300 largest and most liquid stocks in the A-share market, has shown a cumulative increase of 367% since its inception, outperforming other broad-based indices [2] - The CSI 300 Index accounted for 74.67% of total A-share dividends in 2024, indicating strong dividend capabilities compared to the average A-share level [2] Management Capabilities - The ability of fund managers to extract excess returns is crucial when selecting index-enhanced funds, with Guangfa Fund having multiple products tracking various indices [3] - The Guangfa CSI 300 Index Quantitative Enhanced Fund will employ a strategy combining active quantitative management and AI enhancement to optimize stock selection and adapt to market dynamics [3]
4000点!你知道沪指到底啥意思吗?
Sou Hu Cai Jing· 2025-10-29 20:15
Group 1 - The article discusses the significance of the Shanghai Composite Index (沪指) as a reflection of the stock market in Shanghai [7][31] - It explains the concept of stock indices using an analogy of a fish tank, where the tank represents the stock market and the fish represent various stocks [10][12] - The article outlines how the index is calculated by comparing the current market value of stocks to an initial value, referred to as the base value [16][20] Group 2 - The Shanghai Composite Index includes all listed stocks on the Shanghai Stock Exchange, excluding ST and *ST stocks, and serves as a comprehensive indicator of market performance [31] - The index was established with a base date of December 19, 1990, when the index was set at 100 points [33] - The article notes that the index has reached a new high in the past 10 years, indicating significant market performance [35]


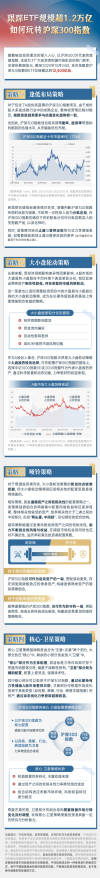
跟踪ETF规模超1.2万亿,如何玩转沪深300指数
Sou Hu Cai Jing· 2025-10-29 07:06
Core Insights - The article discusses the growing popularity of the CSI 300 Index as a tool for investors to capture market opportunities, with the total scale of ETFs tracking this index reaching 1.25 trillion yuan as of October 24, 2025 [2]. Group 1: Investment Strategies - The CSI 300 Index, comprising high-quality blue-chip stocks, is suitable for low-positioning strategies based on valuation indicators such as price-to-earnings (PE) and dividend yield [3]. - A phased investment approach is recommended, where investors can gradually buy into index products when the CSI 300 Index is at historically low valuation levels, thus mitigating timing risks [6]. - The article highlights the size and style rotation strategy, indicating that large-cap and small-cap stocks in the A-share market exhibit significant performance divergence influenced by economic cycles [7][10]. Group 2: Portfolio Strategies - The "Dumbbell Strategy" is introduced, which focuses on allocating assets with low correlation to balance risk and return, emphasizing a concentrated investment in both ends of the risk-return spectrum [15]. - For conservative investors, the CSI 300 Index can serve as an offensive asset, while for aggressive investors, it can be paired with high-growth sectors to create a more offensive portfolio [19]. - The "Core-Satellite Strategy" is discussed, where the core portion of the portfolio is invested in the CSI 300 Index for stable returns, while the satellite portion is allocated to other assets for tactical gains [20][23].
中国沪深300指数上涨1%至4,738.90点
Mei Ri Jing Ji Xin Wen· 2025-10-29 06:35
Core Viewpoint - The Shanghai and Shenzhen 300 Index increased by 1% to 4,738.90 points on October 29 [1] Group 1 - The index performance indicates a positive market sentiment [1]
沪深300指数下跌1%至4,546.35点
Mei Ri Jing Ji Xin Wen· 2025-10-23 04:15
Core Viewpoint - The CSI 300 Index experienced a decline of 1%, closing at 4,546.35 points on October 23 [1] Group 1 - The CSI 300 Index is a key indicator of the performance of the top 300 stocks listed on the Shanghai and Shenzhen stock exchanges [1]
沪深300指数日内涨幅达1%
Mei Ri Jing Ji Xin Wen· 2025-10-15 06:28
Core Points - The CSI 300 Index experienced an intraday increase of 1% on October 15 [1] Group 1 - The rise in the CSI 300 Index indicates positive market sentiment and potential investment opportunities in the Chinese stock market [1]
四点半观市 | 机构:核心估值仍较合理 看好A股与港股市场机遇
Shang Hai Zheng Quan Bao· 2025-10-14 10:38
Group 1: Bond Futures Market - On October 14, major bond futures contracts closed higher, with the 30-year bond futures (TL2512) closing at 114.760 yuan, up 0.390 yuan, a rise of 0.34% [1] - The 10-year bond futures (T2512) closed at 108.170 yuan, up 0.120 yuan, a rise of 0.11% [1] - The 5-year bond futures (TF2512) closed at 105.775 yuan, up 0.110 yuan, a rise of 0.10% [1] - The 2-year bond futures (TS2512) closed at 102.384 yuan, up 0.018 yuan, a rise of 0.02% [1] Group 2: ETF Market Performance - On October 14, ETF performance was mixed, with the Xinhua Dividend Low Volatility ETF (560890) rising by 2.85% and the Alcohol ETF (512690) increasing by 2.77% [1] - Conversely, the Sci-Tech Semiconductor ETF (588170) fell by 6.85%, and the Semiconductor Equipment ETF (159516) decreased by 6.81% [1] - The Easy Fund Semiconductor Equipment ETF (159558) also dropped by 6.74% [1] Group 3: Convertible Bonds and Indices - On October 14, the China Convertible Bond Index fell by 0.78%, closing at 479.83 points [1] - Notable gainers included the Wenke Convertible Bond, which rose by 4.52%, and the Bojun Convertible Bond, which increased by 4.28% [1] - Significant decliners included the Zhenhua Convertible Bond, which fell by 8.35%, and the New 23 Convertible Bond, which dropped by 7.61% [1] Group 4: Stock Market Insights - UBS's China equity strategy head, Wang Zonghao, noted that the MSCI China Index has risen approximately 36% since early April, with potential short-term profit-taking expected [2] - Wang expressed a preference for A-shares over H-shares, anticipating that the CSI 300 Index will show greater resilience [2] - In a volatile market environment, investment manager Jiang Shan emphasized the importance of identifying certain investment themes, remaining optimistic about both A-share and Hong Kong markets [2] Group 5: Gold Market Outlook - In the context of gold, strategist Zhao Yaoting from Invesco indicated that the upward trend in gold prices may continue to be supported [2] - Despite achieving double-digit returns in 2023 and 2024, investor participation through ETFs remains relatively low [2] - Strong performance in gold in 2025 has begun to attract investors back into the market, with positive ETF fund inflows potentially driving prices higher [2]
股指期货:沪深300创新高
Nan Hua Qi Huo· 2025-09-25 09:12
Report Summary Report Industry Investment Rating No relevant information provided. Core View Today's stock market showed a volatile trend, with the broader market index demonstrating strength as the CSI 300 index reached a new high, reflecting continued market optimism. The rising stocks were concentrated, with the ratio of rising to falling stocks at only 0.39. Similar to yesterday, the leading sectors were still focused on TMT, but mainly weighted stocks were rising. In the short term, a structural rally is maintained, and there are no incremental systematic positives or negatives. Therefore, the expectation of a stable transition in the pre - holiday market is maintained, and a wait - and - see approach is recommended. [4] Market Review - Today's stock index trends varied. Taking the CSI 300 index as an example, it closed up 0.60%. In terms of capital flow, the trading volume of the two markets increased by 44.306 billion yuan. In the futures index market, IF rose with increasing volume, IC and IH rose with decreasing volume, and IM fell with decreasing volume. [2] Important Information - Hong Kong Monetary Authority Chief Executive Eddie Yue announced that a fixed - income and currency roadmap would be released today during his welcome speech at the Hong Kong Fixed Income and Currency Forum. - On September 25, the National Healthcare Security Administration officially issued a notice on a 100 - day special rectification campaign for prominent problems in healthcare fund management, to be carried out nationwide from now until December 31, 2025, targeting illegal and irregular use of healthcare funds such as reselling returned healthcare drugs, over - prescribing, and fraudulently obtaining maternity allowances. [3] Strategy Recommendation Futures Index Market Observation | | IF | IH | IC | IM | | --- | --- | --- | --- | --- | | Main contract intraday change (%) | 0.88 | 0.52 | 0.43 | - 0.09 | | Trading volume (10,000 lots) | 13.3482 | 5.1813 | 12.9665 | 21.2836 | | Trading volume MoM (10,000 lots) | - 1.3263 | - 1.0311 | - 4.7515 | - 8.0784 | | Open interest (10,000 lots) | 26.6373 | 9.4947 | 24.8859 | 35.3327 | | Open interest MoM (10,000 lots) | 0.2673 | - 0.3358 | - 0.7113 | - 1.2164 | [5] Spot Market Observation | Name | Value | | --- | --- | | Shanghai Composite Index change (%) | - 0.01 | | Shenzhen Component Index change (%) | 0.67 | | Ratio of rising to falling stocks | 0.39 | | Trading volume of the two markets (billion yuan) | 237.109 | | Trading volume MoM (billion yuan) | 4.4306 | [6]
9月18日沪深300ETF中金(510320)份额减少1800.00万份,最新份额4.48亿份,最新规模5.41亿元
Xin Lang Cai Jing· 2025-09-19 04:36
Core Viewpoint - The performance of the CSI 300 ETF managed by China International Capital Corporation (CICC) has shown a decline in both share price and total shares over the recent trading period [1] Group 1: Fund Performance - On September 18, the CSI 300 ETF (510320) experienced a drop of 0.90% with a trading volume of 36.8733 million yuan [1] - The total shares decreased by 18 million, bringing the latest total to 448 million shares, with a reduction of 48 million shares over the past 20 trading days [1] - The latest net asset value is calculated at 541 million yuan [1] Group 2: Benchmark and Returns - The performance benchmark for the CSI 300 ETF is the return rate of the CSI 300 Index [1] - Since its inception on April 16, 2025, the fund has achieved a return of 20.67%, with a monthly return of 6.16% [1]