国联安基金
Search documents
电池ETF上周领涨,机构:看好周期与技术共振丨ETF基金周报
2 1 Shi Ji Jing Ji Bao Dao· 2025-11-03 03:15
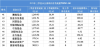
Market Overview - The Shanghai Composite Index rose by 0.11% to close at 3954.79 points, with a weekly high of 4025.7 points [1] - The Shenzhen Component Index increased by 0.67% to 13378.21 points, reaching a peak of 13700.25 points [1] - The ChiNext Index gained 0.5%, closing at 3187.53 points, with a maximum of 3331.86 points [1] - Global markets saw most major indices rise, with the Nasdaq Composite up 2.24%, the Dow Jones Industrial Average up 0.75%, and the S&P 500 up 0.71% [1] - In the Asia-Pacific region, the Hang Seng Index fell by 0.97%, while the Nikkei 225 Index surged by 6.31% [1] ETF Market Performance - The median weekly return for stock ETFs was 0.23% [2] - The highest weekly return among scale index ETFs was 2.4% for the Jiashi Zhongchuang 400 ETF [2] - The South China CSI New Energy ETF led industry index ETFs with a return of 5.94% [2] - The highest return in strategy index ETFs was 2.37% for the China Southern CSI All-Share Dividend Quality ETF [2] - The Jiashi CSI Battery Theme ETF achieved the highest return among thematic index ETFs at 7.75% [2] ETF Performance Rankings - The top five stock ETFs by weekly return were: - Jiashi CSI Battery Theme ETF (7.75%) - Huatai-PB CSI Battery Theme ETF (7.56%) -招商中证电池主题ETF (7.52%) - 富国中证电池主题ETF (7.51%) - 浦银安盛中证光伏产业ETF (7.04%) [4][5] - The five stock ETFs with the largest declines were: - 国联安上证科创板芯片设计主题ETF (-5.35%) - 华安上证科创板芯片ETF (-5.11%) - 国泰上证科创板芯片ETF (-5.06%) - 博时上证科创板芯片ETF (-5.05%) - 南方上证科创板芯片ETF (-5.05%) [4][5] ETF Liquidity - Average daily trading volume for stock ETFs increased by 13.3%, with average daily trading volume rising by 46.7% and turnover rate increasing by 0.22% [6] ETF Fund Flows - The top five stock ETFs by fund inflow were: - 华泰柏瑞沪深300ETF (inflow of 5.084 billion) - 华夏上证科创板50成份ETF (inflow of 1.647 billion) - 华夏上证50ETF (inflow of 1.535 billion) - 国泰中证全指证券公司ETF (inflow of 1.353 billion) - 嘉实上证科创板芯片ETF (inflow of 959 million) [9] - The five stock ETFs with the largest outflows were: - 鹏华中证酒ETF (outflow of 351 million) - 华安创业板50ETF (outflow of 334 million) - 汇添富中证电池主题ETF (outflow of 284 million) - 南方中证申万有色金属ETF (outflow of 279 million) - 嘉实中证稀土产业ETF (outflow of 256 million) [10] ETF Financing and Margin Trading - The financing balance for stock ETFs increased from 47.486 billion to 49.145 billion, while the margin balance rose from 2.5678 billion to 2.6069 billion [11] ETF Market Size - The total market size for ETFs reached 5699.032 billion, an increase of 6.878 billion from the previous week [15] - Stock ETFs accounted for 3724.471 billion, representing 65.4% of the total ETF market size [15][17] ETF Issuance and Establishment - No new ETFs were issued last week, but eight new ETFs were established, including 天弘国证港股通科技ETF and 摩根恒生港股通50ETF [18] Institutional Insights - 财通证券 is optimistic about the solid-state battery industry, expecting breakthroughs in technology and increased industrialization by 2025 [18] - 中国银河证券 believes traditional lithium battery equipment manufacturers will maintain their advantages in the solid-state battery market, suggesting a focus on developments in equipment and orders [18]


两市ETF两融余额增加6.48亿元丨ETF融资融券日报
2 1 Shi Ji Jing Ji Bao Dao· 2025-11-03 02:49
Market Overview - As of October 31, the total ETF margin balance in the two markets reached 118.932 billion yuan, an increase of 0.648 billion yuan from the previous trading day. The financing balance was 110.985 billion yuan, up by 0.935 billion yuan, while the securities lending balance decreased to 7.947 billion yuan, down by 0.287 billion yuan [1] - In the Shanghai market, the ETF margin balance was 83.393 billion yuan, increasing by 0.931 billion yuan. The financing balance rose to 76.404 billion yuan, up by 1.196 billion yuan, and the securities lending balance decreased to 6.989 billion yuan, down by 0.265 billion yuan [1] - In the Shenzhen market, the ETF margin balance was 35.539 billion yuan, a decrease of 0.283 billion yuan. The financing balance fell to 34.581 billion yuan, down by 0.260 billion yuan, while the securities lending balance decreased to 0.958 billion yuan, down by 22.3196 million yuan [1] ETF Margin Balances - The top three ETFs by margin balance as of October 31 were: 1. Huaan Yifu Gold ETF (8.113 billion yuan) 2. E Fund Gold ETF (5.690 billion yuan) 3. Huaxia Hang Seng (QDII-ETF) (4.116 billion yuan) [2] ETF Financing Amounts - The top three ETFs by financing amount on October 31 were: 1. Hai Futong Zhongzheng Short-term Bond ETF (2.059 billion yuan) 2. E Fund Hong Kong Investment Theme ETF (1.661 billion yuan) 3. Bosera Convertible Bonds and Exchangeable Bonds ETF (0.992 billion yuan) [4] ETF Net Financing Amounts - The top three ETFs by net financing amount on October 31 were: 1. Hai Futong Zhongzheng Short-term Bond ETF (0.285 billion yuan) 2. Huatai-PB CSI 300 ETF (0.142 billion yuan) 3. E Fund ChiNext ETF (0.119 billion yuan) [5] ETF Securities Lending Amounts - The top three ETFs by securities lending amount on October 31 were: 1. Guotai CES Semiconductor Chip Industry ETF (19.8833 million yuan) 2. Huatai-PB CSI 300 ETF (19.7935 million yuan) 3. Southern CSI Shenwan Non-ferrous Metals ETF (4.0323 million yuan) [6]

盛弘股份股价涨5.4%,国联安基金旗下1只基金重仓,持有12万股浮盈赚取27.12万元
Xin Lang Cai Jing· 2025-11-03 02:28
Group 1 - The core viewpoint of the news is that Shenghong Co., Ltd. has seen a significant increase in its stock price, rising by 5.4% to 44.09 CNY per share, with a total market capitalization of 13.791 billion CNY [1] - The company, established in September 2007 and listed in August 2017, specializes in the research, production, sales, and service of power electronic equipment [1] - The main revenue sources for Shenghong include electric vehicle charging equipment (46.42%), new energy power conversion equipment (20.82%), industrial power supply (20.53%), battery testing and formation equipment (9.78%), and others (2.45%) [1] Group 2 - From the perspective of fund holdings, Guolian An Fund has a significant position in Shenghong, with its Guolian An Dividend Mixed Fund holding 120,000 shares, accounting for 6.16% of the fund's net value [2] - The Guolian An Dividend Mixed Fund has a total scale of 80.601 million CNY and has achieved a year-to-date return of 11.97%, ranking 5607 out of 8223 in its category [2] - The fund manager, Xu Jun, has been in position for over 6 years, with the best fund return during his tenure being 53.37% [3]
陕西煤业股价涨5.07%,国联安基金旗下1只基金重仓,持有1000股浮盈赚取1150元
Xin Lang Cai Jing· 2025-11-03 02:21
Group 1 - The core point of the news is the performance of Shaanxi Coal and its significance in the investment landscape, highlighted by its recent stock price increase and market capitalization [1] - Shaanxi Coal's stock rose by 5.07% to 23.85 CNY per share, with a trading volume of 4.97 billion CNY and a turnover rate of 0.22%, leading to a total market value of 231.226 billion CNY [1] - The company, established on December 23, 2008, and listed on January 28, 2014, primarily engages in coal mining, washing, transportation, sales, and production services [1] Group 2 - From the perspective of fund holdings, Guolian An Fund has a significant position in Shaanxi Coal, with its Guolian An Tongying Mixed A Fund holding 1,000 shares, representing 0.85% of the fund's net value, making it the fourth-largest holding [2] - The Guolian An Tongying Mixed A Fund, established on June 13, 2014, has a current scale of 1.5542 million CNY, with a year-to-date return of 3.53% and a one-year return of 5.81% [2] Group 3 - The fund managers of Guolian An Tongying Mixed A are Xue Lin and Wang Huan, with Xue Lin having a tenure of 13 years and 119 days and a best fund return of 81.83% during her tenure [3] - Wang Huan has a tenure of 7 years and 312 days, with a best fund return of 56.76% during his management [3]
机构风向标 | 中嘉博创(000889)2025年三季度已披露持仓机构仅3家
Xin Lang Cai Jing· 2025-10-31 02:27
Core Insights - Zhongjiabochuang (000889.SZ) released its Q3 2025 report on October 31, 2025, indicating that three institutional investors hold a total of 243 million shares, representing 25.90% of the company's total equity [1] Institutional Holdings - Three institutional investors disclosed their holdings in Zhongjiabochuang A-shares, with a combined shareholding of 243 million shares, maintaining a holding ratio of 25.90% [1] - The institutional investors include Xiaochang Yingxi Valley Investment Center (Limited Partnership), Qinhuangdao State-owned Assets Management Holding Co., Ltd., and Beijing Bosheng Advantage Technology Development Co., Ltd. [1] Public Fund Holdings - In this reporting period, one public fund, Guolian An CSI 300 Index Enhanced A, was disclosed, which did not change from the previous quarter [1]
分化加剧!鹏扬、泰康、国联安单季增长超50亿,国联下滑80亿排名降5位,财通证券资产失守千亿大关
Xin Lang Ji Jin· 2025-10-30 10:13
Core Insights - The public fund industry continues to show a significant disparity in scale, with 47 companies exceeding 100 billion yuan, 19 over 300 billion yuan, and 14 surpassing 500 billion yuan [1] Group 1: Industry Overview - The overall competition in the public fund industry is characterized by "the strong getting stronger, a stalemate in the middle, and movements at the tail" [1] - The ranking of public fund companies by non-monetary scale has been refreshed, indicating a dynamic market environment [1] Group 2: Performance of Specific Companies - Pengyang Fund, Taikang Fund, and Guolian An Fund showed the most stable performance in the 41-50 ranking tier, with respective increases of 50.39 million yuan, 54.48 million yuan, and 52 million yuan in non-monetary scale [3] - Chuangjin Hexin Fund experienced a slight decrease of 24.20 million yuan in the quarter but maintained a positive growth of 102.84 million yuan year-to-date, indicating a solid business foundation [3] - Caizhong Securities Asset faced severe challenges, with a significant drop of 94.34 million yuan in the quarter, falling below the 100 billion yuan threshold [3] Group 3: Competitive Dynamics - The competition around the 100 billion yuan threshold is intensifying, with Caizhong Securities Asset dropping below this mark while other institutions are fiercely competing around this line [4] - Institutions like Guolian Fund and Zhongjia Fund are experiencing deep adjustments, with Guolian Fund's scale shrinking by 80.32 million yuan in the quarter, marking it as the most pressured institution in the group [3][4]
光伏ETF涨幅居前,机构:行业估值存修复契机丨ETF基金日报
2 1 Shi Ji Jing Ji Bao Dao· 2025-10-30 02:28
Market Overview - The Shanghai Composite Index rose by 0.7% to close at 4016.33 points, while the Shenzhen Component Index increased by 1.95% to 13691.38 points, and the ChiNext Index surged by 2.93% to 3324.27 points [1] ETF Market Performance - The median return of stock ETFs was 1.12%, with the highest return from the Fortune Growth Enterprise 50 ETF at 12.29%, followed by the Southern CSI New Energy ETF at 6.25% [2][4] - The top three ETFs by return were: Fortune Growth Enterprise 50 ETF (12.29%), Southern CSI New Energy ETF (8.81%), and Tianhong CSI New Energy ETF (8.75%) [4] - The largest declines were seen in the E Fund CSI Bank ETF (-1.97%), Penghua CSI Bank ETF (-1.95%), and Tianhong CSI Bank ETF (-1.95%) [4] ETF Fund Flows - The top three ETFs by fund inflow were: Jiasai Shanghai Stock Exchange Sci-Tech Innovation Board Chip ETF (9.08 billion), E Fund CSI 300 Non-Bank Financial ETF (6.92 billion), and Guotai CSI All-Index Communication Equipment ETF (6.32 billion) [6][7] - The largest outflows were from the E Fund ChiNext ETF (8.68 billion), Huabao CSI Bank ETF (5.7 billion), and Penghua CSI Defense ETF (4.16 billion) [7] ETF Margin Trading Overview - The highest margin buy amounts were for: Huaxia Shanghai Stock Exchange Sci-Tech Innovation Board 50 Component ETF (8.25 billion), Guotai CSI All-Index Securities Company ETF (6.62 billion), and Jiasai Shanghai Stock Exchange Sci-Tech Innovation Board Chip ETF (4.11 billion) [8][9] - The highest margin sell amounts were for: Huatai Baichuan CSI 300 ETF (29.77 million), Southern CSI 500 ETF (7.79 million), and Huaxia Shanghai 50 ETF (6.71 million) [9] Institutional Insights - Zhongyuan Securities noted that the photovoltaic industry showed signs of recovery in Q3, driven by improved supply-demand dynamics and rising prices of polysilicon, suggesting a potential valuation recovery [10] - CICC highlighted that the photovoltaic industry's main trading line is currently weak, with a focus on mergers and acquisitions in the silicon material segment and price increases in the component segment, while also emphasizing the importance of companies with strong second growth curves [11]

宇通客车股价跌5.02%,国联安基金旗下1只基金重仓,持有1300股浮亏损失2067元
Xin Lang Cai Jing· 2025-10-29 06:18
Core Viewpoint - Yutong Bus experienced a decline of 5.02% in stock price, closing at 30.07 CNY per share, with a trading volume of 9.25 billion CNY and a turnover rate of 1.36%, resulting in a total market capitalization of 665.73 billion CNY [1] Company Overview - Yutong Bus Co., Ltd. is located at No. 6 Yutong Road, Guancheng Hui District, Zhengzhou, Henan Province, established on January 8, 1997, and listed on May 8, 1997. The company specializes in the research, production, and sales of buses and bus components [1] - The revenue composition of the main business includes: bus manufacturing segment 94.41%, foreign trade segment 32.14%, other segments 12.13%, and passenger transport segment 0.07% [1] Fund Holdings - According to data from the top ten holdings of funds, one fund under Guolian An Fund has a significant position in Yutong Bus. Guolian An Tianxin Flexible Allocation Mixed A (001359) reduced its holdings by 1,700 shares in the third quarter, holding 1,300 shares, which accounts for 0.37% of the fund's net value, ranking as the fourth largest holding [2] - The estimated floating loss for the fund today is approximately 2,067 CNY [2] Fund Manager Performance - The fund manager of Guolian An Tianxin Flexible Allocation Mixed A (001359) includes Xue Lin, Wang Huan, and Yu Shanchao. As of the report, Xue Lin has a cumulative tenure of 13 years and 114 days, with the fund's total asset size at 6.036 billion CNY and the best fund return during the tenure at 81.74% [3] - Wang Huan has a cumulative tenure of 7 years and 307 days, with a total asset size of 913 million CNY and the best fund return during the tenure at 56.64% [3] - Yu Shanchao has a cumulative tenure of 1 year and 176 days, with a total asset size of 10.416 billion CNY and the best fund return during the tenure at 11.22% [3]
多只军工相关ETF涨超1%丨ETF基金日报
2 1 Shi Ji Jing Ji Bao Dao· 2025-10-29 03:21
Market Overview - The Shanghai Composite Index fell by 0.22% to close at 3988.22 points, with a daily high of 4010.73 points [1] - The Shenzhen Component Index decreased by 0.44% to 13430.1 points, reaching a maximum of 13572.9 points [1] - The ChiNext Index dropped by 0.15% to 3229.58 points, with a peak of 3282.33 points [1] ETF Market Performance - The median return of stock ETFs was -0.48% [2] - Among different categories, the highest return was from the Jiashi Zhongzheng 2000 ETF at 0.72%, while the highest return in the industry index category was from the Zhaoshang Zhongzheng All-Index Software ETF at 1.07% [2] - The top-performing thematic ETF was the Yifangda Zhongzheng Military Industry ETF, which returned 1.47% [2] ETF Gain and Loss Rankings - The top three ETFs by gain were: - Yifangda Zhongzheng Military Industry ETF (1.47%) - Penghua Zhongzheng National Defense ETF (1.46%) - Wanjia Guozheng Aerospace Industry ETF (1.44%) [4][5] - The top three ETFs by loss were: - Ping An Zhongzheng Hushen Hong Kong Gold Industry ETF (-3.74%) - Yongying Zhongzheng Hushen Hong Kong Gold Industry ETF (-3.69%) - ICBC Credit Suisse Zhongzheng Hushen Hong Kong Gold Industry ETF (-3.64%) [4][5] ETF Fund Flow - The top three ETFs by fund inflow were: - Huatai Bairui Hushen 300 ETF (14.87 billion yuan) - Huaxia Shanghai 50 ETF (14.34 billion yuan) - Huaxia Zhongzheng A500 ETF (8.97 billion yuan) [6][7] - The top three ETFs by fund outflow were: - Yifangda Shanghai Stock Exchange Sci-Tech Innovation Board 50 ETF (-3.52 billion yuan) - Yifangda ChiNext ETF (-3.12 billion yuan) - Huitianfu Zhongzheng Battery Theme ETF (-2.9 billion yuan) [6][7] ETF Margin Trading Overview - The top three ETFs by margin buying were: - Huaxia Shanghai Stock Exchange Sci-Tech Innovation Board 50 ETF (700 million yuan) - Guotai Junan Zhongzheng All-Index Securities Company ETF (540 million yuan) - Yifangda ChiNext ETF (535 million yuan) [8][9] - The top three ETFs by margin selling were: - Huatai Bairui Hushen 300 ETF (29.28 million yuan) - Huaxia Shanghai 50 ETF (19.16 million yuan) - Huaxia Zhongzheng 1000 ETF (15.01 million yuan) [8][9] Industry Insights - The satellite internet industry is seeing a clearer development path, with technological innovations in manufacturing and advancements in reusable rocket technology reducing launch costs and increasing capacity [10] - The modernization of national defense equipment is expected to accelerate, with improved order expectations and a concentration of product deliveries in the third and fourth quarters of 2025 [11]

东阳光股价涨5.03%,国联安基金旗下1只基金重仓,持有29.71万股浮盈赚取32.98万元
Xin Lang Cai Jing· 2025-10-28 03:39
Core Insights - Dongyangguang's stock increased by 5.03%, reaching 23.16 CNY per share, with a trading volume of 1.07 billion CNY and a turnover rate of 1.59%, resulting in a total market capitalization of 69.701 billion CNY [1] Company Overview - Guangdong Dongyangguang Technology Holdings Co., Ltd. was established on October 24, 1996, and listed on September 17, 1993. The company is located in Chang'an Town, Dongguan City, Guangdong Province [1] - The company's main business segments include electronic new materials, alloy materials, chemical products, and pharmaceutical manufacturing [1] - The revenue composition of the main business is as follows: high-end aluminum foil 40.81%, chemical new materials 27.63%, electronic components 25.40%, others (supplementary) 2.63%, energy materials 2.61%, and other categories 0.92% [1] Fund Holdings - According to data from the top ten holdings of funds, one fund under Guolianan Fund has a significant position in Dongyangguang. The Guolianan SSE Commodity ETF (510170) held 297,100 shares in the second quarter, accounting for 2.26% of the fund's net value, making it the largest holding [2] - The Guolianan SSE Commodity ETF (510170) was established on November 26, 2010, with a latest scale of 153 million CNY. Year-to-date returns are 35.67%, ranking 1396 out of 4218 in its category; the one-year return is 29.93%, ranking 1566 out of 3878; and since inception, the return is 48.64% [2]