阻力位
Search documents
Stock Of The Day: Jacobs Solutions Plunges — Where Could The Slide Finally Stop?
Benzinga· 2025-11-21 17:53
Core Viewpoint - Jacobs Solutions Inc. experienced a significant stock drop of nearly 11% after its earnings report, but it may have reached a bottom, leading to its designation as the Stock of the Day by technical analysts [1]. Group 1: Stock Performance and Support Levels - The stock's decline indicates a lack of demand to absorb the available supply, which can lead to a downtrend unless a support level is established [2]. - Support levels are created when there is sufficient demand from buyers, often due to remorseful sellers who wish to repurchase shares at previous sell prices [3]. - Jacobs' stock is currently trading near $129.50, a level that previously acted as resistance in May, which may now convert into a support level, suggesting a potential end to the selloff and a possible reversal [6]. Group 2: Historical Resistance and Support Dynamics - In July, the stock broke through a resistance level of $143.50, which later became a support level as remorseful sellers placed buy orders when the price returned to that level [6]. - Similarly, the $152 level served as resistance in August and transitioned to support in early July, illustrating the dynamic nature of resistance and support levels in stock trading [6].


11月3日【港股Podcast】恆指、小米集團、中海油、蔚來、快手、港交所
Ge Long Hui· 2025-11-04 19:51
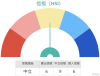
Group 1 - The Hang Seng Index (HSI) closed at 26,158 points, near the middle line of the Bollinger Bands at 26,163 points, indicating a potential for slight upward movement if trading volume increases [1][2] - Investors are divided, with bullish investors targeting levels between 26,300 and 26,500, while bearish investors see strong resistance at 26,200, predicting a potential drop of 300 points [1][2] - Current resistance is estimated at around 26,600 points, with a possibility of reaching 26,679 points if the index breaks through this level [2] Group 2 - Xiaomi's stock price rose slightly to 44.72 HKD, with a first resistance level at 48.1 HKD, and a potential upward movement towards 53.8 HKD if this level is breached [9][10] - Technical signals for Xiaomi show 11 buy signals and 6 sell signals, indicating a slightly positive short-term outlook [9][10] - The support level for Xiaomi is around 42.6 HKD, and if it falls below this, it could drop to 40 HKD [9][10] Group 3 - CNOOC's stock price closed at 20.46 HKD, close to the upper Bollinger Band, with a support level at 19.7 HKD [14] - If CNOOC's stock price drops below 19.7 HKD, it may further decline to 19.2 HKD [14] Group 4 - NIO's stock price increased to 56.9 HKD, with a resistance level at 59.9 HKD, and a potential rise to 63.2 HKD if this level is surpassed [18] - Investors are advised to choose options with a strike price about 10% out of the money and longer expiration dates for better safety [18] Group 5 - Kuaishou's stock price closed at 73.45 HKD, with a resistance level at 78.2 HKD, and a potential rise to 85.7 HKD if this level is broken [25][26] - Technical signals indicate 10 buy signals and 5 sell signals, suggesting a slightly positive short-term outlook [25][26] Group 6 - Hong Kong Exchanges and Clearing (HKEX) closed at 428.8 HKD, with a resistance level at 439 HKD, and a potential rise to 449 HKD if this level is breached [32] - Technical signals show 9 buy signals and 5 sell signals, indicating a slight preference for buying [32]

Stock Of The Day: Trading Opportunities In Albemarle?
Benzinga· 2025-10-27 16:42
Core Viewpoint - Albemarle Corporation's stock is experiencing a decline of over 6.3% on Monday, despite a previous rise and a new 'buy' recommendation from a brokerage firm, indicating potential low-risk trading opportunities for some traders [1]. Market Dynamics - Traders often look to buy stocks at two key market levels: just above resistance levels and just above support levels [2]. - Resistance is defined as a price level where strong selling interest exists, causing upward price movements to pause or end [3]. - A breakout occurs when buyers overpower sellers at a resistance level, leading to a bullish trend as buyers begin to outbid each other [4]. Technical Analysis - The $108 price level has been identified as a resistance point for Albemarle, with traders potentially looking to buy if this level is broken [5]. - Should the stock decline, support is anticipated around $97.30, a former resistance level that may convert to support as sellers regret their previous sales [7]. - Buying activity at support levels can lead to price rallies as anxious buyers compete to secure shares [8]. Trading Strategy - Understanding resistance and support levels is crucial for traders to make informed decisions on order placements, which can enhance trading profitability [9].

10月27日【港股Podcast】恆指、美團、百度集團、藥明康德、阿里、瑞聲科技
Ge Long Hui· 2025-10-27 13:11
Group 1 - The Hang Seng Index (HSI) is currently experiencing mixed investor sentiment, with some expecting it to challenge 26,800 points while others predict a drop to 26,100 points [1][2] - The resistance level for the HSI is estimated at around 26,900 points, while the support level is approximately 25,800 points [2] - Technical signals indicate a predominance of "strong sell" signals, with 12 sell signals and only 2 buy signals [3][6] Group 2 - Meituan's stock price has surpassed 100 HKD, closing at 102 HKD, and is currently above the middle line of the Bollinger Bands [10] - The technical signals for Meituan lean towards "sell," with 9 sell signals and 3 buy signals, suggesting a bearish outlook [10] - The resistance level for Meituan is around 106 HKD, with a potential next target of 110 HKD if it breaks through [10] Group 3 - Baidu's stock price closed at 125 HKD, close to the middle line of the Bollinger Bands, with a resistance level at approximately 132.5 HKD [16] - The technical signals for Baidu are also predominantly "sell," with 8 sell signals and 5 buy signals [20] - Investors are advised to consider the exercise price of options carefully, with recommendations to choose options closer to the current stock price for better alignment with market movements [17] Group 4 - WuXi AppTec's stock has shown strong performance, breaking through the middle line of the Bollinger Bands, with a resistance level at around 123.6 HKD [23] - The stock's trading volume has increased significantly compared to the past 10 trading days, indicating positive market sentiment [23] Group 5 - Alibaba's stock closed at 173.6 HKD, with a resistance level at 180.6 HKD and a potential next target of 189.7 HKD [30] - The technical signals for Alibaba are predominantly "sell," with 9 sell signals and 3 buy signals, indicating a cautious outlook [30] - The support level for Alibaba is around 164.4 HKD, with a potential drop to 157.5 HKD if it breaks below this level [30] Group 6 - AAC Technologies' stock closed at 40.88 HKD, above the 40 HKD mark, but still below the middle line of the Bollinger Bands [36] - The technical signals for AAC Technologies are slightly more favorable, with a majority of buy signals [36] - Investors are advised to consider waiting for lower entry points, with a support level at approximately 38.8 HKD [36]

10月16日【港股Podcast】恆指、比亞迪電子、小米、神華、舜宇科技、嗶哩嗶哩
Ge Long Hui· 2025-10-17 11:52
Group 1: Hang Seng Index (HSI) - The Hang Seng Index (HSI) experienced a slight decline of approximately 22 points, closing at 25,888 points, indicating a lack of clear market direction among investors [1] - Investors are divided, with some bullish investors waiting for the index to reach 26,250 points to fill the gap, while bearish investors anticipate a drop to the 25,200-25,400 range [1] - Current technical signals show a "neutral" market, with an equal number of buy and sell indicators, suggesting no clear trend [2] Group 2: BYD Electronics (00285) - BYD Electronics has seen an increase in trading volume over the past two days, indicating potential buying interest, with a resistance level around 43 HKD [8] - The stock is currently in a "neutral" technical state, similar to the HSI, with no clear direction indicated by the technical signals [8] - If the stock continues to rise, it may challenge the 43 HKD level, while a pullback could see it drop to the 38-39 HKD range [8] Group 3: Xiaomi Group (01810) - Xiaomi's stock has been on a downward trend, reaching a low of 47.32 HKD, but technical signals currently show a "buy" bias with 10 buy signals against 5 sell signals [14] - The short-term resistance level is around 52.7 HKD, while the support level is at 45.8 HKD, with a potential drop to 39.9 HKD if the support is breached [14] - The market sentiment is mixed, with both bullish and bearish perspectives present [14] Group 4: China Shenhua (01088) - China Shenhua's stock has performed well recently, closing at 40.98 HKD, but is considered to be at a relatively high level, with an RSI of 86 indicating overbought conditions [20] - Technical signals suggest a "sell" bias with 8 sell signals and 5 buy signals, indicating a potentially weaker trend [20] - The current resistance level is around 42.2 HKD, with a support level at 39.5 HKD [20] Group 5: Sunny Optical Technology (02382) - Sunny Optical has shown a rebound over the past two days but remains at low levels, with no clear reversal signals yet [26] - Technical analysis indicates a "buy" bias with 8 buy signals and 5 sell signals, suggesting a slightly stronger outlook [26] - The resistance level to watch for a potential rise to 88 HKD is around 85.4 HKD, with a possibility of reaching 89.7 HKD if this level is surpassed [26] Group 6: Bilibili (09626.HK) - Bilibili's stock has recently rebounded, closing at 212 HKD, approaching the middle line of the Bollinger Bands at around 215 HKD [30] - Current technical signals are "neutral," indicating no clear direction, and investors are advised to wait for further analysis [30] - The first support level is around 199 HKD, with a potential drop to 188 HKD if this level is breached [30]
Stock Of The Day: Reversal Time For Albemarle?
Benzinga· 2025-10-10 17:07
Core Viewpoint - Albemarle Corporation (NYSE:ALB) is currently experiencing bearish momentum, with the stock stalling at a resistance level, indicating a potential reversal and decline in price [1][2]. Group 1: Resistance Levels - Resistance is defined as a price level where there is a significant number of shares available for sale, which can halt or reverse an uptrend [3][6]. - The $108 level served as support from November 2023 to April 2024, but once it was broken, it became a resistance point when the stock returned to this price in November 2024 [8]. - In January 2025, Albemarle encountered resistance at $97.30, where regretful buyers from previous peaks placed sell orders, reinforcing the resistance [9][10]. Group 2: Market Psychology - Buyer remorse plays a crucial role in forming resistance levels, as those who regret their purchase decisions may sell at breakeven, creating selling pressure at certain price points [7][10]. - Understanding where resistance levels are located allows traders to develop effective exit strategies, highlighting the psychological aspects of market behavior [10].

证券小知识:什么是阻力位?怎么看待阻力突破?
Sou Hu Cai Jing· 2025-10-06 01:21
Core Insights - Resistance levels are price points where upward movement may face selling pressure, leading to potential price pullbacks or consolidations [1] - The formation of resistance levels is influenced by previous highs, dense trading areas, or psychological price points, reflecting collective market behavior and expectations [1] - Resistance levels are not static and can shift based on market sentiment, capital flows, and fundamental changes [1] Group 1 - Identifying resistance levels helps in formulating appropriate trading strategies, advising caution near resistance areas to avoid impulsive buying [1] - Effective breakthroughs of resistance levels are characterized by significant volume increases and sustained price levels above the resistance, indicating a potential transition to an upward trend [1] - False breakouts may occur with brief price spikes followed by quick declines, often driven by short-term emotions or news, necessitating vigilance against pullback risks [1] Group 2 - Technical analysis tools, including resistance levels, possess probabilistic characteristics and should not be the sole basis for decision-making [2] - Investors are encouraged to consider macroeconomic conditions, industry trends, and company valuations to respond rationally to market fluctuations [2]
突破關鍵阻力!舜宇光學輪證策略全解析
Ge Long Hui· 2025-09-24 11:43
Group 1 - The stock price of Sunny Optical Technology (02382) reached a high of 88.35 HKD, successfully breaking through key resistance levels at 81.79 HKD (10-day moving average) and 80.87 HKD (30-day moving average), indicating a bullish trend [1] - The Relative Strength Index (RSI) is at 61, suggesting it is not yet in the overbought territory, while other indicators like the stochastic oscillator and MACD are signaling buy opportunities [1] - The stock has shown significant volatility with a 5-day price fluctuation of 9.8%, presenting both opportunities and risks for short-term traders [2] Group 2 - Recent market performance of related products has been strong, with UBS warrants (64956) surging 40% in two days due to a 6.29% increase in the underlying stock, indicating investor optimism in the optical sector [4] - Current resistance levels for Sunny Optical are at 92.4 HKD and 93.9 HKD, while support is seen at 81 HKD, with potential downside to 79.2 HKD if the support is breached [2] - Investors are advised to consider various warrant strategies, with UBS call warrants (15320) offering a leverage of 5.6 times and a strike price of 95.93 HKD, suitable for those expecting further price increases [4][6]

9月22日【港股Podcast】恆指、舜宇、山東黃金、中芯、藥明生物、聯想
Ge Long Hui· 2025-09-23 07:40
Group 1: Market Overview - The Hang Seng Index closed at 26,344 points, with short-term technical signals indicating a "buy" but not a "strong buy" [1] - Resistance levels are identified at 26,840 points and 27,500 points, while support levels are at 25,700 points and 25,000 points [1] - Investors are advised to consider the premium levels of products, as high premiums can affect purchase prices [1] Group 2: Company Analysis - Sunny Optical Technology (02382.HK) - Sunny Optical's stock rose to a high of 87.7 HKD, closing at 87 HKD, breaking through the upper Bollinger Band [3] - Current technical signals suggest a "sell" with slight bearish sentiment, and the first resistance level is at 91.2 HKD [3] - Investors are encouraged to compare options with a 2%-3% out-of-the-money range for better leverage [3] Group 3: Company Analysis - Shandong Gold (01787.HK) - Shandong Gold's stock closed at 38.26 HKD, showing significant gains over the past two days [6] - Current technical signals indicate a "sell," with resistance levels at 40.6 HKD and 43.1 HKD, and support levels at 33.4 HKD and 30.6 HKD [6] Group 4: Company Analysis - SMIC (00981.HK) - SMIC's stock reached a high of 74.05 HKD, with current technical signals summarizing as "sell" [9] - Support levels are noted at 64.7 HKD and 58.6 HKD, with a recommendation for safer options around 58-59 HKD [9] Group 5: Company Analysis - WuXi Biologics (02269.HK) - WuXi Biologics' stock peaked at 40.2 HKD, closing at 40.08 HKD, with short-term technical signals indicating a "sell" [12] - Resistance levels are at 42.1 HKD and 43.8 HKD, while support levels are at 36.8 HKD and 33.6 HKD [12] Group 6: Company Analysis - Lenovo Group (00992.HK) - Lenovo's stock closed at 12.2 HKD, with technical signals summarizing as "sell" and short-term outlook being pessimistic [15] - Resistance levels are at 12.6 HKD and 13.4 HKD, with support levels at 11.5 HKD and 11 HKD [15]

9月5日【港股Podcast】恆指、華虹、美團、比亞迪、神華、舜宇
Ge Long Hui· 2025-09-05 20:08
Group 1: Hang Seng Index (HSI) - Investors remain optimistic about the Hang Seng Index, expecting it to challenge 26,000 next week, with a buyback price of 24,800 for bull certificates [1] - Short-term technical signals indicate a "sell" recommendation, with bearish signals prevailing; support at 25,000 and resistance at 25,700 and 26,100 [1] - Cautious investors are advised to choose products with a buyback price below the second support level of 24,733 [1] Group 2: Hua Hong Semiconductor (01347.HK) - The stock price closed at 47.58, with investors holding call options with an exercise price of 48; short-term signals indicate a "buy" [7] - Resistance levels are identified at 52.8 and 56.6, with a recommendation to consider options with an exercise price of 50, which is slightly out of the money [7] Group 3: Meituan-W (03690.HK) - The stock price has been trading between 98 and 104 for two weeks, with a closing price of 103; the recommendation is a "buy" [9] - Resistance levels are at 118.9 and 119.1; caution is advised for investors holding options with an exercise price of 158, as it is significantly out of the money [9] Group 4: BYD Company (01211.HK) - The stock is viewed as a strong buy, with potential for a rebound; support levels are at 102.3 and 95.9 [14] - Investors are considering bullish certificates with a target of 100 [14] Group 5: China Shenhua Energy (01088.HK) - The stock has closed above the middle line of the Bollinger Bands, but the overall signal is a "sell" [18] - Support levels are at 35.2 and 34.5, which investors should consider [18] Group 6: Sunny Optical Technology (02382.HK) - The stock is below the middle line of the Bollinger Bands; the recommendation is a "buy" [24] - Resistance levels are at 83.4 and 87.6, with short-term support at 75.9 and 71.2 [24]
