市盈率
Search documents
Price Over Earnings Overview: REV Group - REV Group (NYSE:REVG)
Benzinga· 2025-10-24 16:00
Core Viewpoint - REV Group Inc. (NYSE:REVG) has experienced a stock price of $59.88, reflecting a 0.75% decline in the current market session, but has seen a significant increase of 7.10% over the past month and an impressive 116.52% over the past year, raising questions about potential overvaluation despite current performance issues [1]. Group 1: Stock Performance - The current stock price of REV Group is $59.88, down by 0.75% in the current session [1]. - Over the past month, the stock has increased by 7.10% [1]. - In the past year, the stock has surged by 116.52% [1]. Group 2: P/E Ratio Analysis - REV Group has a P/E ratio of 28.46, which is higher than the Machinery industry average P/E ratio of 21.19, suggesting that investors may expect better future performance from REV Group compared to its peers [6]. - A higher P/E ratio may indicate that the stock is overvalued, although it could also reflect investor optimism regarding future performance and potential dividend increases [5][6]. Group 3: Investment Considerations - The P/E ratio is a useful metric for evaluating market performance but should be interpreted cautiously, as a low P/E can indicate undervaluation or weak growth prospects [8]. - Investors should consider the P/E ratio alongside other financial metrics, industry trends, and qualitative factors for a comprehensive analysis of a company's financial health [8].


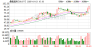
每日钉一下(港股科技股上涨后市盈率仍然较低,还在低估吗?)
银行螺丝钉· 2025-10-24 13:59
Group 1 - The article emphasizes that different regional stock markets do not move in unison, and understanding multiple markets can provide investors with more opportunities [2] - Global investment can significantly reduce volatility risk, and the article suggests a free course on investing in global stock markets through index funds [2][3] - The course includes notes and mind maps to help participants quickly grasp the course content and learn more efficiently [3] Group 2 - The article discusses the current valuation of Hong Kong technology stocks, noting that despite recent price increases, their price-to-earnings (P/E) ratios remain relatively low [4] - As of October 16, 2025, the P/E ratio percentile for the Hong Kong technology index is around 30%, while the price-to-book (P/B) ratio percentile is about 60% [5] - The article attributes the low P/E and high P/B ratios to a period of poor fundamentals and declining earnings for listed companies from 2020 to 2023 [5][6] Group 3 - In 2024, Hong Kong technology stocks are expected to see a recovery, with earnings projected to grow over 100% year-on-year in the first half of 2024-2025, marking the highest growth rate in five years [6] - The rapid increase in earnings leads to a quick decline in both the P/E ratio and its percentile ranking [7] - Despite the growth in earnings, revenue and net assets have increased but not at the same rate, resulting in a normalization of the P/E and P/B ratios as the index rises from its lows [7] Group 4 - The article questions the sustainability of the recent earnings growth, suggesting that it is unlikely for technology companies to maintain such high growth rates for multiple years [8] - The recent surge in earnings is attributed to cost-cutting measures, such as layoffs and salary reductions, as well as investment gains from asset sales [9]

Principal Financial Group, Inc. (NASDAQ:PFG) Earnings Preview: Key Insights
Financial Modeling Prep· 2025-10-24 10:00
Core Insights - Principal Financial Group, Inc. is set to report earnings per share (EPS) of $2.18, reflecting a 23.8% increase year-over-year, with projected revenues of approximately $4.14 billion, marking a 7.8% growth [1][2][5] Financial Performance - The anticipated EPS increase is attributed to enhanced premiums and fee income, contributing significantly to the company's financial standing [2] - Projected revenues are driven by an increase in average assets under management (AUM) and improved investment yields [2][5] Market Sentiment - The Zacks Consensus Estimate for PFG's earnings has seen a slight upward adjustment of 0.4%, indicating positive market sentiment [3] - The company's price-to-earnings (P/E) ratio is 15.62, and the price-to-sales ratio is 1.17, reflecting the market's assessment of its earnings and sales potential [3] Financial Health - PFG maintains a solid financial position with a debt-to-equity ratio of 0.35, indicating a balanced approach to leveraging [4][5] - The durability of stock price adjustments post-earnings announcement will depend on management's commentary regarding business conditions during the earnings call [4]

VeriSign, Inc. (NASDAQ: VRSN) Q3 Earnings Overview
Financial Modeling Prep· 2025-10-24 04:00
Core Insights - VeriSign, Inc. reported Q3 earnings with an EPS of $2.27, slightly above the forecast of $2.25, and revenue of $419.1 million, exceeding expectations of $416.8 million [1][5] Financial Performance - The reported revenue of $419.1 million represents a 7.3% growth from the same quarter in 2024, indicating a positive growth trajectory for the company [2] - Operating income increased to $284 million from $269 million in the previous year, reflecting operational efficiency [2] Market Valuation - The company has a price-to-earnings (P/E) ratio of 29.40, indicating investor confidence in future growth [3] - The price-to-sales ratio stands at 14.65, and the enterprise value to sales ratio is 15.57, suggesting a strong market valuation relative to revenue [3] Cash Flow and Financial Health - The enterprise value to operating cash flow ratio is 25.43, indicating how the market values the company's cash flow from operations [4] - Despite a negative debt-to-equity ratio of -0.90, VeriSign maintains an earnings yield of 3.40%, reflecting potential shareholder returns [4] - The current ratio of 0.54 may indicate challenges in meeting short-term liabilities with available assets [4]

HCA Healthcare, Inc. (NYSE:HCA) Earnings Preview: A Closer Look at the Upcoming Q3 2025 Results
Financial Modeling Prep· 2025-10-24 00:00
Core Viewpoint - HCA Healthcare is preparing to release its third-quarter 2025 earnings, with expectations of stable earnings and revenue growth driven by patient volume increases and favorable payor mix [1][2][3][6] Financial Expectations - The company is expected to report earnings per share (EPS) of $5.65 and revenue of approximately $18.56 billion, while analysts project adjusted EPS of $5.72 and sales of $18.57 billion [1][2][6] - EBITDA is anticipated to meet or slightly exceed estimates, supported by a 2-3% increase in patient volumes [2][3] Operational Insights - A favorable payor mix is expected to benefit HCA, with lower-reimbursing payors remaining subdued [3] - Contributions from SDP/DPP and potential recognition of Texas CHIRP funds could boost annualized EBITDA by $150-$175 million [3] Financial Metrics - HCA's financial metrics include a price-to-earnings (P/E) ratio of approximately 17.84 and a price-to-sales ratio of about 1.42 [4][6] - The enterprise value to sales ratio is around 2.04, and the enterprise value to operating cash flow ratio is approximately 12.44 [4] - The company's earnings yield is about 5.61%, and its debt-to-equity ratio is approximately -10.55, indicating a significant level of debt compared to equity [5][6] - HCA's current ratio of around 0.98 suggests its ability to cover short-term liabilities with short-term assets [5]

鼎泰高科:2025年前三季度净利润2.82亿元 同比增长63.94%
Zhong Guo Zheng Quan Bao· 2025-10-23 14:06
Core Insights - The company reported a total revenue of 1.457 billion yuan for the first three quarters of 2025, representing a year-on-year growth of 29.13% [4] - The net profit attributable to shareholders reached 282 million yuan, with a year-on-year increase of 63.94% [4] - The net profit after deducting non-recurring gains and losses was 263 million yuan, showing a significant growth of 79.94% year-on-year [4] Financial Performance - The basic earnings per share (EPS) for the reporting period was 0.69 yuan, and the weighted average return on equity (ROE) was 10.75% [4][17] - The net cash flow from operating activities was 22.01 million yuan, which represents a decline of 89.05% compared to the previous year [4][20] - The company’s total assets at the end of the reporting period were approximately 4.056 billion yuan, an increase from the previous year [5] Profitability Metrics - The weighted average return on equity increased by 3.59 percentage points year-on-year [17] - The return on invested capital for the first three quarters of 2025 was 9.68%, up by 2.87 percentage points from the same period last year [17] Asset and Liability Changes - The company’s trading financial assets decreased by 23.26% compared to the end of the previous year, while fixed assets increased by 4.04% [23] - Accounts receivable increased by 25.98%, and construction in progress rose by 69.95% [23] - Short-term borrowings increased by 104.32%, and long-term borrowings rose by 139.2% compared to the previous year [26] Liquidity Ratios - The current ratio was reported at 2.06, and the quick ratio was 1.64 [29] Valuation Metrics - The current price-to-earnings (P/E) ratio is approximately 114.62, the price-to-book (P/B) ratio is about 14.54, and the price-to-sales (P/S) ratio is around 20.24 [5]
南华期货:2025年前三季度净利润3.51亿元
Sou Hu Cai Jing· 2025-10-23 11:02
Core Viewpoint - The company reported a decline in revenue and net profit for the third quarter of 2025 compared to the same period last year, indicating potential challenges in its financial performance. Financial Performance - Operating revenue for the current period was approximately 3.47 billion, a decrease of 0.98% compared to the previous year [1] - Net profit attributable to shareholders was approximately 1.20 billion, down 6.21% year-on-year [1] - Basic and diluted earnings per share were both 0.20, a decrease of 4.76% from the previous year [1] - The weighted average return on equity was 2.76%, a decrease of 0.42 percentage points compared to the previous year [1] Cash Flow - The net cash flow from operating activities was approximately 72.7 billion, an increase of 7.51% year-on-year [25] - The net cash flow from financing activities was approximately 8.08 million, an increase of 4.3 billion compared to the previous year [25] - The net cash flow from investing activities was -2.87 billion, compared to 0.23 billion in the same period last year [25] Asset and Liability Changes - As of the end of the third quarter of 2025, cash and cash equivalents increased by 17.09% compared to the end of the previous year, while the proportion of total assets decreased by 7.42 percentage points [32] - The company's payable margin increased by 34.66%, with its proportion of total assets rising by 2.28 percentage points [35] - The total assets at the end of the reporting period were approximately 64.08 billion, compared to 48.86 billion at the end of the previous year [1] Shareholder Structure - The top ten shareholders included a new shareholder, Xu Fengling, who replaced Sun Guodong from the previous quarter [40] - Yang Rele's shareholding increased, while several institutional investors reduced their holdings [40] Valuation Metrics - As of October 23, the company's price-to-earnings ratio (TTM) was approximately 29.39, the price-to-book ratio (LF) was about 3.02, and the price-to-sales ratio (TTM) was around 2.36 [1]

长虹美菱:2025年前三季度净利润4.88亿元
Sou Hu Cai Jing· 2025-10-22 13:55
Financial Performance - The company's operating revenue for the reporting period is approximately 7.32 billion yuan, a decrease from 7.81 billion yuan in the same period last year [1] - The net profit attributable to shareholders is approximately 711.19 million yuan, down from 1.15 billion yuan year-on-year [1] - The net profit after deducting non-recurring gains and losses is approximately 599.81 million yuan, compared to 818.37 million yuan in the previous year [1] - Basic and diluted earnings per share are both 0.0692 yuan, a decrease of 3% from the previous year [1] - The weighted average return on equity is 1.16%, down from 1.96% year-on-year [1] Cash Flow and Assets - The net cash flow from operating activities for the first three quarters of 2025 is approximately 1.345 billion yuan, a decrease of 51.17% year-on-year [23] - The total assets at the end of the reporting period are approximately 24.06 billion yuan [1] - The company's cash and cash equivalents decreased by 12.45% compared to the end of the previous year [31] Shareholder Structure - As of the end of the third quarter of 2025, new shareholders include the Social Security Fund 1106 Combination and Wang Jialing, replacing previous shareholders [42] - The largest shareholder, Sichuan Changhong Electric Co., Ltd., holds approximately 24.12% of the total shares, unchanged from the previous period [43] Valuation Metrics - As of October 22, the company's price-to-earnings ratio (TTM) is approximately 11.28 times, the price-to-book ratio (LF) is approximately 1.19 times, and the price-to-sales ratio (TTM) is approximately 0.24 times [1]

Robert Half International Inc. (NYSE:RHI) Earnings Preview and Financial Ratios Insight
Financial Modeling Prep· 2025-10-22 06:00
Core Insights - Robert Half International Inc. (RHI) is a leading firm in the talent solutions and business consulting industry, recognized as the world's first and largest specialized company in this sector [1] - The company is scheduled to release its third-quarter 2025 earnings on October 22, with analysts predicting an earnings per share (EPS) of $0.43 and revenue of $1.36 billion [1] Financial Metrics - RHI has a price-to-earnings (P/E) ratio of 17.49, indicating the market's valuation of its earnings [3] - The price-to-sales ratio is 0.57, reflecting investor willingness to pay per dollar of sales [3] - The enterprise value to sales ratio is 0.54, which takes into account the company's debt and cash [3] - The enterprise value to operating cash flow ratio is 8.75, showcasing RHI's cash flow generation relative to its valuation [4] - The earnings yield stands at 5.72%, providing shareholders with insight into their return on investment [4] - RHI maintains a low debt-to-equity ratio of 0.19, indicating conservative use of debt [4] - The current ratio is 1.57, suggesting good liquidity to cover short-term liabilities [4]

Insights into Travel + Leisure Co's (TNL) Upcoming Quarterly Earnings
Financial Modeling Prep· 2025-10-21 15:00
Core Insights - Travel + Leisure Co (TNL) is set to release its quarterly earnings on October 22, 2025, with expected earnings per share of $1.74 and projected revenue of approximately $1.03 billion [1][4] Financial Metrics - TNL has a price-to-earnings (P/E) ratio of 10.01, indicating the market's valuation of its earnings [2][4] - The price-to-sales ratio stands at 0.99, suggesting that the market value is closely aligned with its sales [2][4] - The enterprise value to sales ratio is 2.37, reflecting the company's total valuation in relation to its sales [2] - The enterprise value to operating cash flow ratio is 15.58, showing the company's valuation relative to its cash flow from operations [3] - TNL has an earnings yield of 9.99%, indicating strong earnings generation per dollar invested [3] - The company has a negative debt-to-equity ratio of -6.56, suggesting more liabilities than equity [3] - TNL maintains a robust current ratio of 3.48, demonstrating its ability to effectively cover short-term liabilities [3][4]
