通信和其他电子设备制造业
Search documents
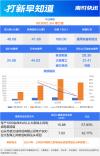
风电齿轮箱领军企业、苏州造价龙头申购,4只新股上市
2 1 Shi Ji Jing Ji Bao Dao· 2025-10-27 23:17
New IPOs and Listings - Two new stocks are available for subscription: Delijia (603092.SH) on the Shanghai Stock Exchange and Zhongcheng Consulting (920003.BJ) on the Beijing Stock Exchange [1] - Four stocks are listed today: Bibete (688759.SH), Xi'an Yicai (688783.SH), Heyuan Bio (688765.SH), and Taikaiying (920020.BJ) [1] Delijia (603092.SH) - Delijia specializes in the R&D, production, and sales of high-speed heavy-load precision gear transmission products, primarily for wind power generation [2][7] - The IPO price is 46.68 CNY per share, with an institutional offering price of 47.68 CNY, and a market capitalization of 16.8 billion CNY [5] - The company has a projected market share of 10.36% globally and 16.22% in China for wind power transmission equipment by 2024, ranking third globally and second in China [7] - Delijia's revenue from onshore wind power is expected to be 36.25 billion CNY in 2024, accounting for 98.57% of its total revenue [7] Zhongcheng Consulting (920003.BJ) - Zhongcheng Consulting focuses on engineering consulting services and has ranked among the top five in Jiangsu Province for engineering cost consulting revenue from 2021 to 2024 [8][11] - The IPO price is 14.27 CNY per share, with a market capitalization of 1.4 billion CNY [11] - The company plans to invest 1.23 billion CNY in building an engineering consulting service network and 0.77 billion CNY in R&D and information technology [11] Taikaiying (920020.BJ) - Taikaiying is the first company in the mining and construction tire segment to be listed on the Beijing Stock Exchange, recognized as the "first tire stock" on the exchange [15][19] - The IPO price is 7.50 CNY per share, with a market capitalization of 750 million CNY [18] - The company holds the number one market share in the domestic market for large-tonnage crane tires [19] Xi'an Yicai (688783.SH) - Xi'an Yicai is a leading manufacturer of 12-inch silicon wafers, ranking first in China and sixth globally in terms of production capacity [21][22] - The IPO price is 8.62 CNY per share, with a market capitalization of 34.81 billion CNY [21] - The company has a projected capacity of 120,000 wafers per month by 2026, which will meet 40% of the demand in mainland China [22] Heyuan Bio (688765.SH) - Heyuan Bio focuses on the research and development of plant-derived recombinant protein expression technology and has developed several pharmaceutical products [33][38] - The IPO price is 29.06 CNY per share, with a market capitalization of 10.39 billion CNY [35] - The company plans to invest 19.09 billion CNY in the construction of a plant for recombinant human serum albumin and 7.94 billion CNY in new drug development [37]

招商证券王大为: 解码A股并购新周期 四大战略领域重塑价值坐标
Zheng Quan Shi Bao· 2025-10-27 21:24
"从延长产业链到切入新赛道,并购重组已然成为上市公司实现高质量发展的'助推器'。"近日,招商证 券投资银行委员会并购业务部负责人王大为在接受证券时报记者采访时表示,当前并购业务的机遇主要 来自政策红利与产业升级的共振。 中小市值企业并购领跑 自去年9月"并购六条"实施以来,全市场新增重大资产重组交易超过200单。政策工具创新也在释放市场 活力,已有案例显示,股份对价分期支付、简易审核程序等机制显著提升了交易效率,特别是市值超百 亿元且信息披露优质的公司享受到了审核流程精简的红利。 在王大为看来,当前A股并购交易的驱动因素主要有三类:一是战略转型,传统企业通过并购切入新赛 道;二是产业链延伸,上市公司通过横向或纵向整合强化核心竞争力;三是培育第二增长曲线,通过注 入优质资产拓展盈利增长点。 根据公开市场数据,按证监会二级行业统计,计算机、通信和其他电子设备制造业上市公司的重大资产 重组数量居于首位。不同规模的上市公司均有参与,但中小型市值企业(20亿—120亿元)表现得尤为 活跃,"因为既有扩张需求,又具备灵活决策机制"。 基于实操经验,王大为还勾勒了"最受买方青睐的资产"画像——首先,在行业属性上,高技术装备 ...
新股发行跟踪(20251027)
Dongguan Securities· 2025-10-27 09:16
Group 1: New Stock Performance - Two new stocks were listed last week (October 20-24), with an average first-day price increase of 263.20%[2] - Both new stocks had first-day gains exceeding 100%, specifically Chao Ying Electronics at 397.60% and Marco Polo at 128.80%[2][4] - The total fundraising amount for new stocks last week increased by 1.591 billion yuan compared to the previous week[3] Group 2: Weekly and Monthly Trends - The number of new stocks listed remained unchanged at 2 for the week of October 20-24, with no first-day price drops recorded[3] - For the week of October 13-17, the average first-day price increase was 325.18%, with two stocks showing gains over 100%[4] - Monthly data shows that from October 1 to October 24, 5 new stocks were listed, raising 3.653 billion yuan, with an average first-day increase of 305.31%[10]
国家统计局:1-9月份电力、热力生产和供应业利润同比增长14.4%
Guo Jia Tong Ji Ju· 2025-10-27 03:03
Core Insights - The total profit of industrial enterprises above designated size in China reached 53,732 billion yuan from January to September, reflecting a year-on-year increase of 3.2% [1] - The profit distribution among different types of enterprises shows that state-owned enterprises experienced a slight decline, while private and foreign-invested enterprises saw growth [1][2] Financial Performance - The total operating revenue for industrial enterprises was 1,020,846.7 billion yuan, with a year-on-year growth of 2.4%, and the operating costs were 873,426 billion yuan, increasing by 2.6% [2][9] - The profit margin for operating revenue was 5.26%, which is an increase of 0.04 percentage points compared to the previous year [2] Industry-Specific Performance - The mining industry reported a significant profit decline of 29.3%, while the manufacturing sector saw a profit increase of 9.9% [1][2] - Key industries with notable profit growth include electricity, heat production, and supply, which grew by 14.4%, and non-ferrous metal smelting and rolling, which increased by 14.0% [2][9] Asset and Liability Overview - As of the end of September, total assets of industrial enterprises amounted to 186,270 billion yuan, a year-on-year increase of 5.0%, while total liabilities reached 107,960 billion yuan, growing by 5.2% [2][3] - The equity of owners totaled 78,310 billion yuan, reflecting a growth of 4.7%, with an asset-liability ratio of 58.0%, up by 0.1 percentage points [2][3] Efficiency Metrics - Accounts receivable stood at 27,220 billion yuan, increasing by 5.7%, and finished goods inventory was 6,710 billion yuan, up by 2.8% [3] - The average collection period for accounts receivable was 69.2 days, an increase of 3.3 days year-on-year, while the turnover days for finished goods inventory were 20.2 days, up by 0.2 days [3]

国家统计局:1-9月汽车制造业利润同比增长3.4%
Guo Jia Tong Ji Ju· 2025-10-27 01:36
Core Insights - The profit growth of major industries in China from January to September shows a positive trend, with significant increases in several sectors [1] Industry Performance Summary - The electricity and heat production and supply industry experienced a profit increase of 14.4% year-on-year [1] - The non-ferrous metal smelting and rolling processing industry saw a profit growth of 14.0% [1] - The agricultural and sideline food processing industry reported a profit increase of 12.5% [1] - The computer, communication, and other electronic equipment manufacturing industry grew by 12.0% [1] - The electrical machinery and equipment manufacturing industry experienced an 11.3% profit increase [1] - The general equipment manufacturing industry saw an 8.4% growth in profits [1] - The special equipment manufacturing industry reported a profit increase of 6.8% [1] - The non-metallic mineral products industry experienced a profit growth of 5.1% [1] - The automobile manufacturing industry reported a profit increase of 3.4% [1] - The black metal smelting and rolling processing industry turned from loss to profit [1] - The petroleum, coal, and other fuel processing industry reduced its losses year-on-year [1] - The chemical raw materials and chemical products manufacturing industry saw a decline of 4.4% [1] - The textile industry reported a decline of 5.9% [1] - The oil and gas extraction industry experienced a decline of 13.3% [1] - The coal mining and washing industry faced a significant decline of 51.1% [1]
城记丨长三角前三季度经济“成绩单”出炉:沪苏浙皖全体跑赢全国增速
Xin Hua Cai Jing· 2025-10-26 13:48
Core Viewpoint - The Yangtze River Delta region demonstrates strong economic resilience and growth potential, contributing significantly to China's overall economic stability and high-quality development [1] Economic Performance - GDP totals for the Yangtze River Delta show Guangdong (10,517.7 billion), Jiangsu (10,281.1 billion) surpassing the 10 trillion mark, while Zhejiang (684.95 billion), Shanghai (407.21 billion), and Anhui (397.70 billion) also report substantial figures [2] - Economic growth rates in the region outpace the national average of 5.2%, with Zhejiang leading at 5.7%, followed by Shanghai at 5.5%, and both Jiangsu and Anhui at 5.4% [2] - Shanghai's service sector remains a key economic driver, with a growth rate of 5.9% in the tertiary industry, particularly in information technology services (15.5% growth) and finance (9.8% growth) [2] Domestic Demand and Consumption - The domestic market in the Yangtze River Delta shows a stable recovery with an emphasis on quality consumption, particularly in Zhejiang where smart consumption and green products are on the rise [3][4] - Retail sales of wearable smart devices and smartphones in Zhejiang increased by 105.6% and 62.6% respectively, while green appliances and new energy vehicles saw growth rates of 58.4% and 14.9% [3] - In Jiangsu, retail sales of home appliances and communication equipment grew by 16.9% and 17.4%, with green and smart appliances also seeing significant increases [3] New Quality Productivity - The Yangtze River Delta has made notable progress in cultivating new quality productivity, which is crucial for regional economic growth and industrial structure optimization [5] - Jiangsu's equipment manufacturing sector saw a 9.4% increase in value added, contributing 73.7% to the overall industrial growth, with significant growth in electronics and transportation equipment [5][6] - Zhejiang's digital economy and high-tech service sectors reported revenue growth of 13.3% and 12.9% respectively, with internet data services growing by 33.4% [6][7] Future Development Strategies - The Yangtze River Delta is focusing on project construction, investment, and industrial development to meet annual goals and the "14th Five-Year Plan" objectives [8][9] - Shanghai aims to enhance economic recovery through major projects and open cooperation, while Zhejiang emphasizes investment stability and market expansion [8][9] - Jiangsu's cities are prioritizing technology innovation and project execution, while Anhui is focusing on investment and project construction with a total investment of 332.38 billion for 587 major projects [9]
华联期货周报:中国前三季度GDP增长5.2%美国通胀低于预期-20251026
Hua Lian Qi Huo· 2025-10-26 13:09
Report Industry Investment Rating No relevant content provided. Core View of the Report - In Q3 2025, China's GDP grew 4.8% year-on-year and 1.1% quarter-on-quarter, with cumulative GDP growth of 5.2% in the first three quarters, indicating overall economic stability during structural adjustment [4]. - The tertiary industry (services) had a prominent supporting role, with a 5.6% year-on-year increase in added value in Q3, while the secondary and primary industries also showed growth [4]. - Exports remained resilient, consumption recovered moderately, and fixed - asset investment faced marginal pressure. Net exports contributed 24.5% to GDP growth in Q3, and retail sales showed a 3.0% year-on-year increase in September [4]. - Structural transformation deepened, with new - quality productivity accelerating implementation. The proportion of equipment and high - tech manufacturing in industrial added value increased, and the "Three New" economies continued to grow [4]. - In September 2025, real estate investment, new construction, and construction area declined year - on - year, but the completion end improved. Industrial production showed a strong recovery, with a 6.5% year - on - year actual increase in industrial added value [5]. - US inflation in September was lower than expected, strengthening the market's consensus that inflation is on a downward path and increasing the probability of Fed rate cuts [5]. Summary by Relevant Catalogs National Economic Accounting - GDP quarterly and annual growth rates of different industries from 2023 to 2025 are presented, showing the performance of various sectors, such as agriculture, industry, and services [7]. - The contribution rates and pulling effects of the three industries on GDP growth are analyzed through figures from 2013 - 2025 [8][9][12]. - The contribution of each component of GDP is detailed, including industries like agriculture, industry, and services from 2023 to 2025 [13]. Industry - Industrial added value data of different industries from 2019 - 2025 show the growth trends of industries such as mining, manufacturing, and high - tech industries [20][22]. - The production volume of major industrial products from 2024 - 2025 is provided, including energy, industrial raw materials, and finished products [24]. - Electricity generation data, including daily average and year - on - year growth rates, as well as the performance of thermal, hydro, and wind power, are presented [28]. - Industry electricity consumption data from 2024 - 2025 show the consumption situation of different industries, with some industries like manufacturing and high - tech manufacturing showing growth [31][32]. - Industrial enterprise profit data from January - August 2025 show the profit performance of different industries, with some industries like manufacturing and power supply showing growth and others like mining showing decline [35][39]. - Industrial enterprise inventory data as of August 2025 show that the overall finished - product inventory is stable with a slight decline, and the inventory of the mining industry has decreased significantly [46]. Price Index - In September 2025, China's CPI decreased 0.3% year - on - year, with food prices falling and non - food prices rising. The CPI components' year - on - year and month - on - month data from 2024 - 2025 are also provided [51][52]. - In September 2025, China's PPI decreased 2.3% year - on - year, with the decline narrowing. The PPI of different production and living materials and major industries from 2024 - 2025 are presented [58][61]. - The year - on - year and month - on - month changes in industrial producer purchase prices from 2024 - 2025 are provided, showing price changes in different material categories [62][63].
*ST亿通(300211)2025年三季报简析:营收上升亏损收窄,盈利能力上升
Sou Hu Cai Jing· 2025-10-24 22:31
Core Insights - *ST Yitong (300211) reported a significant increase in total revenue for Q3 2025, reaching 154 million yuan, a year-on-year increase of 171.87% [1] - The company experienced a reduction in net profit, reporting a loss of 18.65 million yuan, but this was an improvement of 37.2% compared to the previous year [1] - The gross margin improved by 19.08% year-on-year, reaching 38.26%, while the net margin also showed significant improvement, moving from -52.43% to -9.96% [1] Financial Performance - Total revenue for Q3 2025 was 66.16 million yuan, up 215.69% year-on-year [1] - The company's operating cash flow per share increased by 141.73%, reaching 0.07 yuan [1] - The total of selling, administrative, and financial expenses was 21.97 million yuan, accounting for 14.27% of revenue, a decrease of 17.47% year-on-year [1] Balance Sheet Changes - Accounts receivable increased significantly by 352.57%, reaching 165 million yuan [3] - Cash and cash equivalents decreased by 13.89%, totaling 235 million yuan [3] - Long-term receivables decreased by 36.95%, indicating a reclassification of certain receivables [3] Cash Flow Analysis - Net cash flow from operating activities increased by 141.73%, driven by higher cash receipts from sales [5] - Cash flow from investing activities improved by 57.51%, reflecting reduced cash payments for fixed assets [5] - Cash flow from financing activities saw a significant decline of 1653.55%, primarily due to increased debt repayments [5] Operational Insights - The increase in revenue was attributed to substantial growth in sensor and chip business, along with the consolidation of subsidiary Yunxi's revenue [5] - The company faced challenges with high sales expenses, which surged by 376.52% due to the inclusion of Yunxi's marketing costs [5] - The net profit margin showed improvement, but the company still reported a negative net profit, indicating ongoing operational challenges [5]

广东经济三季报:GDP增长4.1%,工业增速加快
2 1 Shi Ji Jing Ji Bao Dao· 2025-10-24 10:28
Economic Overview - Guangdong's GDP for the first three quarters reached 10,517.698 billion yuan, with a year-on-year growth of 4.1% [1] - The primary industry value added was 383.85 billion yuan, growing by 4.5%; the secondary industry value added was 3,927.075 billion yuan, growing by 2.7%; and the tertiary industry value added was 6,206.773 billion yuan, growing by 4.9% [1] Agricultural Sector - The total output value of agriculture, forestry, animal husbandry, and fishery in Guangdong increased by 4.9%, with early rice production up by 1.0% [2] - Vegetable and specialty agricultural products saw significant increases, with vegetable and edible fungus production up by 3.1%, and garden fruit production up by 6.3% [2] - Livestock production accelerated, with pig slaughter and pork production increasing by 4.6% and 4.7%, respectively [2] Industrial Sector - The industrial added value above designated size grew by 3.5%, an increase of 1.3 percentage points compared to January-August [3] - Key industries showed stability, with computer, communication, and other electronic equipment manufacturing growing by 7.5% [3] - New energy and high-tech products saw rapid production growth, with industrial robots and service robots increasing by 33.7% and 15.2%, respectively [3] Service Sector - The added value of the service industry grew by 4.9%, accelerating by 0.3 percentage points compared to the first half of the year [4] - The financial sector and transportation, storage, and postal services increased by 9.8% and 4.3%, respectively [4] - The information transmission, software, and IT services sector saw a revenue growth of 9.5% [4] Investment Trends - Fixed asset investment in Guangdong decreased by 14.1%, but equipment and tool purchases increased by 1.7% [5] - Infrastructure investments in rail transport, water transport, and air transport grew by 1.8%, 31.8%, and 28.9%, respectively [5] - Investment in research and development, internet services, and software services grew significantly, with internet services increasing by 81.2% [5] Consumer Market - Retail sales of consumer goods increased by 2.8%, with urban retail sales growing by 3.0% and rural retail sales by 0.9% [6] - Basic living and some upgraded consumption goods saw stable growth, with retail sales of food and daily necessities increasing by 10.8% and 7.6%, respectively [6] - Online retail sales through public networks grew by 16.2%, outpacing overall retail growth [6] Price Indices and Income - The Consumer Price Index (CPI) in Guangdong decreased by 0.3%, with a nominal increase in per capita disposable income of 4.4% [7] - Urban residents' disposable income was 51,187 yuan, growing by 3.9%, while rural residents' income was 22,308 yuan, growing by 5.5% [7] - The industrial producer price index (PPI) fell by 1.5%, indicating a decline in production costs [7] Future Outlook - The Guangdong Statistical Bureau noted that the external environment is becoming increasingly complex, and domestic demand remains insufficient [7] - Future efforts will focus on enhancing development momentum, stimulating market vitality, and expanding effective demand to consolidate economic recovery [7]
GDP同比增长4.1%,广东前三季度经济数据出炉
Nan Fang Du Shi Bao· 2025-10-24 10:16
Economic Overview - Guangdong's GDP for the first three quarters reached 10,517.698 billion yuan, with a year-on-year growth of 4.1% at constant prices [1] - The primary industry added value was 383.85 billion yuan, growing by 4.5%; the secondary industry added value was 3,927.075 billion yuan, growing by 2.7%; and the tertiary industry added value was 6,206.773 billion yuan, growing by 4.9% [1] Agriculture - The total output value of agriculture, forestry, animal husbandry, and fishery increased by 4.9%, with early rice production up by 1.0% [2] - Vegetable and edible fungus production rose by 3.1%, while garden fruit production increased by 6.3% [2] - Livestock production accelerated, with pig slaughter and pork production increasing by 4.6% and 4.7%, respectively [2] Industry - Industrial output value above designated size grew by 3.5%, an increase of 1.3 percentage points compared to January-August [3] - Key industries showed stability, with computer, communication, and other electronic equipment manufacturing growing by 7.5% [3] - New momentum industries, such as advanced manufacturing and high-tech manufacturing, saw value-added growth of 5.4% and 6.4%, respectively [3] High-tech and New Energy Products - Production of industrial robots, service robots, civilian drones, and 3D printing equipment increased by 33.7%, 15.2%, 44.8%, and 40.3%, respectively [4] - New energy vehicles and lithium-ion batteries for energy storage saw production growth of 24.6% and 37.6% [4] Services - The value added of the service industry grew by 4.9%, accelerating by 0.3 percentage points compared to the first half of the year [5] - The financial sector and transportation, storage, and postal services increased by 9.8% and 4.3%, respectively [5] - Revenue from the information transmission, software, and IT services sector grew by 9.5% [5] Investment - Fixed asset investment decreased by 14.1%, but equipment and tool purchases increased by 1.7% [6] - Infrastructure investments in railway, water, and air transport grew by 1.8%, 31.8%, and 28.9%, respectively [6] - Investment in research and development, internet services, and software grew by 12.7%, 81.2%, and 23.5% [6] Market Sales - Retail sales of consumer goods increased by 2.8%, with urban retail sales growing by 3.0% and rural retail sales by 0.9% [7] - Online retail through public networks grew by 16.2%, outpacing overall retail growth by 13.3 percentage points [8] Consumer Prices - The Consumer Price Index (CPI) decreased by 0.3%, with a narrowing decline compared to the first half of the year [9] - The Producer Price Index (PPI) fell by 1.5%, with a consistent decline in September [9] Income - Per capita disposable income reached 42,842 yuan, with a nominal growth of 4.4% [10] - Rural residents' income growth outpaced urban residents, with rural disposable income increasing by 5.5% [10]
