技術分析
Search documents
中移動短線博弈:技術指標暗藏哪些突破信號?
Ge Long Hui· 2025-10-20 21:04
Core Viewpoint - The article discusses the technical analysis of China Mobile's stock, highlighting its current price level and potential resistance and support points, indicating a critical juncture for the stock's movement [1][14]. Technical Analysis - China Mobile's current price is around 84.63 HKD, with a first support level at 82.1 HKD and a strong support at 78.8 HKD. A breakthrough above 88.5 HKD is necessary for further upward movement towards a target of 91.8 HKD [1]. - The moving averages show a convergence pattern, with MA10 at 85.54 HKD and MA30 at 86.56 HKD, suggesting a significant price change may be imminent [1]. - The RSI indicator is stable at 54, indicating neither overbought nor oversold conditions, leaving room for both bullish and bearish actions [1]. Mixed Technical Signals - Various technical indicators are sending mixed signals: the Williams and Stochastic indicators remain neutral, while the Momentum Oscillator gives a clear buy signal. The CCI indicator suggests a potential bottoming out, indicating a buying opportunity [3]. - The article raises questions about which of these conflicting signals holds the most value for investors [3]. Historical Performance of Derivatives - On October 14, a notable example was provided where the Citigroup call option (13110) surged by 10% over two trading days, outperforming the underlying stock's 1.18% increase. Similarly, HSBC's bull certificate (65285) rose by 15%, showcasing the explosive potential of derivatives in trending markets [3]. - Other notable performances included UBS's bull certificate (64731) with a 13% increase and Bank of China’s call option (25695) also rising by 13% [3]. Selected Product Strategies - The Bank of China call option (21277) offers a leverage of 11.6 times with an exercise price of 101.98 HKD, making it an attractive choice for bullish investors. UBS's call option (21344) also provides a leverage of 11.8 times, targeting the same price [5]. - For risk-sensitive investors, the China Securities put option (21480) is highlighted for its low premium and implied volatility, with an exercise price of 75.88 HKD. The Bank of China put option (21625) offers a leverage of 8.7 times, suitable for bearish outlooks [5]. Bull and Bear Certificates - Among bull certificates, UBS's (64731) stands out with a leverage of 12 times and a redemption price of 78 HKD, while HSBC's (65285) offers 10.8 times leverage with the same redemption price [10]. - In the bear certificate category, UBS's (56287) leads with a leverage of 9.1 times and a redemption price of 95 HKD, while Societe Generale's (57946) is noted for its lowest premium, also set at a redemption price of 95 HKD [10].


股價急彈但未破均線!小米呢波反彈能到50元嗎?
Ge Long Hui· 2025-10-20 19:55
Core Viewpoint - Xiaomi's stock price has experienced a significant decline, closing at 45.96 HKD, down 3.65% in a single day, with a trading volume of 12.297 billion HKD, indicating active market pressure and speculation for a rebound [1] Technical Analysis - The RSI indicator for Xiaomi is at 28, indicating an oversold condition, while stochastic oscillators and bullish-bearish strength indicators have generated buy signals [1] - Despite some indicators suggesting a potential bottoming out, MACD and Bollinger Bands still maintain sell signals, reflecting a tug-of-war between bulls and bears [1] - The stock price has fallen below short- to medium-term moving averages, but there is still a 59% probability of a rebound, with resistance levels at 51.3 HKD and 56.5 HKD, and support at 43.9 HKD, with a critical level at 37.8 HKD if it breaks below [1] Product Performance - Recent recommendations for warrants and structured products have yielded significant returns, with the Morgan Stanley bear certificate (64525) rising 43% and UBS bear certificate (64218) increasing by 39% over two days, while the underlying stock fell by 7.11% [1] - In the warrants category, UBS put warrant (14200) rose by 30% and Bank of China put warrant (14387) increased by 25%, showcasing effective leverage despite the stock's decline [1] Investment Products - For call options, Citibank call warrant (16253) has a leverage of 3.2 times with an exercise price of 52.93 HKD, while Bank of China call warrant (16221) has a leverage of 3.1 times, both offering good value [3] - For put options, UBS put warrant (14200) and Bank of China put warrant (14387) have exercise prices of 46.45 HKD, with leverage of 3 times and 2.9 times respectively, suitable for conservative investors [3] - In the bull certificates category, UBS bull certificate (67402) has an exercise price of 42 HKD with a leverage of 9.4 times, while HSBC bull certificate (66931) also has an exercise price of 42 HKD with high leverage [3] - For bear certificates, the top picks are Societe Generale bear certificate (65365) and UBS bear certificate (67343), both with a redemption price of 54 HKD, offering leverage of 6.7 times and 6.5 times respectively [3]

平保突破邊緣!中銀:內險股資金轉向,技術買點浮現
Ge Long Hui· 2025-10-17 12:57
Group 1 - The core viewpoint of the articles highlights the positive performance expectations for insurance stocks, particularly for New China Life Insurance and Ping An Insurance, with market anticipation for similar trends among peers [1][2]. - Ping An Insurance's stock price is currently trading within a tight range of 53.2 to 56.3 HKD, indicating potential for a breakout, although short-term adjustment pressures are noted due to a death cross formation in moving averages [2][3]. - Technical indicators such as RSI, CCI, and MACD are showing bullish signals, suggesting a possible upward movement in Ping An's stock price, with key support at 53.2 HKD and resistance at 56.3 HKD [2][3]. Group 2 - Recent performance of derivative products linked to Ping An has been strong, with notable increases in call warrants, indicating significant leverage returns when the underlying stock moves positively [3][6]. - The most attractive call warrant for Ping An offers a leverage of 10.2 times with an exercise price of 57.5 HKD, while bearish investors can consider put warrants with lower premiums and favorable implied volatility [6][10]. - The articles emphasize the importance of monitoring market dynamics and technical signals for making informed trading decisions, particularly in the context of low volatility in blue-chip stocks like Ping An [13].

BTC還能跌?比特幣止跌關鍵:收復這價位……
提阿非羅大人TiaBTC· 2025-10-16 17:25
Cryptocurrency Exchange Platforms - Bybit is highlighted as suitable for technical analysis [1] - Binance is mentioned for spot trading with up to 40% fee reduction [1] - OKX is noted as a reliable platform with low fees [1] - Bitget is promoted for copy trading, especially for beginners [1] Educational Resources and Community - Free one-month membership trial available upon registration and deposit (or reactivating old accounts) [1] - Customer support is available via Discord community (@tiahelper) [1] - Additional resources include a Twitter account, courses, and a Telegram channel [1] Market Analysis and Trading Strategies - Focus on technical analysis, including Dow Theory, Wave Theory, Fibonacci, Harmonic Patterns, and Natural Trading Theory [1] - Mentions of Gann Theory and references to classic trading literature like "Reminiscences of a Stock Operator" by Jesse Livermore [1] Cryptocurrency and Market Focus - Discussion of Bitcoin, Ethereum, and other cryptocurrencies like Dogecoin, Solana, Cardano, BNB, XRP, DOT, AVAX, LUNA, and UNI [1] - Mentions of Bitcoin contracts, options, and ETFs [1] - Includes hashtags related to Bitcoin halving in 2024, price predictions, and daily analysis [1]

芯片股雙雄技術對決:中芯華虹短線佈局全解析
Ge Long Hui· 2025-10-16 15:59
Core Viewpoint - The semiconductor sector, particularly companies like SMIC (00981) and Hua Hong Semiconductor (01347), is currently a market focus due to their recent merger and acquisition activities aimed at strengthening their positions in the industry [1][2]. Company Analysis SMIC (00981) - SMIC's stock price is fluctuating between 66.4 HKD and 84.3 HKD, with key support at 66.4 HKD and resistance at 84.3 HKD. A breakthrough above 84.3 HKD could target 89.6 HKD [2]. - Technical indicators show mixed signals: the RSI is at a neutral level of 50, while the stochastic oscillator indicates a buy signal, but the momentum indicator suggests a sell signal [2][6]. - Recent trading saw a significant drop of 10% in stock price, indicating potential for adjustment after reaching historical highs [1]. Hua Hong Semiconductor (01347) - Hua Hong's stock is trading within a wider range of 65.7 HKD to 91.6 HKD, with a bullish short-term trend indicated by the 10-day moving average being above the 30-day moving average [4]. - Key support is at 65.7 HKD, with resistance at 91.6 HKD, and a potential challenge to 105.6 HKD if the resistance is broken [4]. - The stock has shown a 31.2% volatility over the past five days, suggesting opportunities for short-term trading [4][15]. Derivative Products SMIC Derivatives - SMIC offers a variety of derivative products with high leverage, such as the Bank of China call option (21314) with a strike price of 134.7 HKD and a leverage of approximately 3 times [1]. - Other notable options include a call option with a strike price of 95.05 HKD and a leverage of 3 times, and a put option with a strike price of 75.88 HKD and a leverage of 2 times [1][6]. Hua Hong Derivatives - Hua Hong has fewer but distinctive derivative options, such as a call option with a strike price of 96.08 HKD and a leverage of 2.8 times, which is noted for its low premium and implied volatility [11]. - The put options available include one with a strike price of 70 HKD and a leverage of 1.9 times, reflecting a conservative risk management approach [11][15].

10月15日【港股Podcast】恆指、騰訊、匯豐、平安、吉利、港交所
Ge Long Hui· 2025-10-16 04:03
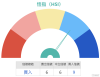
Market Overview - The Hong Kong stock market showed a slight recovery, closing at 25,910 points, just below the 26,000-point mark, leading to investor expectations for a potential breakthrough [1] - Bearish investors believe the index will not reach 26,000 points and are opting for bearish overnight positions, while some investors are taking long positions with a bullish outlook [1][3] Technical Signals - Current short-term signals lean towards "buy," with 9 buy signals and 6 sell signals, indicating a slightly positive sentiment [4] - Key support levels are identified at approximately 25,398 points and 24,600 points, with resistance at 26,500 points [4] Tencent Holdings (00700.HK) - Tencent's stock price closed at 627 HKD, showing a weak rebound, with concerns about insufficient upward momentum [7][9] - Short-term technical signals indicate a "buy" with 9 buy signals and 4 sell signals, but the stock faces resistance at 653 HKD and needs to break this level to target 668 HKD [9] HSBC Holdings (00005.HK) - HSBC's stock price rebounded slightly to 103 HKD, raising questions about whether this is a good entry point around the 100 HKD mark [10][12] - Technical signals show a "buy" with 8 buy signals and 7 sell signals, but caution is advised as support is at 99.6 HKD [12] Ping An Insurance (02318.HK) - Ping An's stock closed at 54.75 HKD, with investors questioning if 55 HKD is a significant resistance level [15][18] - The technical outlook is neutral, with 6 buy signals and 7 sell signals, indicating no clear trend [18] Geely Automobile (00175.HK) - Geely's stock price closed at 17.17 HKD, with a general bearish sentiment among investors who believe the rebound may end soon [21][24] - Technical signals show 8 sell signals and 6 buy signals, suggesting a bearish outlook with support at 18.4 HKD [24] Hong Kong Exchanges and Clearing (00388.HK) - The stock closed at 427.8 HKD, with investors speculating on whether it can stabilize above 430 HKD for further upward movement [27][30] - Current technical signals indicate a "buy" with 11 buy signals and 4 sell signals, suggesting potential for further gains if it breaks resistance at 442 HKD [30]
BTC反彈無力!漲完了嗎?ETH呢?可能去這……!
提阿非羅大人TiaBTC· 2025-10-15 17:39
朋友們,2025年 10月15日華爾街午盤時間 我們來更新比特幣的行情 這個是比特幣的日線圖 從日線級別來看 我們發現比特幣這兩天好像就是在回調 並沒有出現那種 大家都期待的這種 把下面的低點跌破了 是一個金坑 然後買入買入 然後再創新高的情況,目前還是沒有出現的 我們可以看到它是怎麼一步一步 走成這個樣子的 首先它把前面的高點來了一個假突破 然後把前面的這樣一些低點來了 一個假跌破收回 而且這樣一個低點 它不僅限於是原先這一帶的低點 我們可以看到這是平行的低點對不對 但是如果說你再往前面拉一下 看一看這是什麼 我們就可以看到 原先這一帶在這邊上漲上漲 然後盤整盤整然後跌到一個最低的地方 把前面的低點都出現了跌破 回補這一帶的缺口 然後迅速的有一根這樣的大陽線 給它站上去 這是日線級別的 我們就發現這樣的一根陽線 其實還沒有來測試過 那麼如果說這樣子一拉 我們就發現這樣的一次下跌 好像把這樣的一根大陽線 給它補充了一下 我會覺得這樣的一次反彈還是有根據的 雖然說當時是因為恐慌暴跌 或者說有一些合約倉位的清算 但是從技術分析來說 它也確實跌到了一個非常不錯的位置 那麼如果說出現反彈的話 那麼我會認為它會盤整一段 ...

10月10日【港股Podcast】恆指、騰訊、阿里、中移動、神華、京東
Ge Long Hui· 2025-10-12 11:23
Group 1: Hang Seng Index (HSI) - The market sentiment is bearish, with investors expecting the index to range between 25,700 and 25,800 next week, while some are optimistic about a rebound above 27,000 if it holds above 26,100 this week [1] - The Hang Seng Index closed at 26,290 points, breaking through the middle line of the Bollinger Bands, indicating a neutral short-term technical signal [1] - Support levels are identified at 25,833 and 25,500, with resistance at 27,000 [1] Group 2: Tencent Holdings (00700.HK) - Tencent's stock price closed at 651.5 HKD, falling below the middle line of the Bollinger Bands, with increased trading volume indicating a less favorable situation [8] - The technical signal is summarized as a "buy" with first support at 639 HKD and second support at 619 HKD [8] Group 3: Alibaba Group (09988.HK) - Alibaba's stock price closed at 165.4 HKD, also falling below the middle line of the Bollinger Bands, with a neutral technical signal [14] - Support levels are noted at 153 HKD and 142 HKD, with potential for the price to drop below 150 HKD [14] Group 4: China Mobile (00941.HK) - China Mobile's stock price closed at 84.8 HKD, showing a notable upward trend despite the overall market decline, with a "buy" signal [21] - Resistance levels are identified at 88.2 HKD and 91 HKD [21] Group 5: China Shenhua Energy (01088.HK) - China Shenhua's stock price closed at 39.56 HKD, having broken through the upper band of the Bollinger Bands, with a "sell" signal [24] - Resistance levels are at 40.3 HKD and 41.4 HKD, with a target price of 50 HKD mentioned by investors [24] Group 6: JD.com (09618.HK) - JD.com's stock price closed at 131.8 HKD, falling below the middle line of the Bollinger Bands, indicating a neutral outlook [31] - Support levels are at 127.1 HKD and 122.5 HKD, with potential for the price to drop to 125 HKD [31]

航空板塊異動:國航技術突破
Ge Long Hui· 2025-10-10 20:53
窩輪選擇上,行使價集中在5.77-7.53元,價外產品有7只。其中有3只產品的到期日過於短期,在10月底到期日。可選擇的產品有4只,其中包括瑞銀認購證 18259和花旗認購證20894以及摩通認購證18079和麥銀認購證29756,價外32%-35%,需要注意,產品的行使價比較高。如果擔心引伸波幅過高,可繼續等待 市場上新產品或等正股回落後再考慮。 | | | 從市場環境角度觀察,近期航空股受惠於旅遊需求復甦預期,加上國際油價走勢相對穩定,板塊投資情緒明顯改善。技術面上,國航若能穩守5.6元支持並 帶量突破5.87元關卡,下一目標有機會上看6.04元。然而,若大市出現調整,則需要警惕回落測試5.32元支持位的可能性。 据市场消息指10月1日全國民航運輸旅客247.49萬人次,創國慶假期歷史新高。中國國航股價近期展現出明確的上升動能,從技術走勢觀察,股價已成功突 破多條重要均線。根據最新數據,國航的短期均線MA10位於5.6元,不僅高於MA30的5.37元,也超越了MA60的5.4元,這種多頭排列的均線結構為股價提 供了穩健的技術支撐。今日股價上漲2.40%,報5.55元,進一步逼近關鍵阻力位5.87元,市場關 ...

技術面透視港交所:支持阻力位與突破訊號解讀
Ge Long Hui· 2025-10-10 20:13
Group 1 - The core viewpoint indicates that Hong Kong Stock Exchange (HKEX) is at a critical technical breakthrough moment, with the stock price consolidating around HKD 449.6, and short-term and medium-term moving averages (MA10 and MA30) positioned closely at HKD 443.98 and HKD 444.37 respectively, suggesting market energy accumulation [1][2] - The current price range is oscillating between HKD 441 and HKD 470, with both bulls and bears engaged in intense competition in this sensitive technical zone [1] - The analysis of support and resistance levels reveals that the primary support is at HKD 441, with a secondary support at HKD 437, while the key resistance level is at HKD 470, with the next target at HKD 476 [4] Group 2 - Technical indicators show a neutral RSI reading of 51, but several important indicators are beginning to emit positive signals, with a consensus "buy" rating from multiple indicators including stochastic, momentum, MACD, and Ichimoku [2] - The recent performance of structured products in the warrants market demonstrates significant leverage effects, with notable increases in prices of various warrants following a 1.87% rise in HKEX's stock [4] - In the warrants selection, HSBC's warrant 17538 offers a leverage of 9.6 times with a strike price of HKD 530.5, while Bank of China’s warrant 17568 provides a leverage of 9.3 times, both having the lowest premiums and implied volatilities among similar products [7]
