市销率
Search documents
合金投资:2025年前三季度净利润725.81万元 同比增长124.87%
Sou Hu Cai Jing· 2025-10-20 11:32
Financial Performance - The company's operating revenue for the reporting period is 657.12 million yuan, representing a year-on-year increase of 21.61% [1] - The net profit attributable to shareholders of the listed company is 26.82 million yuan, showing a significant increase of 4985.25% compared to the same period last year [1] - The net profit attributable to shareholders after deducting non-recurring gains and losses is 20.92 million yuan, up by 2787.02% year-on-year [1] - The basic and diluted earnings per share are both 0.0070 yuan, reflecting a remarkable increase of 6900.00% [1] - The weighted average return on equity is 1.37%, an increase of 1.34 percentage points [1] Cash Flow and Assets - The net cash flow from operating activities is 17.06 million yuan [1] - As of the end of the reporting period, total assets amount to 3.11 billion yuan, compared to 521.64 million yuan at the end of the previous year [1] - The equity attributable to shareholders of the listed company is 1.96 billion yuan, an increase from 1.89 billion yuan at the end of the previous year [1] Valuation Metrics - As of the market close on October 20, the company's price-to-earnings ratio (TTM) is approximately 167.2 times, the price-to-book ratio (LF) is about 13.37 times, and the price-to-sales ratio (TTM) is around 7.33 times [1] Shareholder Changes - The top ten circulating shareholders as of the end of the third quarter of 2025 include new shareholders such as Jiuzhou Hengchang Logistics Co., Ltd. and several individuals, replacing previous shareholders like Guanghui Energy Co., Ltd. and various international banks [39] - Jiuzhou Hengchang Logistics Co., Ltd. holds 79.88 million shares, accounting for 20.74% of the total share capital [40]

Comerica Incorporated (NYSE:CMA) Quarterly Earnings Preview
Financial Modeling Prep· 2025-10-16 12:00
Core Viewpoint - Comerica Incorporated (NYSE:CMA) is a leading financial services company focused on commercial banking, retail banking, and wealth management, primarily operating in the United States [1] Financial Performance Expectations - Comerica is set to release its quarterly earnings on October 17, 2025, with an estimated earnings per share (EPS) of $1.28 and projected revenue of approximately $844 million [2][6] - Analysts expect a 4% increase in revenues year-over-year, although earnings may decline due to rising expenses and a reduction in net interest income (NII) [2][6] Historical Performance - The company has historically surpassed earnings estimates in three of the last four quarters, indicating potential for another earnings beat [3][6] Financial Metrics - Comerica's price-to-earnings (P/E) ratio is approximately 14.31, indicating moderate market valuation of its earnings [4] - The price-to-sales ratio is about 2.08, reflecting the company's market value relative to its revenue [4] - The enterprise value to sales ratio stands at around 2.78, indicating how the company's sales are valued [4] Debt and Liquidity Ratios - The debt-to-equity ratio is approximately 1.27, showing the proportion of debt used to finance assets relative to shareholders' equity [5] - The current ratio is around 0.22, highlighting the company's ability to cover short-term liabilities with short-term assets [5]

Banner Corporation (NASDAQ:BANR) Exceeds EPS Estimates but Misses on Revenue
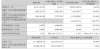
Financial Modeling Prep· 2025-10-16 06:00
Core Insights - Banner Corporation reported earnings per share (EPS) of $1.54, exceeding the estimated $1.41, while revenue of $168.7 million fell short of the projected $171.5 million [1][6] Financial Performance - The company's net income for Q3 2025 was $53.5 million, an increase from $45.5 million in the previous quarter [2] - Net interest income for Q3 2025 was $150 million, up from $144.4 million in the preceding quarter, indicating improved revenue generation from core banking activities [3] - The company raised its quarterly cash dividend by 4%, increasing it to $0.50 per share [3][6] Financial Metrics - The price-to-earnings (P/E) ratio is approximately 11.90, and the price-to-sales ratio is about 2.53 [4] - The enterprise value to sales ratio is around 2.90, while the enterprise value to operating cash flow ratio is approximately 9.01 [4] - The earnings yield stands at 8.40%, suggesting a good return on investment [4] Debt and Liquidity - The company's debt-to-equity ratio is 0.43, indicating a moderate level of debt compared to equity [5] - The current ratio is 0.04, suggesting limited short-term liquidity, which may raise concerns regarding the company's ability to cover short-term liabilities [5]

中科三环:预计2025年前三季度盈利8000万元-1亿元 同比扭亏
Zhong Guo Zheng Quan Bao· 2025-10-14 13:20
Core Viewpoint - The company Zhongke Sanhuan (000970) expects a significant turnaround in its financial performance for the first three quarters of 2025, projecting a net profit attributable to shareholders of between 80 million to 100 million yuan, compared to a loss of 42.05 million yuan in the same period last year [4][8]. Financial Performance - The projected net profit for the first three quarters of 2025 is between 80 million to 100 million yuan, with a non-recurring net profit expected to be between 60 million to 80 million yuan, compared to a loss of 62.09 million yuan last year [4][8]. - The basic earnings per share are estimated to be between 0.0665 yuan and 0.0831 yuan [4]. - The company reported a significant increase in exchange gains compared to the same period last year, and a substantial decrease in asset impairment losses [8]. Valuation Metrics - As of October 14, the company's price-to-earnings (P/E) ratio (TTM) is approximately between 115.92 and 133.22, with a price-to-book (P/B) ratio of about 2.76 and a price-to-sales (P/S) ratio of around 2.8 [4]. - Historical net profit and non-recurring profit figures indicate a recovery trend, with a notable increase in year-on-year growth rates for both metrics [9]. Business Strategy - The company is focusing on a strategy of steady progress and promoting stability through innovation and management optimization, while actively responding to market competition and external challenges [8]. - Measures such as cost reduction and efficiency improvement are being implemented to enhance market expansion efforts [8].

深圳燃气:2025年前三季净利9.18亿元 同比下降13.08%
Sou Hu Cai Jing· 2025-10-13 11:01
Core Insights - The company operates primarily in urban gas, gas resources, integrated energy, and smart services [8] Financial Performance - The company's total revenue and net profit have shown year-on-year growth, with total revenue growth rates reaching 42.62% [10] - The weighted average return on equity for the first three quarters of 2025 is 5.78%, a decrease of 1.29 percentage points compared to the same period last year [15] Valuation Metrics - The price-to-earnings ratio (P/E) is calculated as total market value divided by net profit, while the price-to-book ratio (P/B) is total market value divided by net assets [18] - The price-to-sales ratio (P/S) is used for companies with fluctuating profits, calculated as total market value divided by operating revenue [18]

Gerresheimer AG's Q3 2025 Earnings Overview
Financial Modeling Prep· 2025-10-12 01:00
Core Insights - Gerresheimer AG reported Q3 2025 earnings with an EPS of $0.90, slightly below the estimated $0.94, and actual revenue of approximately $655.4 million, missing the estimated $767.4 million [1][5] - The company revised its 2025 outlook downward, expecting a decline in organic revenues between 2% and 4% [2][5] Financial Performance - The price-to-earnings (P/E) ratio stands at 24.16, indicating market valuation of earnings [3] - The price-to-sales ratio is 0.70, suggesting market value relative to sales [3] - The enterprise value to sales ratio is 0.62, reflecting total value compared to sales [3] - The enterprise value to operating cash flow ratio is 5.65, providing insight into valuation relative to cash flow [4] - The earnings yield is 4.14%, indicating return on investment [4] - The current ratio is 1.01, showing the company's ability to cover short-term liabilities with short-term assets [4]

Stolt-Nielsen Limited's Financial Performance in Q3 2025
Financial Modeling Prep· 2025-10-08 15:00
Core Viewpoint - Stolt-Nielsen Limited, a leader in the transportation and storage of bulk liquids, reported mixed financial results for Q3 2025, with revenue exceeding expectations but earnings per share slightly below estimates [2][3][6] Financial Performance - The company achieved an earnings per share (EPS) of $1.15, slightly below the estimated $1.16, while revenue reached $700 million, surpassing the estimated $689.3 million [2][6] - Stolt-Nielsen reported a net profit of $64 million for Q3 2025, a decrease from $99.2 million in Q3 2024, with revenues also down from $732.8 million [3][6] - The consolidated EBITDA for Q3 2025 was $191.7 million, down from $215.2 million in the previous year [4] Division Performance - Stolt Tankers, a division of Stolt-Nielsen, reported an operating profit of $57.2 million, down from $107.1 million in Q3 2024 [4] Valuation Metrics - The company maintains a price-to-earnings (P/E) ratio of approximately 4.13, indicating a relatively low valuation compared to its earnings [4][6] - Stolt-Nielsen's price-to-sales ratio is about 0.61, suggesting the stock is priced at a fraction of its sales [5] - The enterprise value to sales ratio is around 1.47, reflecting the company's valuation in relation to its sales [5] - The earnings yield stands at 24.21%, indicating a substantial return on earnings relative to share price [5] - The current ratio is approximately 0.91, suggesting potential challenges in covering short-term liabilities with current assets [5]

科创50,为何一直暴涨,市盈率180
集思录· 2025-09-28 15:11
Core Insights - The article discusses the current valuation metrics of the market, highlighting the high price-to-earnings (P/E) ratio of 181.97, which is at the 99.04 percentile, indicating a significant overvaluation compared to historical averages [2][5]. - It emphasizes the speculative nature of the technology sector, particularly in the context of the Chinese market, where companies are often valued based on future potential rather than current earnings [6][9]. Valuation Analysis - The price-to-sales (P/S) ratio is noted at 7.34, while the price-to-book (P/B) ratio stands at 6.50, suggesting that the market is pricing in high growth expectations [1]. - The article mentions that the market's current valuation levels are driven by narratives and stories, with bull markets characterized by optimistic stories and bear markets by pessimistic ones [5][12]. Market Sentiment - There is a prevailing sentiment that the technology sector, particularly companies on the STAR Market, is experiencing a speculative bubble, with P/E ratios reaching extreme levels [6][8]. - The discussion includes the notion that the market is heavily influenced by retail investors, making it susceptible to manipulation and volatility [11]. Future Outlook - The article suggests that the future of the market is closely tied to technological advancements and self-sufficiency in critical sectors like semiconductors, which are deemed essential for national security [8][9]. - It posits that the current high valuations may not be sustainable in the long term, as market dynamics can shift rapidly based on investor sentiment and macroeconomic factors [12].

鲍威尔公开警告美股股指“相当高”,三大指标力挺
Jin Shi Shu Ju· 2025-09-25 02:56
Core Viewpoint - Federal Reserve Chairman Jerome Powell stated that the stock market is "fairly valued," which has caused significant reactions in the stock market [2] - Concerns about the sustainability of AI trading have also been attributed to the market's weakness [2] Valuation Metrics - The CAPE ratio, designed by economist Robert Shiller, has been rising since the bull market began, reaching just below 38 at the end of August, a level not seen since the end of 2021 [4] - The CAPE ratio is calculated by dividing the S&P 500 index level by the inflation-adjusted average earnings of its constituent companies over the past ten years [4] - The S&P 500's CAPE ratio has reportedly surpassed 40 for the first time since 2000, indicating a potential market peak [4] Buffett Indicator - The "Buffett Indicator," which compares the total market value of U.S. stocks to the GDP, shows that the stock market's total value was approximately $64.5 trillion as of June, while the GDP was $23.7 trillion, resulting in a valuation of about 2.7 times GDP, the highest since March 2001 [7][8] - Analysts view this indicator as a useful measure of stock valuation, as it reflects the relationship between asset prices and economic activity [7][8] Price-to-Sales Ratio - The price-to-sales ratio for the S&P 500 reached 3.12 at the end of August, the highest level since January 2000, indicating that the index is more expensive relative to its expected sales [11] - Some analysts consider the price-to-sales ratio a more realistic measure of stock market valuation compared to net income figures, which can be manipulated [11] New Normal - Recent earnings expectations have been rising rapidly, suggesting that corporate profits may reach new historical highs in Q3, which could lead investors to accept higher valuations [14] - Analysts suggest that high valuations may represent a "new normal," as the largest U.S. companies today differ significantly from those in the 1980s and 1990s, with lower debt-to-equity ratios and reduced volatility in earnings [14]

鲍威尔:美股“太贵”
Di Yi Cai Jing Zi Xun· 2025-09-25 00:36
Core Viewpoint - The U.S. stock market indices reached historical highs due to expectations of interest rate cuts by the Federal Reserve, but market sentiment cooled following Chairman Powell's remarks on valuation concerns, leading to a short-term market adjustment [2] Valuation Indicators - The Cyclically Adjusted Price-to-Earnings (CAPE) ratio has risen to a new high since the end of 2021, indicating potential overvaluation, as it measures stock prices against the average inflation-adjusted earnings over the past decade [4] - The CAPE ratio has surpassed 40 for the first time since 2000, a period that marked the beginning of the internet bubble's collapse [5] - The "Buffett Indicator," which compares the total market capitalization of U.S. stocks to the GDP, shows that the current market valuation is approximately 2.7 times the GDP, a level not seen since March 2001 [6] - The forward Price-to-Sales (P/S) ratio for the S&P 500 has reached 3.12, the highest since records began in January 2000, suggesting elevated valuations from a revenue perspective [7] Market Sentiment and Future Outlook - Despite high valuations, some analysts argue that strong earnings growth expectations may justify these levels, suggesting that high valuations could be part of a "new normal" rather than a return to historical averages [8] - The current market environment features lower debt levels among major companies and reduced earnings volatility, which may support higher valuation multiples [8]
