财务指标分析
Search documents
康芝药业(300086.SZ):2025年三季报净利润为-9661.15万元
Xin Lang Cai Jing· 2025-10-27 01:32
2025年10月27日,康芝药业(300086.SZ)发布2025年三季报。 公司营业总收入为3.26亿元,较去年同报告期营业总收入减少3743.10万元,同比较去年同期下降10.29%。归母净利润为-9661.15万元。经营活动现金净流入 为5717.86万元。 公司最新资产负债率为42.86%,较上季度资产负债率增加1.14个百分点,较去年同期资产负债率增加4.28个百分点。 公司较去年同期总资产周转率持平,同比较去年同期下降1.05%。最新存货周转率为0.86次。 公司股东户数为4.18万户,前十大股东持股数量为1.53亿股,占总股本比例为33.68%,前十大股东持股情况如下: | 序号 | 股东名称 | 持股 | | --- | --- | --- | | l | 海南宏氏投资有限公司 | 27.2. | | 2 | 陈惠贞 | 1.79 | | ന | 洪江游 | 1.69 | | 4 | 間英 | 0.53 | | 5 | 洪江涛 | 0.52 | | റ | 朱军 | 0.45 | | 7 | J.P.Morgan Securities PLC-自有资金 | 0.42 | | 8 | JUANL ...

谱尼测试(300887.SZ):2025年三季报净利润为-1.99亿元
Xin Lang Cai Jing· 2025-10-25 02:44
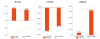
Core Insights - The company reported a total operating revenue of 932 million yuan, a decrease of 191 million yuan compared to the same period last year, representing a year-on-year decline of 17.01% [2] - The net profit attributable to shareholders was -199 million yuan, indicating a loss [2] - The net cash inflow from operating activities was -27.3 million yuan [2] Financial Metrics - The latest debt-to-asset ratio stands at 16.10% [4] - The latest gross profit margin is 29.61% [4] - The return on equity (ROE) is -6.93% [4] - The diluted earnings per share (EPS) is -0.36 yuan [4] - The total asset turnover ratio is 0.26 times, a decrease of 0.01 times compared to the same period last year, reflecting a year-on-year decline of 5.39% [4] - The inventory turnover ratio is 20.06 times, a decrease of 12.46 times compared to the same period last year, representing a year-on-year decline of 38.32% [4] Shareholder Structure - The number of shareholders is 21,400, with the top ten shareholders holding 344 million shares, accounting for 63.06% of the total share capital [4] - The largest shareholder is Song Wei, holding 44.33% of the shares [4] - Other notable shareholders include Li Yanggu (9.59%) and Beijing Puri Hengxiang Technology Development Co., Ltd. (3.58%) [4]
四川长虹(600839.SH):2025年三季报净利润为10.08亿元、同比较去年同期上涨192.49%
Xin Lang Cai Jing· 2025-10-25 02:40
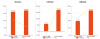
Core Insights - Sichuan Changhong (600839.SH) reported a total operating revenue of 81.889 billion yuan for Q3 2025, an increase of 4.591 billion yuan compared to the same period last year, marking a year-on-year growth of 5.94% [1] - The net profit attributable to shareholders reached 1.008 billion yuan, up 663 million yuan from the same period last year, reflecting a significant year-on-year increase of 192.49% [1] - The net cash inflow from operating activities was 1.002 billion yuan, an increase of 432 million yuan year-on-year, achieving a growth of 75.57% [1] Financial Ratios - The latest debt-to-asset ratio stands at 73.66%, a decrease of 1.86 percentage points from the previous quarter and a reduction of 0.50 percentage points compared to the same period last year [3] - The gross profit margin is reported at 9.37%, with a return on equity (ROE) of 6.52%, which is an increase of 4.10 percentage points year-on-year [4] - The diluted earnings per share (EPS) is 0.22 yuan, an increase of 0.14 yuan from the same period last year, representing a year-on-year growth of 192.63% [4] Operational Efficiency - The total asset turnover ratio is 0.83 times, which is an increase of 0.01 times compared to the same period last year, achieving a growth for two consecutive years [4] - The inventory turnover ratio is reported at 3.56 times [4] Shareholder Structure - The number of shareholders is 703,700, with the top ten shareholders holding a total of 1.3 billion shares, accounting for 28.16% of the total share capital [4] - The largest shareholder is Sichuan Changhong Electronic Holding Group Co., Ltd., holding 23.22% of the shares [4]
东贝集团(601956.SH):2025年三季报净利润为1.04亿元
Xin Lang Cai Jing· 2025-10-25 02:33
Core Insights - Dongbei Group (601956.SH) reported a total revenue of 4.573 billion yuan and a net profit attributable to shareholders of 104 million yuan for Q3 2025 [1] Financial Performance - The latest gross profit margin is 9.79%, which is a decrease of 0.22 percentage points from the previous quarter and a decrease of 3.08 percentage points year-on-year [2] - The latest return on equity (ROE) is 4.10%, down by 0.08 percentage points compared to the same period last year [2] - The diluted earnings per share (EPS) is 0.17 yuan [3] - The total asset turnover ratio is 0.66 times, a decrease of 0.02 times year-on-year, reflecting a 3.00% decline [3] - The inventory turnover ratio is 4.87 times, down by 0.17 times compared to the same period last year, indicating a 3.34% decrease [3] - The company's debt-to-asset ratio stands at 62.19% [4] Shareholder Structure - The number of shareholders is 37,100, with the top ten shareholders holding a total of 328 million shares, accounting for 52.83% of the total share capital [3] - The largest shareholder is Huangshi Huizhi Investment Partnership (Limited Partnership) with a holding of 47.1 million shares [3]

慈文传媒(002343.SZ):2025年三季报净利润为-2740.64万元,同比由盈转亏
Xin Lang Cai Jing· 2025-10-22 01:12
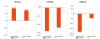
Core Insights - The company reported a significant increase in total revenue for Q3 2025, amounting to 193 million yuan, which is an increase of 140 million yuan compared to the same period last year, representing a year-on-year growth of 266.36% [1] - However, the net profit attributable to shareholders was negative at -27.41 million yuan, a decrease of 38.82 million yuan from the same period last year, reflecting a year-on-year decline of 340.22% [1] - The company experienced a net cash outflow from operating activities of -109 million yuan, which is an improvement of 42.31 million yuan compared to the same period last year [1] Financial Ratios - The latest debt-to-asset ratio stands at 45.90%, which is an increase of 1.64 percentage points from the previous quarter and an increase of 11.54 percentage points from the same period last year [3] - The gross profit margin is reported at 7.27%, showing an increase of 1.76 percentage points from the previous quarter, but a decrease of 46.05 percentage points compared to the same period last year [3] - The return on equity (ROE) is -2.85%, which is a decrease of 4.01 percentage points from the same period last year [3] Earnings Per Share and Turnover Ratios - The diluted earnings per share is -0.06 yuan, a decrease of 0.08 yuan from the same period last year, reflecting a year-on-year decline of 340.42% [3] - The total asset turnover ratio is 0.11 times, which is an increase of 0.08 times compared to the same period last year, representing a year-on-year growth of 197.39% [3] - The inventory turnover ratio is 0.23 times, an increase of 0.19 times from the same period last year, indicating a year-on-year increase of 450.24% [3] Shareholder Information - The number of shareholders is reported at 51,400, with the top ten shareholders holding a total of 156 million shares, accounting for 32.92% of the total share capital [3] - The largest shareholder is Huazhang Tiandi Media Investment Holding Group Co., Ltd., holding 20 million shares [3]

MTY Food Group Inc. (MTYFF) Earnings Report Analysis
Financial Modeling Prep· 2025-10-14 00:00
Core Insights - MTY Food Group Inc. reported earnings per share (EPS) of $0.866, slightly below the estimated $0.89, but exceeded revenue expectations with approximately $216.06 million compared to the estimated $195.15 million [2][6] - The company experienced a 2% increase in segment profits, reaching $73.2 million, while net income attributable to owners declined to $27.9 million from $34.9 million in the same quarter of the previous year [3][6] - MTY's normalized adjusted EBITDA rose by 3% to $74 million, and the company opened 15 new locations in Q3-25, contrasting with a net closure of 41 locations in Q3-24, indicating a strategic focus on expansion [4][6] Financial Metrics - The company has a price-to-earnings (P/E) ratio of approximately 20.21, a price-to-sales ratio of about 0.66, and an enterprise value to sales ratio of around 1.63, reflecting its market valuation [5] - The debt-to-equity ratio stands at approximately 1.47, highlighting the company's financial structure and market perception [5]

Vail Resorts, Inc. (NYSE:MTN) Fiscal Fourth-Quarter Earnings Preview
Financial Modeling Prep· 2025-09-25 10:00
Core Insights - Vail Resorts, Inc. is a prominent operator in the mountain resort and urban ski area industry, recognized for its popular season passes like the Epic Pass, and is set to announce its fiscal fourth-quarter earnings on September 29, 2025 [1] Financial Performance - Wall Street estimates a loss of $4.78 per share for the upcoming quarter, a 2.4% decline from the adjusted loss of $4.67 per share reported in the same period last year [2] - Despite the expected loss, revenue is projected to increase by 1.7% year-over-year, reaching approximately $270 million, driven by higher sales of season passes and Epic Day Passes [2] - Over the last four quarters, the company has exceeded earnings expectations three times, with an average surprise of 2.7% [3] - The Zacks Consensus Estimate for the fiscal fourth-quarter loss per share has been slightly revised to $4.78 from $4.80, indicating stability in analysts' forecasts [3] Financial Metrics - The price-to-sales ratio for Vail Resorts is 1.87, indicating the market values the company at nearly 1.87 times its sales [4] - The enterprise value to sales ratio stands at approximately 2.71, reflecting the company's total valuation relative to its sales [4] - The debt-to-equity ratio is around 3.30, suggesting a higher level of debt compared to equity [4] - The current ratio is approximately 0.61, indicating potential challenges in covering short-term liabilities with short-term assets [4]

Hims & Hers Health Inc. (NYSE:HIMS) Under Investigation: A Financial Overview
Financial Modeling Prep· 2025-09-21 22:00
Core Insights - Hims & Hers Health Inc. is under investigation by Berger Montague for potential breaches of fiduciary duties following the termination of its partnership with Novo Nordisk due to deceptive marketing practices [1][6] - Insider trading activity by Chief Commercial Officer Chi Michael, who sold 13,749 shares at $50.50 each, raises questions about confidence in the company's future amid ongoing legal scrutiny [2][6] - Hims & Hers has a high price-to-earnings (P/E) ratio of 67.01, indicating strong investor expectations for growth despite current challenges [3][6] Financial Metrics - The company has a price-to-sales ratio of 6.25 and an enterprise value to sales ratio of 6.21, reflecting the market's valuation of its sales [4] - Hims & Hers has an enterprise value to operating cash flow ratio of 47.79, indicating its valuation in relation to cash flow from operations [4] - The debt-to-equity ratio stands at 1.86, suggesting a moderate level of financial leverage, while a current ratio of 4.98 indicates strong short-term liability coverage [5]

A quick way to value the BHP share price
Rask Media· 2025-09-18 03:47
Core Viewpoint - BHP Group Ltd's share price has increased by 0.48% since January 2025, indicating potential interest for investors to consider BHP shares for their watchlist [1][2]. Company Overview - BHP Group, established in 1885, is a diversified natural resources company that produces commodities for energy and manufacturing [2]. - The company's primary business lines include mineral exploration and production, focusing on copper and related minerals, iron ore, and coal, while also diversifying into areas like fertilizer [3]. Financial Performance - BHP reported an annual revenue of $56,027 million, with a compound annual growth rate (CAGR) of -0.7% over the last three years [6]. - The latest gross margin reported by BHP was 82.3%, indicating strong profitability from core products [7]. - The profit for the last financial year was $7,897 million, down from $11,304 million three years ago, reflecting a CAGR of -11.3% [8]. Financial Health - BHP's current net debt stands at $9,467 million, indicating the company's total debt minus cash holdings [9]. - The debt/equity ratio is 45.3%, suggesting that BHP has more equity than debt, indicating a relatively lower leverage [11]. - The return on equity (ROE) for BHP in FY24 was 19.7%, suggesting effective capital allocation and value generation [12]. Investment Consideration - Despite the high ROE, the negative trends in profit and revenue may warrant caution for potential investors [13].

Radiant Logistics, Inc. (NYSE American: RLGT) Earnings Report Highlights
Financial Modeling Prep· 2025-09-16 03:00
Core Viewpoint - Radiant Logistics, Inc. reported an earnings per share (EPS) of $0.10, exceeding estimates, while revenue of $220.58 million fell short of expectations [1][6] Financial Performance - The company achieved an EPS of $0.10, surpassing the estimated EPS of $0.075 [1][6] - Actual revenue was $220.58 million, slightly below the estimated $223.705 million [1][6] Strategic Initiatives - RLGT is making significant progress in green-field and strategic operating partner acquisitions, positioning itself for future growth [2] - The strategic focus is crucial as market conditions improve, potentially leading to better financial outcomes [2] Market Valuation - The company has a price-to-earnings (P/E) ratio of approximately 18.87, indicating how the market values its earnings [3][6] - A price-to-sales ratio of 0.37 suggests a relatively low market valuation compared to its revenue, which may attract investors [3] Valuation Ratios - The enterprise value to sales ratio is 0.43, reflecting total valuation in relation to sales [4] - The enterprise value to operating cash flow ratio is 33.67, providing insight into cash flow generation relative to valuation [4] Investment Returns - RLGT has an earnings yield of 5.3%, offering a return on investment based on its earnings [4] Financial Stability - The company maintains a moderate debt level with a debt-to-equity ratio of 0.36, indicating a balanced financing approach [5][6] - A current ratio of 1.49 suggests a healthy liquidity position, ensuring sufficient current assets to cover current liabilities [5]
