风沙治理
Search documents
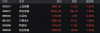
12/15财经夜宵:得知基金净值排名及选基策略,赶紧告知大家
Sou Hu Cai Jing· 2025-12-15 16:03
Core Insights - The article provides an overview of the latest fund net asset values, highlighting the top-performing and bottom-performing funds in terms of net value growth [2][3]. Fund Performance Summary Top 10 Funds by Net Value Growth - The top-performing funds include: 1. Huabao Overseas China Growth Mixed Fund: Latest net value 1.4360, growth of 3.24% 2. Zhongjia Advantage Enterprise Mixed A: Latest net value 1.5510, growth of 2.76% 3. Zhongjia Advantage Enterprise Mixed C: Latest net value 1.4826, growth of 2.74% 4. ICBC Hong Kong Small Cap USD: Latest net value 0.2780, growth of 2.66% 5. Founder Fubon Mixed C: Latest net value 1.2000, growth of 2.65% 6. Founder Fubon Mixed A: Latest net value 1.2120, growth of 2.62% 7. ICBC Hong Kong Small Cap RMB: Latest net value 1.9640, growth of 2.61% 8. Yongying High-end Equipment A: Latest net value 1.1641, growth of 2.56% 9. Yongying High-end Equipment C: Latest net value 1.1484, growth of 2.56% 10. Southern Hong Kong Preferred Stocks: Latest net value 1.7493, growth of 2.50% [2]. Bottom 10 Funds by Net Value Growth - The underperforming funds include: 1. Zhonghang Preferred Navigation Mixed C: Latest net value 1.6990, decline of 6.70% 2. Zhonghang Preferred Navigation Mixed A: Latest net value 1.7090, decline of 6.69% 3. Tongtai Industry Preferred C: Latest net value 0.5264, decline of 5.08% 4. Tongtai Industry Preferred A: Latest net value 0.5357, decline of 5.07% 5. Fuguo Pharmaceutical Growth A: Latest net value 1.0475, decline of 4.90% 6. Great Wall Health Mixed C: Latest net value 0.9224, decline of 4.81% 7. Great Wall Health Mixed A: Latest net value 0.9521, decline of 4.81% 8. Great Wall Pharmaceutical Technology C: Latest net value 0.7704, decline of 4.76% 9. Great Wall Pharmaceutical Technology A: Latest net value 0.7880, decline of 4.75% 10. Yifangda Pharmaceutical Biotechnology C: Latest net value 0.8290, decline of 4.75% [3]. Market Overview - The Shanghai Composite Index opened lower but rebounded before closing with a small decline, while the ChiNext Index also opened low and continued to decline, closing with a small loss. The total trading volume was 1.79 trillion, with 2,314 stocks rising and 2,968 falling. The leading sectors included insurance and chemical fiber, both rising over 2%, while the lagging sectors included communication equipment and semiconductors, both declining over 2% [5].


11/4财经夜宵:得知基金净值排名及选基策略,赶紧告知大家
Sou Hu Cai Jing· 2025-11-04 16:10
Core Insights - The article provides a ranking of mutual funds based on their net asset value updates, highlighting the top-performing and bottom-performing funds in the market [2][3][4]. Fund Performance Summary - The top 10 funds with the highest net value growth as of November 4, 2025, include: 1. Tianhong Zhongzheng Bank ETF: Unit Net Value 1.5043, Cumulative Net Value 1.5043, with a growth of 0.03 2. Zhongzheng Bank ETF: Unit Net Value 1.4720, Cumulative Net Value 1.6680, with a growth of 0.02 3. Huaxia Zhongzheng Bank ETF: Unit Net Value 1.7798, Cumulative Net Value 1.7798, with a growth of 0.03 4. Fuguo Zhongzheng 800 Bank ETF: Unit Net Value 1.3649, Cumulative Net Value 1.3649, with a growth of 0.02 5. Huabao Zhongzheng Bank ETF: Unit Net Value 0.8391, Cumulative Net Value 1.6782, with a growth of 0.01 6. Nanfang Zhongzheng Bank ETF: Unit Net Value 1.6954, Cumulative Net Value 1.8624, with a growth of 0.03 7. Hu'an Zhongzheng Bank ETF: Unit Net Value 1.4270, Cumulative Net Value 1.4270, with a growth of 0.02 8. Penghua Zhongzheng Bank ETF: Unit Net Value 1.7185, Cumulative Net Value 1.7185, with a growth of 0.03 9. Yifangda Zhongzheng Bank ETF: Unit Net Value 1.3836, Cumulative Net Value 1.3836, with a growth of 0.02 10. Dongcai Zhongzheng Bank Index C: Unit Net Value 1.3390, Cumulative Net Value 1.3390, with a growth of 0.02 [2][4]. - The bottom 10 funds with the lowest net value growth include: 1. Debang High-end Equipment Mixed Initiation C: Unit Net Value 1.0852, with a decline of -0.06 2. Debang High-end Equipment Mixed Initiation A: Unit Net Value 1.0869, with a decline of -0.06 3. Furong Fuxin Mixed C: Unit Net Value 2.2756, with a decline of -0.12 4. Furong Fuxin Mixed A: Unit Net Value 2.3155, with a decline of -0.13 5. Great Wall Emerging Industry Mixed A: Unit Net Value 2.4973, with a decline of -0.12 6. Great Wall Emerging Industry Mixed C: Unit Net Value 2.4651, with a decline of -0.12 7. AVIC Trend Navigation Mixed Initiation A: Unit Net Value 2.3952, with a decline of -0.11 8. AVIC Trend Navigation Mixed Initiation C: Unit Net Value 2.3750, with a decline of -0.11 9. Minsheng Jianyin Frontier Technology Mixed: Unit Net Value 1.0935, with a decline of -0.05 10. Qianhai Kaiyuan Jiaxin Mixed C: Unit Net Value 2.1170, with a decline of -0.09 [4][6]. Market Analysis - The Shanghai Composite Index experienced a pullback after a rise, closing slightly lower, while the ChiNext Index showed a similar trend. The total trading volume reached 1.93 trillion, with a market breadth of 1,630 gainers to 3,650 losers. The banking sector led the market with a rise of over 2%, while the non-ferrous metals and pharmaceutical sectors saw declines of over 2% [6]. Fund Holdings - The Tianhong Zhongzheng Bank ETF has a concentrated holding of 64.57% in its top ten stocks, with significant daily gains from major banks such as: - China Merchants Bank: 2.92% increase - Industrial Bank: 2.82% increase - Agricultural Bank: 1.75% increase - Shanghai Bank: 3.20% increase - The fund's total assets amount to 5.844 billion [7]. - Conversely, the Debang High-end Equipment Mixed Initiation C fund has a holding concentration of 60.76%, with significant declines in its top holdings, including: - Yinlun Co.: -6.07% decrease - Zhejiang Songtai: -6.34% decrease - Hanwei Technology: -6.70% decrease - This fund's total assets are 1.169 billion [7].
10/28财经夜宵:得知基金净值排名及选基策略,赶紧告知大家
Sou Hu Cai Jing· 2025-10-28 15:54
Core Insights - The article provides a ranking of open-end funds based on their net asset value growth as of October 28, 2025, highlighting the top and bottom performers in the market [2][4][6]. Fund Performance Summary - The top 10 funds with the highest net value growth include: 1. Caizhong Growth Preferred Mixed C: 2.3130 (up from 2.2290) 2. Caizhong Growth Preferred Mixed A: 4.0210 (up from 3.8760) 3. Caizhong Integrated Circuit Industry Stock C: 3.7926 (up from 3.6578) 4. Caizhong Integrated Circuit Industry Stock A: 4.0079 (up from 3.8655) 5. Caizhong Fuxin Fixed Opening Mixed Initiation: 4.6350 (up from 4.4705) 6. Caizhong Prosperity Selection One-Year Holding Period Mixed A: 2.5536 (up from 2.4640) 7. Caizhong Prosperity Selection One-Year Holding Period Mixed C: 2.5078 (up from 2.4199) 8. Caizhong Craftsmanship Preferred One-Year Holding Period Mixed A: 1.5835 (up from 1.5283) 9. Caizhong Craftsmanship Preferred One-Year Holding Period Mixed C: 1.5390 (up from 1.4854) 10. Caizhong Value Momentum Mixed C: 2.1310 (up from 2.0670) [2][4]. - The bottom 10 funds with the lowest net value growth include: 1. Tongling Stock ETF: 1.9061 (down from 1.9793) 2. Guotai Zhongzheng Huasheng Hong Kong Gold Industry Stock ETF: 1.5058 (down from 1.5632) 3. Gold Stock ETF Fund: 1.5615 (down from 1.6210) 4. Huaxia Zhongzheng Huasheng Hong Kong Gold Industry Stock ETF: 2.0795 (down from 2.1580) 5. Huaan Zhongzheng Huasheng Hong Kong Gold Industry Stock ETF: 1.4605 (down from 1.5153) 6. Ping An Zhongzheng Huasheng Hong Kong Gold Industry ETF: 1.5477 (down from 1.6055) 7. Yifangda Zhongzheng Huasheng Hong Kong Gold Industry Stock: 1.6052 (down from 1.6649) 8. Yifangda Zhongzheng Huasheng Hong Kong Gold Industry Stock: 1.6012 (down from 1.6607) 9. Great Wall Value Selection One-Year Holding Mixed C: 1.1523 (down from 1.1948) 10. Zhongou Zhongzheng Huasheng Hong Kong Gold Industry Stock Index: 1.5346 (down from 1.5912) [4][6]. Market Overview - The Shanghai Composite Index opened lower but rebounded to reach a ten-year high before closing with a small decline, while the ChiNext Index also experienced a similar pattern [6]. - The total trading volume reached 2.16 trillion, with a market breadth of 2366 gainers to 2908 losers [6]. - The leading sectors included comprehensive categories, with notable gains in concepts such as the Taiwan Strait West Coast and military trade, both exceeding 2% [6].
A股全线爆发,又见个股“地天板”
Zheng Quan Shi Bao· 2025-10-27 04:20
Core Viewpoint - The A-share market is experiencing a strong upward trend, with the Shanghai Composite Index approaching the 4000-point mark, reaching a recent ten-year high [1][2][3]. Market Performance - On October 27, the Shanghai Composite Index opened high and reached 3991.35 points, up 1.04% at midday, while the Shenzhen Component Index rose 1.26% to 13457.28 points, and the ChiNext Index increased by 1.54% to 3220.52 points [3][4]. - The market is showing a broad-based rally across major sectors, with notable gains in telecommunications, steel, utilities, and non-ferrous metals, while media and power equipment sectors lagged [4]. Margin Trading - As of October 24, 2025, the total margin trading balance across the Shanghai, Shenzhen, and Beijing markets reached 24571.9 billion yuan, just shy of the historical high, with a daily increase of 61.5 billion yuan [11]. - The financing balance also saw growth, totaling 24398.2 billion yuan, indicating strong investor confidence [11]. Individual Stock Highlights - Popular stocks, referred to as "Yi Zhongtian," continued to rise, with Xinyi Technology surging over 11% to reach a new historical high, while Zhongji Xuchuang also hit a historical peak [5]. - Shen Kai Co., Ltd. exhibited significant volatility, initially hitting the limit down before rebounding to a gain of over 7%, with trading volume exceeding 20 billion yuan [7]. Financial Reports - Shen Kai Co., Ltd. reported a revenue of 568 million yuan for the first three quarters of 2025, a year-on-year increase of 14.47%, but the third quarter saw a revenue decline of 1.85% [9]. - The company also announced a provision for asset impairment totaling approximately 4.2253 million yuan, reflecting a cautious approach to financial reporting [10].
A股,全线爆发!又见个股“地天板”
证券时报· 2025-10-27 04:14
Core Viewpoint - The A-share market is experiencing a strong upward trend, with the Shanghai Composite Index approaching the 4000-point mark, reaching a recent ten-year high [2][5]. Market Performance - On October 27, the A-share market opened strongly, with the Shanghai Composite Index jumping high and nearing 4000 points [4]. - As of the midday close, the Shanghai Composite Index rose by 1.04% to 3991.35 points, while the Shenzhen Component Index increased by 1.26% to 13457.28 points, and the ChiNext Index rose by 1.54% to 3220.52 points [5][6]. Margin Trading - The margin trading balance in the A-share market has seen growth, reaching a total of 24571.9 billion yuan as of October 24, 2025, just shy of its historical high, with a single-day increase of 61.5 billion yuan [12][13]. Sector Performance - Major industry sectors showed a broad increase, with telecommunications, comprehensive, steel, public utilities, and non-ferrous metals leading the gains. In contrast, the media and electric equipment sectors performed relatively weakly [6]. Concept and Individual Stocks - Concept sectors such as photolithography machines, nickel metals, controllable nuclear fusion, lithium mines, and wind and sand governance saw significant gains. Conversely, horse racing concepts and ST stocks experienced declines [7]. - Notable individual stocks included Xinyi Technology, which surged over 11%, reaching a historical high, and Zhongji Xuchuang, which also hit a historical high [7]. Company Specifics - ShenKai Co., Ltd. experienced significant volatility, initially hitting the limit down before rebounding to a limit up, with a trading volume exceeding 20 billion yuan [9]. - ShenKai's Q3 2025 report indicated a revenue of 568 million yuan, a year-on-year increase of 14.47%, while net profit was 37.775 million yuan, up 86.46%. However, Q3 revenue saw a slight decline of 1.85% year-on-year, with net profit dropping by 75.18% [11].

蒙草生态涨2.22%,成交额1.07亿元,主力资金净流入622.87万元
Xin Lang Cai Jing· 2025-10-21 06:36
Core Viewpoint - The stock of Mongcao Ecological Environment Group Co., Ltd. has shown fluctuations, with a recent increase of 2.22% but a year-to-date decline of 19.24%, indicating potential volatility in the market [1]. Financial Performance - For the first half of 2025, Mongcao Ecological reported a revenue of 823 million yuan, representing a year-on-year growth of 19.40% [2]. - The net profit attributable to shareholders for the same period was 50.05 million yuan, showing a significant increase of 97.98% compared to the previous year [2]. Shareholder Information - As of June 30, 2025, the number of shareholders decreased by 7.82% to 89,500, while the average number of circulating shares per person increased by 3.11% to 14,511 shares [2]. - The company has distributed a total of 483 million yuan in dividends since its A-share listing, with 72.19 million yuan distributed over the last three years [3]. Market Activity - As of October 21, 2023, the stock price was 4.14 yuan per share, with a trading volume of 1.07 billion yuan and a turnover rate of 2.01%, leading to a total market capitalization of 6.642 billion yuan [1]. - The net inflow of main funds was 6.23 million yuan, with significant buying activity from large orders [1].
5%+,金银再大涨!这一板块,多股20%涨停!
Zheng Quan Shi Bao· 2025-10-16 04:14
Market Overview - A-shares experienced fluctuations with the three major indices opening lower but rising throughout the day, with the ChiNext Index at one point increasing by over 1% [2] - The Shanghai Composite Index rose by 0.1%, the Shenzhen Component increased by 0.15%, and the ChiNext Index gained 0.69% by midday [2] Sector Performance - The communication sector led the market, with a peak increase of over 2%, driven by a significant rise in leading stocks like ZTE Corporation, which surged over 9% [2] - The electronics sector also showed strong performance, with many stocks hitting the daily limit or increasing by over 10%, including Yingjixin and Yunhan Chip City, both reaching a 20% limit up [2][3] - The coal sector saw high volatility, with stocks like Antai Group and Baotailong among those with notable gains [3] - The financial sector, including banks and non-bank financials, showed strength, while sectors like steel, building materials, and basic chemicals experienced declines [4] Conceptual Sector Trends - Concept sectors such as storage chips and automotive chips performed well, while shale gas and wind-sand management sectors faced declines [5] New Listings - The newly listed stock, Changjiang Energy Technology, saw a dramatic rise of over 300% during its debut, focusing on energy and chemical equipment [6] Precious Metals - Gold and silver prices surged significantly, with silver futures on the Shanghai Futures Exchange breaking through 12,000 yuan per kilogram, marking a historical high with an intraday increase of over 5% [10] - Gold futures also saw substantial gains, surpassing 970 yuan per gram, reaching a new historical peak [12]

9/10财经夜宵:得知基金净值排名及选基策略,赶紧告知大家
Sou Hu Cai Jing· 2025-09-10 15:50
Group 1 - The article provides a ranking of open-end funds based on their net asset value growth over a 10-day period, highlighting the top and bottom performers [2][4][6] - The top 10 funds with the highest net value growth include Anxin Innovation Pioneer Mixed Fund A, Anxin Innovation Pioneer Mixed Fund C, and Huian Growth Preferred Mixed Fund A, among others [2][4] - The bottom 10 funds with the lowest net value growth include Huaxia Industry Selection Mixed Fund C and HSBC Jintrust Era Pioneer Mixed Fund A, showing a decline in their net values [4][6] Group 2 - The article notes that as of September 10, 2025, a total of 28,679 funds have updated their net values, indicating a significant level of market activity [3] - The Shanghai Composite Index showed slight fluctuations, while the ChiNext Index experienced a rebound, with a total trading volume of 2 trillion yuan [6] - Leading sectors included telecommunications, tourism, and the internet, all showing growth of over 2%, while sectors like electrical equipment and chemicals faced declines [6] Group 3 - The article mentions that the fund with the fastest net value growth is Anxin Innovation Pioneer Mixed Fund A, which aligns with the trend of increasing interest in technology and innovation sectors [6] - The article also highlights the concentration of holdings in certain funds, with Anxin Innovation Pioneer Mixed Fund having a concentration of 62.87% in its top ten holdings, indicating a focused investment strategy [9] - The performance of individual stocks within these funds, such as the significant gains in companies like Zhongxin International and Shenghong Technology, reflects the underlying strength of the technology sector [9]
万亿巨头,涨停!两大板块掀涨停潮!
证券时报· 2025-09-10 04:33
Core Viewpoint - The article highlights the significant market movements following Apple's product launch, particularly the surge in the stock price of Industrial Fulian, which reached a market capitalization of over 1 trillion yuan [3][5]. Market Overview - The A-share market experienced narrow fluctuations, with the Shanghai Composite Index oscillating around the 3800-point mark [2][6]. - The Hong Kong stock market showed an upward trend, with the Hang Seng Index reaching a new high for the year [4][15]. Company Performance - Industrial Fulian (601138) saw a substantial increase, hitting the daily limit up, with its latest market capitalization exceeding 1 trillion yuan [3][7]. - The stock price of Industrial Fulian rose by 10% to 53.67 yuan during trading [8]. - Other notable stocks in the communication sector, such as Yuandao Communication, also experienced significant gains, with a rise of 20.01% [7]. Industry Developments - Apple held its fall product launch event, introducing the iPhone 17 series, with prices ranging from 5999 yuan to 9999 yuan. Pre-orders start on September 12, and sales begin on September 19 [6][8]. - Industrial Fulian is currently ramping up production for the iPhone 17 series at its Zhengzhou port facility [6]. Stock Movements - The article mentions other stocks with notable price movements, including China Unicom, which surged by over 8% after receiving a satellite mobile communication business license [9]. - New stock Ai Fenda saw a dramatic increase, with its price rising by 217.73% during trading [10][11].

9/2财经夜宵:得知基金净值排名及选基策略,赶紧告知大家
Sou Hu Cai Jing· 2025-09-02 16:32
Group 1 - The article highlights the top 10 open-end funds with the highest net value growth as of September 2, 2025, including the top fund, Baoying Ruifeng Innovation Mixed A/B, which increased from 2.8290 to 2.9880, a growth of 0.15 [2][3] - The bottom 10 funds in terms of net value growth include Guorong Rongxin Consumer Selected Mixed A, which decreased from 0.9057 to 0.8365, a decline of 0.06 [4][6] - The overall market performance shows a downward trend in the Shanghai Composite Index, with a trading volume of 2.91 trillion, indicating a challenging market environment [6] Group 2 - The top holdings of Baoying Ruifeng Innovation Mixed A/B include Zhengsheng Technology, which saw a daily increase of 6.35%, and Zhongdali De, which increased by 6.64%, contributing to the fund's strong performance [7] - The top holdings of Guorong Rongxin Consumer Selected Mixed A include Wuliangye, which decreased by 0.24%, and Dongfang Caifu, which fell by 2.93%, reflecting the fund's underperformance [7] - The article notes that the fund's style has shifted towards the artificial intelligence sector, indicating a potential change in investment strategy [7]