艾略特波浪理论
Search documents
Axi 在成功举办 Bloomberg 宣传活动后推出全新 Axi Select 网络研讨会系列
Globenewswire· 2026-03-27 10:00
Core Viewpoint - Axi, a global online trading provider, is launching a new series of educational webinars under its Axi Select program to enhance trader education following the success of a recent Bloomberg promotional event [1]. Group 1: Webinar Series Launch - The first webinar is scheduled for April 2026 and will continue as part of Axi's commitment to providing accessible professional education for traders [1]. - The series aims to offer market insights and practical trading education, leveraging the strong audience engagement from the Bloomberg event [1]. - Greg Rubin, head of Axi Select, emphasized the growing demand for reliable, expert-led educational content to help traders navigate the rapidly changing market [1]. Group 2: Webinar Content and Host - The inaugural webinar will be hosted by Cassandra Ng, a financial market analyst and educator with extensive experience in providing market commentary and trading education [2]. - The focus of the first session will be on market outlook, trading frameworks, and risk management principles to help traders respond confidently to market changes [1][2]. - Cassandra highlighted the importance of education for traders seeking consistency and discipline, aiming to simplify complex market trends and provide actionable insights [2]. Group 3: Axi's Broader Mission - The webinar series is part of Axi's broader mission to empower traders through education, technology, and structured development opportunities [2]. - Axi is transitioning from broadcast-style interactions to interactive learning experiences, reinforcing its commitment to delivering tangible value beyond trading channels [2]. - Axi offers trading opportunities across forex, stocks, indices, commodities, and digital assets, supporting global traders with educational and professional trading tools [2].


王召金:12.15黄金周一最新行情分析及独家解析布局
Sou Hu Cai Jing· 2025-12-15 02:12
Group 1: Gold Market Analysis - The gold market is expected to maintain a range-bound consolidation at the beginning of the week, with significant data releases including U.S. non-farm payrolls on Tuesday, CPI data on Thursday, and the Bank of Japan's interest rate decision on Friday, particularly focusing on whether Japan will enter a rate hike cycle [1] - Previous price movements showed gold prices faced resistance at the 4380 level, forming a "double top" bearish pattern, followed by a decline to around 3900 where it stabilized, indicating a potential bullish flag pattern for future price increases [1] - Daily charts indicate a clear bullish trend, with gold prices successfully breaking above the previous consolidation range and stabilizing above the 4200 level, supported by continuous upward momentum and healthy indicators [2] Group 2: Short-term Trading Strategies - Short-term trading strategies for gold suggest a primary focus on short positions during rebounds and long positions during pullbacks, with key resistance levels identified at 4350-4360 and support levels at 4260-4250 [4] - The short-term price action is characterized by strong upward momentum, with limited pullback strength, indicating a favorable environment for potential long positions upon reaching support levels [2][4] Group 3: Silver Market Analysis - The silver market has successfully broken through the upper boundary of a replicated ascending channel since the low in 2022, entering a new ascending channel, which signals a bullish sentiment and potential for continued upward trends [5] - The four-hour chart shows a strong upward trend for silver prices, with limited pullback and effective support from short-term moving averages, indicating sustained bullish momentum [7] Group 4: Short-term Trading Strategies for Silver - Short-term trading strategies for silver recommend focusing on short positions during rebounds and long positions during pullbacks, with resistance levels at 62.80-63.00 and support levels at 61.00-60.80 [7]

白银强势表现:新周期的信号还是强弩之末?
Xin Lang Cai Jing· 2025-12-13 09:39
Core Viewpoint - Silver prices have surged significantly, approaching the historical high of $62, driven by the FOMC meeting and year-end market momentum, raising questions about the sustainability of broader market trends, which remain below the 2025 historical peak [1][14]. Group 1: Market Dynamics - The divergence in silver prices reflects not only in price but also in market sentiment, following a year of market lethargy due to policy shifts and tariff changes during the new presidential term [1][14]. - Historically, the second term of a president often coincides with market consolidation phases, resetting the market before the next bull cycle [1][14]. Group 2: Silver Price Outlook - The key question is whether silver is the last strong performer in the current long-term bull market or if it will lead the next phase due to its growing importance in the expanding tech sector [6][16]. - Silver has broken through the upper boundary of a dual ascending channel since the 2022 low, indicating a continuation of bullish sentiment [8][19]. - According to Elliott Wave Theory, silver is currently in the fifth wave since 2022, which often extends, suggesting potential upward movement if it holds above $63, with targets at $65 and $70 [8][19]. Group 3: Potential Price Movements - If silver falls below $57, it may retest previous resistance levels that could turn into support around $55, $50, and in extreme cases, $45 [9][19]. - From a three-month perspective, silver has broken through a 45-year resistance level at $55, with potential for a structural pullback before aiming for long-term three-digit targets [12][21].

“双重属性”共同运转 银价近期屡创新高
Jin Tou Wang· 2025-12-13 02:49
Core Viewpoint - Silver prices are rebounding and approaching the resistance level of $64 per ounce, driven by rising interest rate cut expectations and optimistic market sentiment, leading to historical highs in silver prices [1] Group 1: Market Dynamics - Recent trends show that silver has been in a supply-demand deficit for five consecutive years, with a projected market shortfall of 2,950 tons by 2025 [1] - The gold-silver ratio has been correcting to around 66, with silver's price increase being driven by its stronger trading and industrial attributes in a backdrop of interest rate cuts and robust demand [1] - The phenomenon of "silver hoarding" has diminished as prices rise, leading to increased caution among consumers and investors, indicating a more rational market participation despite strong market conditions [1] Group 2: Technical Analysis - Silver has successfully broken through the upper boundary of a replicating upward channel, entering a third upward channel, signaling a continuation of bullish market sentiment [2] - The 261.8% Fibonacci extension level at $63.85 is a key resistance point, with a breakthrough potentially focusing attention on the psychological level of $65.00 [2] - Support is found at the previous resistance area of $61.50, with further targets at the lows of $60.00 and $59.35 if prices fall below this support [2]
本周美储迎来第三次降息 白银来到“60+”阶段
Jin Tou Wang· 2025-12-13 02:29
Group 1 - The core event of the week was the Federal Reserve's decision to cut interest rates by 25 basis points, lowering the target range for the federal funds rate to 3.50% to 3.75%, which aligned with market expectations [1] - The market's focus shifted to the policy statement and Chairman Powell's press conference, where the dot plot indicated that the federal funds rate is expected to drop to 3.4% by the end of 2026, suggesting only one rate cut next year [1] - Powell emphasized significant downside risks to the U.S. labor market, which was interpreted as a dovish signal, leading some traders to bet on two rate cuts next year instead of the one indicated by the dot plot [1] Group 2 - Silver prices have successfully broken through the upper boundary of a rising channel that has constrained its movement since the 2022 low, entering a third rising channel, indicating a potential continuation of bullish sentiment [2] - If the upward trend continues, silver prices could first reach $65 per ounce and then possibly challenge the $69 per ounce level, which is a significant resistance point based on Fibonacci extension [2] - Conversely, if silver prices fall below the upper boundary of the second rising channel (below $57), it may trigger a corrective trend, with potential targets for a pullback at $55, $50, and in extreme cases, down to $45, before the bull market trend could resume [2]
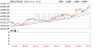
Did Last Week's Decline Threaten the Path to 7120 for the S&P 500? Here's What the Elliott Wave Shows
FX Empire· 2025-11-10 19:57
Core Insights - The analysis indicates that the market has experienced 73 identified waves since the low on April 7, suggesting a need for continuous re-evaluation of market trends due to potential miscounting of waves [1] - The projected completion of various waves aligns closely with actual market movements, demonstrating a high accuracy rate of +/-2% for the identified targets [2][3] - The current market trajectory suggests that if the SPX index remains above 6631, a target of approximately 7120 for Wave-5 is anticipated, while a drop below 6720 could indicate a potential decline to around 6575 [4] Wave Analysis - The analysis of the Elliott Wave pattern since early September shows that the index has tracked closely with projections, including a peak at 6890 for W-3, which is within the expected range [2][3] - The last week's closing low at 6720 corresponds well with earlier projections for Wave-4, reinforcing the reliability of the wave analysis [3] - The potential for complex patterns in 4th waves suggests that the current wave structure may not be complete, indicating further monitoring is necessary [3] Market Projections - The expectation for Wave-5 to reach approximately 7120 hinges on the SPX maintaining a position above 6631, while a close below 6720 would signal caution for bullish positions [4] - The analysis emphasizes the importance of skepticism and continuous evaluation in market predictions, aligning with scientific principles of inquiry [5]

亨里克·泽伯格预测比特币或冲击16万美元,市场将进入第二浪投降阶段
Sou Hu Cai Jing· 2025-11-04 07:19
Core Insights - The current state of Bitcoin, Ethereum, and the entire cryptocurrency market is identified as a typical second wave capitulation phase in the ongoing bull market cycle [1][3] - This capitulation phase follows a significant B wave correction, where market sentiment is at a low point, leading investors to abandon positions before a parabolic rise [1][3] Market Analysis - Henrik Zeberg notes that capitulation is an emotional adjustment before the final phase, indicating that this is the most uncomfortable time during a bull market [3] - Bitcoin recently experienced a brief drop to around $114,000, currently trading at approximately $108,000, near its 200-day moving average [3] - The Relative Strength Index (RSI) is close to 40, suggesting panic and weakness in the market, but a structural collapse has not yet occurred [3] - Historically, accumulation phases before rebounds often exhibit similar conditions [3] Future Projections - Zeberg anticipates that the next phase, the 3(4)-5 wave, will lead to the most explosive market movements to date, fueled by new liquidity and risk appetite [3] - Ethereum is expected to experience a vertical price increase, potentially reaching $6,000, $7,500, $10,000, or even $12,000, while Bitcoin's price could exceed $160,000 [3] - This phase is described as the "end of everything bubble," preceding a large-scale deflationary collapse [3] - Market sentiment at the peak is expected to emit contrary signals, indicating that euphoria may obscure warning signs [3] Market Cleanup - The current adjustment is seen as a process to cleanse the market, eliminating weak investors and preparing for the final and strongest rebound of the macro cycle [3] - Zeberg emphasizes that the bull market remains strong despite the ongoing adjustments [3]

黄金走势推演与后市机会分析(2025.11.2)
Sou Hu Cai Jing· 2025-11-02 15:43
Group 1: Market Overview - The gold market experienced a downward trend in the first three trading days of the week, followed by a strong rebound on Thursday, and ended with a consolidation pattern on Friday, resulting in a weekly bearish candle with a long lower shadow [1] - October's gold market closed with a bullish candle featuring a long upper shadow, indicating a pattern of price increase followed by a pullback throughout the month [1] Group 2: Economic Indicators - The Federal Reserve is entering a new phase, with officials expressing concerns about the possibility of rate cuts in December. Key speeches from various Fed officials next week will be crucial for market sentiment [2] - Important economic data releases next week include the ISM and ADP reports, with expectations for the ISM manufacturing PMI to return above the 50 mark for the first time since February 2025 [3] Group 3: Legal and Regulatory Events - The U.S. Supreme Court will hear arguments regarding Trump's authority to impose tariffs under the International Emergency Economic Powers Act, with significant implications for economic interests and presidential powers [4] Group 4: Technical Analysis - The gold market is currently in a phase of structural differentiation, with three potential paths for price evolution based on Elliott Wave Theory and Fibonacci retracement levels [5][9][12][15] - The first scenario suggests a continuation of the B-wave rebound, requiring the price to hold above the recent low of 3886 to confirm the rebound's validity [9] - The second scenario indicates a potential extension of the A-wave decline if the price breaks below 3886, with key support levels identified at 3846 and 3720 [12] - The third scenario posits a trend reversal if the price breaks above 4381 after holding above 3886, suggesting a new upward trend [15]

多个市场突然跳水!发生了什么?
Zheng Quan Shi Bao Wang· 2025-10-21 07:21
Market Overview - The cryptocurrency market experienced a significant downturn, with Bitcoin dropping by $3,000 to $107,500, and Ethereum falling over 5% below $3,900 [2][3] - Other cryptocurrencies such as BNB, Solana, and Cardano also saw declines, with many dropping over 4% [3] - A warning from Elliott Wave Theory analyst Jon Glover indicated that Bitcoin may enter a bear market, potentially falling to $70,000 or lower [2][5] Liquidation Data - According to Coinglass, over $401 million in cryptocurrency contracts were liquidated within 24 hours, affecting more than 122,000 traders, with 60% being long positions [3][4] - The largest single liquidation occurred in Hyperliquid-ETH-USD, valued at approximately $6.3666 million [3][4] Global Market Impact - Following a historical high, both the Japanese and South Korean stock markets also experienced a sharp decline, with the Nikkei 225 index turning negative after a gain of over 1.5% [2] - The South Korean Composite Index's gains narrowed to 0.2% after previously rising over 2% [2] Shift to Safe-Haven Assets - Amid global trade tensions, investors are shifting towards traditional safe-haven assets like gold, which has seen a significant price increase [4][5] - Analysts noted that Bitcoin is viewed as a risk asset, contrasting with gold's stability during market uncertainties [5] Bitcoin Market Analysis - Jon Glover's analysis suggests that the recent Bitcoin bull market, which peaked at $126,000, has ended, with a potential drop to the $70,000-$80,000 range expected [5][6] - Historical patterns indicate that Bitcoin typically enters a bear market approximately 18 months after halving events, with the next halving scheduled for April 2024 [6] Regulatory Developments in Japan - The Japanese Financial Services Agency is considering allowing banks to hold and trade cryptocurrencies, marking a significant shift from its previous conservative stance [7][8] - This proposed framework would enable banks to trade digital assets similarly to stocks and bonds, with risk management measures in place to ensure financial stability [7]
多个市场,突然跳水!发生了什么?
券商中国· 2025-10-21 06:41
Market Overview - The cryptocurrency market experienced a significant downturn, with Bitcoin dropping by $3,000 to $107,500, and Ethereum falling over 5% to below $3,900. Other cryptocurrencies like BNB, Solana, and Cardano also saw declines [1][3] - In the past 24 hours, the total liquidation in the cryptocurrency market exceeded $401 million, affecting over 122,000 traders, with 60% of liquidations being long positions [3][4] Analyst Predictions - Jon Glover, an analyst known for his Elliott Wave Theory predictions, warned that Bitcoin may enter a bear market, potentially dropping to $70,000 or lower, indicating a possible decline of over 35% from current levels [1][7] - Glover stated that the recent peak of Bitcoin at $126,000 has likely marked the end of the bull market, predicting that the bear market could last until at least the end of 2026 [7][8] Market Sentiment - Investors are shifting towards safer assets like gold amid global trade tensions, leading to a significant increase in gold prices. This trend is causing a decline in the appeal of volatile assets like Bitcoin [5] - Analysts suggest that Bitcoin is not a reliable safe-haven asset, as its price movements resemble those of tech stocks, which tend to decline during negative market sentiment [5] Regulatory Developments - Japan's Financial Services Agency is considering allowing banks to hold and trade cryptocurrencies, which marks a significant shift from its previous conservative stance. This could lead to increased adoption of cryptocurrencies in Japan, where the number of crypto accounts has grown 3.5 times in the past five years [9][10]