技術分析
Search documents
友邦技術面轉強,關鍵阻力位全解析
Ge Long Hui· 2025-10-30 19:32
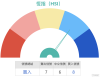
Core Viewpoint - AIA Insurance (01299) has shown strong performance, with its stock price successfully surpassing the 74 HKD mark, currently priced at 74.65 HKD, indicating renewed investor interest in this insurance blue chip [1] Technical Analysis - The current price of 74.6 HKD has broken above the MA10 of 71.49 HKD and is challenging the MA30 of 72.58 HKD [1] - The RSI indicator is at 54, indicating a healthy range and suggesting further upward potential for the stock price [1] - Momentum oscillators and volatility indicators are signaling buy opportunities, while MACD shows a bullish pattern, indicating a significant strengthening of short-term momentum [1] - Key support levels are at 71.9 HKD and 70.8 HKD, while resistance levels are at 76.2 HKD and 78.4 HKD [1] - The stock has experienced a volatility of 5.6% over the past five days, creating conditions favorable for short-term trading [1] Derivative Products Performance - AIA's derivatives have demonstrated impressive leverage, with certain products significantly outperforming the underlying stock [3] - On October 23, when AIA's stock recorded a 1.76% increase over two days, related bull certificates saw much higher gains, with JPMorgan's bull certificate (53008) rising 24% and UBS's bull certificate (61825) increasing by 18% [3] Investment Options - Investors can choose from various AIA-related derivative products based on their risk tolerance and market outlook [6] - The Bank of China call warrant (17336) offers a leverage of 7.6 times with a strike price of 88.93 HKD, suitable for those willing to take on higher risk for potential returns [6] - HSBC call warrant (29501) has a slightly lower leverage of 8.2 times but features the lowest premium and implied volatility [6] - For bearish investors, options like Huatai put warrant (20155) provide 11.8 times leverage with a strike price of 62.94 HKD, also characterized by low premium and implied volatility [6] Bull and Bear Certificates - For investors favoring bull and bear certificates, UBS's bull certificate (61825) and HSBC's bull certificate (61902) both offer 7.8 times actual leverage with a redemption price set at 66 HKD, providing about 11.5% safety margin from the current price [8] - Bearish investors may consider HSBC's bear certificate (53009) or UBS's bear certificate (57408), both offering high leverage (12 times and 11.8 times respectively) with redemption prices set around 80 HKD, providing approximately 7% buffer from the current price [8]


平保技術面改善,升浪即將啟動?
Ge Long Hui· 2025-10-29 05:08
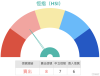
Core Viewpoint - Ping An Insurance's stock is currently experiencing a state of indecision, with technical indicators showing mixed signals, suggesting potential for both upward and downward movements in the near term [1][3]. Technical Analysis - As of October 28, Ping An's stock closed at HKD 56, a slight increase of 0.63%, with a trading volume of HKD 1.339 billion. On October 29, the stock rose to HKD 56.4, up 0.71%, with a volume of 11.78 million shares [1]. - The stock is at a critical technical point, with support at HKD 54.3 and significant support at HKD 52.8. Resistance is noted at HKD 56.9, and a breakout above this level could lead to a target of HKD 59.2 [3]. - Various oscillators are showing signs of strengthening, with MACD and Bollinger Bands indicating buy signals, while the RSI remains stable at 60, indicating accumulating momentum. However, moving averages still show weakness, highlighting a divergence in signals [1][3]. Derivative Products Performance - Recent performance of derivative products linked to Ping An has been notable, with UBS's bull certificate (61834) yielding a 10% return over two days despite a 0.81% rise in the underlying stock. HSBC's bull certificate (59775) also saw an 8% increase during the same period [4]. - In terms of call options, UBS's call option (21408) offers a leverage of 10.5 times with a strike price of HKD 66.71, while Bank of China’s call option (17070) provides a leverage of 10.1 times, both featuring low premiums [7]. Market Outlook - The current volatility of Ping An's stock is relatively mild, with a 5-day volatility of only 3.4%, providing a stable trading environment for investors. Despite mixed technical indicators, active trading suggests ongoing interest from capital [12].

半導體股熱度再起,華虹短線走勢全解析
Ge Long Hui· 2025-10-28 08:10
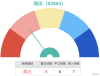
Group 1 - The semiconductor sector has regained market attention, with Huahong's stock price rising to 84.2 HKD, up 1.27%, and reaching a peak of 87.55 HKD during the day [1] - Technically, Huahong has successfully surpassed all major moving averages, with MA10 at 78.55 HKD, MA30 at 73.2 HKD, and MA60 at 60.68 HKD, indicating a clear bullish arrangement [1] - The stock is approaching a key resistance level at 94.4 HKD, which will determine the future market direction, while the RSI indicates a recovery in buying momentum at 64 [1] Group 2 - The recent performance of derivative products has shown significant leverage effects, with warrants like the 18768 soaring 67% and the 19857 rising 46%, far exceeding the underlying stock's increase of 16.22% [3] - Current notable call warrants include the 21228 and 15312, with exercise prices around 96.08 HKD and 97.88 HKD, offering leverage of approximately 2.7 to 2.9 times [6] - For bearish investors, put warrants such as the 21463 and 22882, with exercise prices at 70 HKD and 69.95 HKD, provide about 2.3 times leverage and are suitable for hedging against potential price corrections [6] Group 3 - There is ongoing discussion regarding whether Huahong's recent price increase is a technical rebound or driven by fundamental factors amid expectations of a semiconductor industry cycle recovery [9]

舜宇光學挑戰關鍵阻力!手機鏡頭龍頭蓄勢待發?
Ge Long Hui· 2025-10-24 12:04
Core Viewpoint - The stock price of Sunny Optical has shown rebound momentum after finding solid support at 76.7 HKD, currently trading at 79.73 HKD, indicating a critical decision point for the stock [1] Technical Analysis - The stock is currently at a key decision point, with a resistance level at 84.5 HKD and a strong support at 70.2 HKD, providing clear risk reference for short-term operations [1] - The RSI is at 46, suggesting there is still ample room for upward movement, while multiple technical indicators signal a buy, including momentum oscillators and bullish power indicators [1] - However, MACD and Bollinger Bands maintain sell signals, indicating that the medium to long-term trend has not fully reversed [1] - The stock is oscillating between MA30 (83.32 HKD) and MA60 (81.09 HKD), which will be important references for short-term trends [1] - The 5-day volatility is at 7%, with a 55% probability of an upward movement, raising questions about whether Sunny Optical can break through the 83.32 HKD resistance in the short term [1] Derivative Products Performance - Recent performance of warrants related to Sunny Optical has shown significant leverage effects, with various products recording returns exceeding the underlying stock's 1.34% increase [3] - On October 20, warrants from Societe Generale and HSBC achieved approximately 6% gains, while JPMorgan's warrants reached a 7% return [3] Product Selection Strategy - For bullish investors, two warrants are highlighted: Societe Generale's warrant (13939) with a leverage of 6.9 times and a strike price of 89.5 HKD, and another from Barclays (15410) offering 7.7 times leverage with a strike price of 89.55 HKD [6] - For those preferring bull certificates, JPMorgan's (65073) and Barclays' (64719) products provide over 7 times actual leverage, suitable for higher risk tolerance investors [6] Bearish Strategy and Risk Management - Cautious investors can consider bearish tools, such as HSBC's put warrant (21077) and JPMorgan's put warrant (20409), both offering around 3.2 times leverage [8] - JPMorgan's bear certificate (65062) provides the highest leverage among similar products at 6.1 times, with a redemption price of 92 HKD [8] Short-term Product Considerations - Short-term products expiring in December are noted for their high leverage, potentially reaching 7 to 8 times, but they also carry significant time value decay risks [10][11] - Investors are advised to consider longer-term products expiring in April, which offer lower time value decay and are generally safer [13]

10月23日【港股Podcast】恆指、京東、藥明生物、百度、中國聯通、李寧
Ge Long Hui· 2025-10-24 05:09
Group 1: Hang Seng Index (HSI) Analysis - The Hang Seng Index (HSI) experienced a slight increase of 0.72%, closing at 25,967 points, just below the 26,000 mark [1] - Market sentiment is mixed, with both bullish and bearish perspectives present, which is a normal market phenomenon [1] - Technical signals indicate a predominance of "sell" signals, with 8 sell signals compared to 6 buy signals, suggesting a cautious outlook [1] - The support level for HSI is around 25,400 points; if it falls below this, it may drop further to 24,600 points [2] - The resistance level is approximately 26,500 points, and investors are advised to consider bear certificates with a redemption price around 26,400 points [2] Group 2: JD Group (09618) Analysis - JD Group's stock closed at 128.7 yuan, with a support level at 124.3 yuan; a drop below this could lead to further declines to 117.7 yuan [9] - Some investors anticipate a rise to around 130 yuan before considering bearish positions, aligning with the current technical signals that favor buying [10] - The short-term resistance level for JD is approximately 135 yuan, indicating potential upward movement before any bearish actions [10] Group 3: WuXi Biologics (02269) Analysis - WuXi Biologics' stock has shown a slight decline with increased trading volume, indicating a potential buying opportunity [15] - The current support level is around 33.8 yuan; if this level is breached, the stock may drop to 30 yuan [15] - Despite the bearish sentiment, short-term technical signals are predominantly "buy," suggesting a favorable buying atmosphere [15] Group 4: Baidu Group (09888) Analysis - Baidu's stock is in a stable consolidation phase, with a support level at 111.3 yuan; a drop below this could lead to further declines to 98.4 yuan [21] - The short-term technical signals favor buying, with 10 buy signals against 5 sell signals, indicating potential for upward movement [21] - Investors are advised to consider bull certificates with a redemption price around 80 yuan for added safety [21] Group 5: China Unicom (00762) Analysis - China Unicom's stock closed at 9.39 yuan, near the upper limit of the Bollinger Bands, with a resistance level at 9.67 yuan [27] - A breakthrough of the 9.67 yuan resistance could lead to further increases towards 9.85 yuan, but reaching 10 yuan may take time [27] - The short-term technical signals are neutral, indicating no clear direction for price movement [27] Group 6: Li Ning (02331) Analysis - Li Ning's stock has shown strong performance, with a resistance level at 19.6 yuan; breaking this could lead to further increases towards 19.8 yuan [33] - The current technical signals are neutral, suggesting a lack of clear upward or downward momentum [33] - Investors are encouraged to monitor market trends and consider various sources of information for informed decision-making [33]
BTC上下畫門!波動急劇放大!反彈實在太難了?
提阿非羅大人TiaBTC· 2025-10-22 17:12
Market Analysis - Bitcoin experienced a dramatic price movement, initially rising towards previous highs before a sharp decline, ultimately closing as a bearish candlestick [1] - Liquidity heatmap analysis revealed concentrated liquidity above the recent price action, suggesting a hunt for stop-loss orders before the downward move [1] - The analyst suggests that news events, such as rumors of a potential ceasefire in the Russia-Ukraine war, may have contributed to Bitcoin's volatility [1] - Ethereum's upward movement is heavily reliant on Bitcoin's performance, facing difficulties in rallying independently to fill gaps [1] Trading Strategy - The analyst anticipates a potential deeper correction on the daily chart, suggesting a bearish outlook and favoring adding to short positions on rallies [1] - The analyst advises caution on short-term long positions due to the recent volatility and recommends waiting for rallies to higher levels to add to short positions [1] - The analyst suggests that if the market structure shifts to create a lower low, a lower high could form, presenting a potential shorting opportunity [1] - The analyst identifies potential short-term long opportunities near specific support levels but emphasizes the importance of patience and waiting for favorable shorting opportunities in line with the overall trend [1] Risk Management - The analyst emphasizes the importance of technical analysis as the primary guide for trading decisions, while acknowledging the potential influence of news events [1] - The analyst recommends using Bybit, Binance, and OKX exchanges, highlighting their discounted fee structures and offering access to a Discord community for small trading volumes [1]

國壽70%業績暴增後沖高!26.6元阻力能否突破?
Ge Long Hui· 2025-10-22 13:02
Core Viewpoint - China Life Insurance (02628) has shown strong performance with a projected net profit increase of 70% for the first three quarters, estimated between RMB 156.785 billion and RMB 177.689 billion, leading to a significant rise in stock price by 6.04% to HKD 24.94 [1][3]. Financial Performance - The company reported a net profit growth of 70% for Q3, with estimates ranging from RMB 156.785 billion to RMB 177.689 billion [1]. - The stock price surged to HKD 24.94, with a trading volume of HKD 4.224 billion, making it a leader in the insurance sector [1]. Market Sentiment - Analysts expect insurance stocks to perform well, supported by government encouragement for long-term capital investment since September last year [1]. - The positive market sentiment is reflected in the recent performance of China Life and Ping An (2318), both showing substantial price increases [1]. Technical Analysis - Technical indicators show mixed signals, with a sell signal strength of 8, while the RSI is at 62, indicating a 53% probability of price increase [1]. - Key support levels are identified at HKD 22.9 and HKD 22.2, while resistance levels are at HKD 26.6 and potentially HKD 27.7 if broken [1]. Derivative Products Performance - Recent call options related to China Life have performed exceptionally well, with a 58% increase in the Morgan Stanley call option (18417) and a 45% increase in the Bank of China call option (17488) [3]. - This performance highlights the potential for leveraged products in a volatile market [3]. Investment Products - Recommended call options include UBS call option (18990) and HSBC call option (19042), both with a leverage of 5.6 times and a strike price of HKD 28.05 [4]. - For bearish positions, Bank of China put option (19617) and UBS put option (19408) are suggested, with leverage of 5.9 times and 5.6 times, respectively [4].

油價波動下的機會:海田(02883)短線技術面全解析
Ge Long Hui· 2025-10-22 11:57
Core Viewpoint - Recent fluctuations in international oil prices have drawn attention to oil service stocks, particularly Hai Tian (02883), which is currently trading at 7.1 HKD, up 3.05%. The stock is at a critical point in a triangular consolidation pattern, indicating a potential directional choice in the short term [1]. Technical Analysis - The stock price of Hai Tian is hovering around the MA10 and MA30 at 6.84 HKD, with MA60 at 7.00 HKD acting as resistance. Despite an overall "sell" signal with a strength of 8, several leading indicators suggest a potential turnaround. The RSI is at 53, indicating a neutral zone, while the stochastic oscillator has issued a buy signal, particularly the momentum oscillator indicating oversold conditions that may lead to a bottom formation [2]. - Key support levels are at 6.74 HKD (first support) and 6.54 HKD (second support), while resistance levels are at 7.14 HKD (first resistance) and 7.34 HKD (second resistance) [2]. Market Environment - Major securities firms, such as Everbright Securities, have reported that in the context of increasing external uncertainties and significant oil price fluctuations, the "Big Three" oil companies (China National Petroleum, Sinopec, and CNOOC) will continue to enhance their production capacity. Their respective oil and gas equivalent production plans for 2025 are projected to grow by 1.6%, 1.5%, and 5.9% [1]. - The ongoing efforts to increase output while reducing costs are expected to highlight the long-term investment value of these companies, with market speculation suggesting that Hai Tian's stock price could rise above 8 HKD [1]. Derivative Opportunities - In the warrant market, although there are relatively few options for Hai Tian, the implied volatility tends to increase explosively when market movements occur. Investors optimistic about the recovery of the oil service sector may consider out-of-the-money call options, such as the Macquarie call option 26675 and the JPMorgan call option 15278, both with a strike price of 8.8 HKD and premiums around 27%, with implied volatilities of 53% and 51% respectively [4].
快手短線佈局:關鍵位置的多空博弈
Ge Long Hui· 2025-10-22 11:42
Core Viewpoint - Kuaishou (01024) is attracting market attention due to unique technical signals amid a recent rebound in Hong Kong tech stocks, with a stock price fluctuation between 70.4 and 81.7 HKD, closing at 74.1 HKD with a trading volume of 1.9 billion HKD, indicating increasing capital interest [1]. Technical Analysis - Kuaishou is on the verge of a critical breakout, with 70.4 HKD as a significant support level and 61.6 HKD as a strong bottom defense. A successful upward breakout above 81.7 HKD could lead to a target of 87.7 HKD. The moving average system has issued a "strong buy" signal, with MA10 at 80.12 HKD and MA30 at 78.16 HKD, suggesting accumulating rebound momentum [2]. - Multiple technical indicators are showing positive signals: the RSI is at 43, indicating it has not yet entered the overbought zone, while the Williams indicator shows oversold conditions and issues a buy signal. The stochastic oscillator also provides clear buy guidance. Momentum oscillators and VR ratio indicators confirm the "strong buy" technical summary, although MACD signals and Bollinger Bands remain negative, creating a nuanced balance for investors [2]. Signal Summary - The overall signal summary indicates 15 buy signals and no sell signals, with a strong buy signal noted [4]. Historical Product Performance - On October 14, Kuaishou-related derivatives showed robust returns, with UBS bull certificates (59046) rising 12% over the next two trading days, outperforming the underlying stock's 1.33% increase. HSBC bull certificates (59410) also performed well with an 11% return, while Bank of China call options (17442) increased by 6%, demonstrating the profitability of derivatives in a moderate upward market [4]. Selected Derivative Product Strategies - HSBC call options (18362) offer a leverage of 3.4 times with a strike price of 77 HKD, making it a quality choice for investors seeking stable returns. For cautious investors, Guotai Junan put options (19765) provide 3.9 times leverage with a strike price of 68.33 HKD, featuring low premiums and favorable implied volatility. Bank of China put options (19035) also offer 3.5 times leverage with a strike price of 68.83 HKD, catering to risk-averse investors [7]. - UBS bull certificates (59046) provide 7.2 times actual leverage with a redemption price set at 67 HKD, while HSBC bull certificates (59410) offer 6.4 times actual leverage with a redemption price of 66 HKD. Among bear certificates, UBS bear certificates (67316) provide 5 times actual leverage with a redemption price of 88 HKD, and Societe Generale bear certificates (65908) offer 5.1 times actual leverage with the lowest premium [10]. Market Sentiment - Recent discussions among investors indicate a mixed sentiment towards Kuaishou, with some expressing bearish views and seeking support levels for entry. The current support level is around 70.4 HKD, with potential declines to 61.6 HKD if this level is breached. The technical signals suggest a "strong buy" despite the stock's previous decline from 92.6 HKD to 74.1 HKD, indicating a potential for short-term trading opportunities [11][12].

10月20日【港股Podcast】恆指、快手、金沙、小米、比亞迪電子、中海油
Ge Long Hui· 2025-10-21 04:06
Market Overview - The Hong Kong stock index experienced a notable increase, closing at 25,858 points, showing a recovery from previous declines, although trading volume was relatively low [2] - Investors have mixed sentiments; some anticipate a continued upward trend towards 26,000 points or even 26,500 points, while others remain cautious due to low trading activity [2] Technical Signals - Current technical signals indicate a predominance of "buy" signals, with 8 buy signals and 7 sell signals, suggesting a slightly optimistic market sentiment [3] - The resistance level is identified at approximately 26,436 points, with a potential upward movement towards 27,000 points if this level is breached [4] Individual Stock Analysis Kuaishou-W (01024) - Kuaishou's stock price has shown a slight recovery, but overall sentiment remains bearish, with a current support level at 70.4 yuan; a drop below this could lead to further declines [5][7] - Short-term technical signals for Kuaishou indicate a "strong buy," suggesting potential for upward movement despite the overall weak sentiment [8] Sands China - Sands China's stock price increased by about 4.3%, with a current support level at 18 yuan; if this level is breached, it could drop to 16 yuan [11] - Technical signals for Sands China are predominantly "buy," with 10 buy signals and 5 sell signals, aligning with positive investor sentiment [11] Xiaomi Group-W (01810) - Xiaomi's stock price has rebounded slightly after a significant drop, with a current support level at 45.1 yuan; a breach could lead to a decline to 40.5 yuan [14] - The short-term technical signals for Xiaomi show a "strong buy," indicating potential for upward movement [14] BYD Electronic (00285) - BYD Electronic's stock price has also seen a slight recovery, with a support level at 37.4 yuan; a drop below this could lead to a decline to 34.3 yuan [18] - The technical signals for BYD Electronic are primarily "buy," with 10 buy signals and 5 sell signals, reflecting a slight improvement in market sentiment [18] CNOOC (00883) - CNOOC's stock price has risen to 19.04 yuan, standing above the middle line of the Bollinger Bands; however, 19 yuan is seen as a challenging resistance level [21] - Current technical signals are neutral, indicating uncertainty about the stock's ability to break through the 19 yuan level [21]