易方达
Search documents
机器人板块延续调整,机器人ETF易方达(159530)逆势获2000万份净申购
Sou Hu Cai Jing· 2025-10-16 04:58
Group 1 - The index experienced a rise of 0.9% at midday closing, with a rolling price-to-earnings ratio of 63.5 times, reflecting a valuation increase of 98.9% since its inception [4] - Another index showed an increase of 1.5% at midday closing, with a rolling price-to-earnings ratio of 32.6 times, indicating a valuation increase of 46.8% since its inception [5]


中证A500ETF平均收益超20%,见证A股反弹
21世纪经济报道· 2025-10-16 00:07
Core Viewpoint - The China Securities A500 Index has rapidly grown from a market size of 20 billion to 300 billion within a year, marking a significant milestone in the development of core broad-based indices in the A-share market [1] Market Development - The China Securities A500 Index was officially launched on September 23, 2024, following the "National Nine Articles" policy, and has seen substantial participation from major fund companies [1] - By October 15, 2024, the first batch of A500 ETFs was listed, with over 40 related funds reported, indicating strong market interest and investment [1] - As of October 24, 2024, the total scale of A500 ETFs reached 413.44 billion, showcasing rapid growth and investor confidence [7] Performance Metrics - The A500 Index has outperformed other major indices, with a one-year increase of 18.27%, surpassing the CSI 300 and Shanghai Composite Index [5] - The average return of the first batch of A500 ETFs since their inception is approximately 20.56%, reflecting strong market performance [5][6] Institutional Investment - Institutional investors hold a significant portion of A500 ETFs, with an average holding ratio of 90.05% as of June 30, 2025, indicating strong institutional confidence [12] - The index has attracted diverse institutional participation, including insurance, pension funds, and foreign investments, enhancing its market credibility [12] Index Composition and Strategy - The A500 Index comprises 500 large-cap stocks, balancing market representation and industry diversity, aimed at reflecting the performance of key sectors in the national economy [4] - The index is strategically positioned to benefit from China's economic transformation, with over 35% of its components being specialized and innovative companies [15][16] Future Outlook - The index is expected to continue its growth trajectory, supported by ongoing policy incentives and the increasing international interest in Chinese assets [13][14] - The A500 Index is anticipated to become a key tool for long-term investment strategies, particularly as it gains recognition among global investors [12][13]

创业板指全天大涨2.4%,重回3000点,创业板ETF(159915)成交活跃
Sou Hu Cai Jing· 2025-10-15 11:37
Group 1 - The ChiNext Index rose by 2.4%, the ChiNext Growth Index increased by 2.3%, and the ChiNext Mid-cap 200 Index went up by 1.9%, with the ChiNext ETF (159915) achieving a trading volume exceeding 5.5 billion yuan [1] - Guotai Junan Securities indicated that due to complex geopolitical and economic conditions, sectors that are easily falsifiable in data and policy are not good choices, suggesting a focus on industrial development, "anti-involution," and stable value targets, with new technology as the main theme and cyclical and financial sectors as dark horses [1] Group 2 - The ChiNext Growth ETF from E Fund tracks the ChiNext Growth Index, which consists of 50 stocks characterized by growth style, high performance growth, good profit expectations, and strong liquidity, with the information technology sector accounting for over 40% [3] - The communication, power equipment, electronics, non-bank financial, and pharmaceutical industries together account for nearly 80% of the ChiNext Growth Index [3]

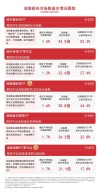
中证A500ETF上市一周年:“新宽基”与A股慢牛一路同行
2 1 Shi Ji Jing Ji Bao Dao· 2025-10-15 11:37
Core Insights - The China Securities A500 Index has rapidly grown from a market size of 20 billion to 300 billion within a year, marking a significant milestone in the index investment landscape [1][2][8] - The index was officially launched on September 23, 2024, and has since seen a surge in related ETF products, with over 80 fund managers participating in its development [1][2][12] Market Performance - The A500 Index has demonstrated an average return of over 20% in the past year, outperforming major indices like the CSI 300 and the Shanghai Composite Index [3][4] - As of October 14, 2024, the A500 Index recorded a growth of 18.27%, while the first batch of A500 ETFs achieved an average return of 20.56% [3][4] Fund Growth and Scale - The first batch of A500 ETFs raised 20 billion upon issuance and reached a total scale of 413.44 billion within just eight trading days [6][7] - By June 30, 2025, the total scale of A500-related funds exceeded 305.3 billion, making it the second-largest broad-based index in A-shares after the CSI 300 [8][9] Institutional Investment - Institutional investors hold a significant portion of A500 ETFs, with an average holding ratio of 90.05% as of mid-2025, indicating strong institutional confidence [9][10] - The index has attracted diverse institutional participation, including insurance, pension funds, and foreign investments [9][10] Economic Impact and Future Outlook - The A500 Index is seen as a key tool for long-term capital allocation, reflecting the structural transformation of the Chinese economy with over 35% of its components being specialized and innovative stocks [12][13] - The index's composition is aligned with emerging industries such as technology and renewable energy, positioning it as a favorable investment vehicle for capturing economic transition benefits [12][13]
天府证券ETF日报-20251015
天府证券· 2025-10-15 09:07
Report Industry Investment Rating - Not provided in the content Core View - On October 15, 2025, the A-share market showed an overall upward trend, with the Shanghai Composite Index rising 1.22% to 3912.21 points, the Shenzhen Component Index rising 1.73% to 13118.75 points, and the ChiNext Index rising 2.36% to 3025.87 points. The trading volume of A-shares in the two markets was 2090.7 billion yuan. The sectors with the highest gains were power equipment (2.72%), automobiles (2.37%), and electronics (2.29%), while the sectors with the highest losses were steel (-0.21%) and petroleum and petrochemicals (-0.14%) [2][6] Summary by Directory Market Overview - The Shanghai Composite Index rose 1.22% to 3912.21 points, the Shenzhen Component Index rose 1.73% to 13118.75 points, and the ChiNext Index rose 2.36% to 3025.87 points. The trading volume of A-shares in the two markets was 2090.7 billion yuan. The sectors with the highest gains were power equipment (2.72%), automobiles (2.37%), and electronics (2.29%), while the sectors with the highest losses were steel (-0.21%) and petroleum and petrochemicals (-0.14%) [2][6] Stock ETF - The top-trading-volume stock ETFs on this day were E Fund ChiNext ETF (up 2.35%, discount rate 2.33%), Huaxia Shanghai Stock Exchange Science and Technology Innovation Board 50 ETF (up 1.35%, discount rate 1.37%), and Huaxia CSI A500 ETF (up 1.49%, discount rate 1.57%) [3][7] Bond ETF - The top-trading-volume bond ETFs on this day were Haifutong CSI Short-term Financing ETF (up 0.00%, discount rate -0.02%), Cathay CSI AAA Science and Technology Innovation Corporate Bond ETF (down 0.04%, discount rate -0.19%), and Southern Shanghai Stock Exchange Benchmark Market-making Corporate Bond ETF (down 0.06%, discount rate -0.36%) [4][9] Gold ETF - Gold AU9999 rose 1.95%, and Shanghai Gold rose 2.30%. The top-trading-volume gold ETFs were Huaan Gold ETF (up 2.35%, discount rate 2.07%), E Fund Gold ETF (up 2.52%, discount rate 1.96%), and Boshi Gold ETF (up 2.56%, discount rate 2.02%) [12] Commodity Futures ETF - Dacheng Non-ferrous Metals Futures ETF rose 0.96%, discount rate -0.10%; Jianxin Yisheng Zhengzhou Commodity Exchange Energy and Chemical Futures ETF rose 0.16%, discount rate -0.58%; Huaxia Feed Soybean Meal Futures ETF had a change of 0.00%, discount rate 3.60% [13] Cross-border ETF - The previous trading day, the Dow Jones Industrial Average rose 0.44%, the Nasdaq fell 0.76%, the S&P 500 fell 0.16%, and the German DAX fell 0.62%. On this day, the Hang Seng Index rose 1.84%, and the Hang Seng China Enterprises Index rose 1.89%. The top-trading-volume cross-border ETFs were E Fund CSI Hong Kong Securities Investment Theme ETF (up 3.14%, discount rate 3.67%), Huatai-PineBridge Hang Seng Technology ETF (up 2.15%, discount rate 2.92%), and GF CSI Hong Kong Innovative Drug ETF (up 2.65%, discount rate 3.27%) [15] Money ETF - The top-trading-volume money ETFs on this day were Yin Hua Day Profit ETF, Hua Bao Add Benefit ETF, and Money ETF Jianxin Add Benefit [17]
机器人板块午后拉升,机器人ETF易方达(159530)标的指数涨超2%
Mei Ri Jing Ji Xin Wen· 2025-10-15 06:41
Core Insights - The A-share technology sector, particularly the robotics segment, experienced a significant rise, with the National Robotics Industry Index increasing by 2.1% as of 14:15. The E Fund Robotics ETF (159530) recorded a trading volume exceeding 500 million yuan, with a net inflow of over 6 billion yuan since September [1] Industry Developments - The Shanghai Municipal Economic and Information Commission released the "Shanghai Intelligent Terminal Industry High-Quality Development Action Plan (2026-2027)", aiming to develop humanoid robots that are capable of communication, emotional intelligence, and skills. The plan supports the research and mass production of humanoid robots and promotes the industrialization of core components such as edge chips, dexterous hands, and batteries [1] Market Trends - According to a report from Guotai Haitong Securities, the humanoid robot industry has made significant progress both domestically and internationally, indicating a rapid commercialization of the sector. The report suggests that short-term focus should be on industry fluctuations driven by events, while long-term attention should be on high-quality companies with certainty in the supply chain [1] Investment Opportunities - The National Robotics Industry Index emphasizes humanoid robots and core components, with related stocks accounting for nearly 80% of the index weight. The E Fund Robotics ETF (159530) has reached a scale of 11.8 billion yuan, making it the largest product tracking this index, providing investors with a streamlined way to invest in the humanoid robotics industry chain [1]
指数集体涨超1%,恒生科技ETF易方达(513010)、港股通互联网ETF(513040)助力布局港股新经济发展机会
Mei Ri Jing Ji Xin Wen· 2025-10-15 05:54
Group 1 - The core indices related to Hong Kong stocks, including the CSI Hong Kong Stock Connect Consumer Theme Index, CSI Hong Kong Stock Connect Internet Index, and others, have shown positive performance with increases of 1.7%, 1.7%, 1.6%, 1.5%, and 1.2% respectively as of midday close [1] - The net inflow for the Hang Seng Technology ETF (513010) and the Hong Kong Stock Connect Internet ETF (513040) reached 3.6 billion and 2.5 billion respectively over the past month [1] Group 2 - The CSI Hong Kong Stock Connect Consumer Theme Index is composed of 50 major consumer stocks with a nearly 60% allocation to discretionary consumption, and it has a rolling price-to-earnings ratio of 21.1 times [4]
反内卷新政策预期再起,光伏价格有望迎来新一轮修复
Sou Hu Cai Jing· 2025-10-15 05:41
Core Viewpoint - The relevant authorities are expected to release a document soon to strengthen the regulation of photovoltaic production capacity, further restricting the operating rate and prohibiting new capacity to achieve a balance between supply and demand in the industry [1] Industry Summary - The photovoltaic industry has seen a general increase in pricing across various segments, indicating a potential new phase of reversing the "involution" trend [1] - Multiple measures have been implemented since the reversal of involution, effectively stabilizing and stopping the decline in photovoltaic prices [1] - The anticipation of new policies is likely to attract renewed investment interest in the reversal of involution themes, creating a resonance between expectations and reality as prices rise [1] Company Summary - The E Fund Photovoltaic ETF (562970, linked funds A/C: 017646/017647) tracks the CSI Photovoltaic Industry Index, focusing on leading companies across the entire photovoltaic industry chain [1] - The ETF has a high industry purity and is expected to benefit significantly from the "reversal of involution" theme, making it a core target for capturing the recovery of profit expectations behind this trend [1]
日本股市震荡走强,多只日经225相关ETF涨超2%
Mei Ri Jing Ji Xin Wen· 2025-10-15 05:27
Core Viewpoint - The Japanese stock market experienced a strong upward movement today, with the Nikkei 225 index rising over 1.5% [1] Group 1: Market Performance - Multiple Nikkei 225 related ETFs saw gains exceeding 2% [1] - Specific ETF performances include: - Nikkei 225 ETF E Fund: Current price 1.766, up 2.61% [2] - Nikkei ETF: Current price 1.316, up 2.49% [2] - Nikkei ETF: Current price 1.756, up 2.27% [2] - Nikkei 225 ETF: Current price 1.650, up 1.85% [2] Group 2: Influencing Factors - Trump's increasingly moderate stance on tariffs, along with confirmation from the U.S. Treasury Secretary regarding a planned meeting between Trump and Asian leaders in South Korea at the end of October, is expected to boost market confidence [1]

大盘震荡上涨,A500ETF易方达(159361)、沪深300ETF易方达(510310)助力布局核心资产
Sou Hu Cai Jing· 2025-10-15 04:57
Market Overview - The A-share market experienced a volatile upward trend, with over 3,200 stocks in the market showing gains. Sectors such as innovative drugs, beauty care, airport shipping, retail, complete automobiles, and software development led the gains, while sectors like photolithography, port shipping, military equipment, rare earth permanent magnets, controllable nuclear fusion, and non-ferrous metals saw declines [1] - The Hong Kong stock market rebounded collectively, with major internet companies generally rising, and innovative drugs showing signs of recovery [1] Index Performance - As of the midday close, the CSI A500 index decreased by 0.04%, the CSI 300 index fell by 0.03%, the ChiNext index rose by 0.2%, and the SSE STAR 50 index dropped by 0.6%. The Hang Seng China Enterprises Index increased by 1.1% [1] - The CSI 300 index consists of 300 stocks from the Shanghai and Shenzhen markets, covering 11 primary industries, with a rolling P/E ratio of 14.1 times and a valuation percentile of 64.5% since its inception in 2005 [3] - The CSI A500 index includes 500 securities from various industries, covering 91 out of 93 tertiary industries, with a rolling P/E ratio of 16.7 times and a valuation percentile of 71.8% since its inception in 2004 [3] - The ChiNext index, which tracks 100 stocks from the ChiNext board, has a rolling P/E ratio of 41.7 times and a valuation percentile of 37.1% since its inception in 2010 [3] - The SSE STAR 50 index, composed of 50 stocks from the STAR market, has a rolling P/E ratio of 180.4 times and a valuation percentile of 98.6% since its inception in 2020 [3] Hong Kong Market Index - The H-share ETF tracks the Hang Seng China Enterprises Index, which consists of 50 large-cap, actively traded stocks listed in Hong Kong, covering a wide range of industries. The index increased by 1.1% with a rolling P/E ratio of 10.5 times and a valuation percentile of 64.1% since its inception in 2002 [4]
