基金管理
Search documents
公募REITs周报(第39期):指数止跌回暖,换手率上行-20251027
Guoxin Securities· 2025-10-27 03:29
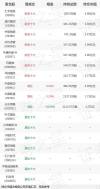
Report Industry Investment Rating No relevant content provided. Core Views - This week, the China Securities REITs Index stopped falling and rebounded, rising 0.2% for the week. The average weekly price changes of property - type REITs and franchise - type REITs were +0.1% and +0.7% respectively. In terms of the comparison of the weekly price changes of major indices: CSI 300 > CSI Convertible Bond Index > CSI REITs Index > CSI Aggregate Bond Index [1]. - Most sectors closed up, with water conservancy facilities, municipal facilities, and new infrastructure leading the gains. As of October 24, 2025, the dividend yield of property REITs was 83 basis points higher than the average dividend yield of CSI Dividend stocks, and the spread between the average internal rate of return of franchise - type REITs and the 10 - year Treasury yield was 210 basis points [1]. - E Fund Guangxi Beitou Expressway REIT was officially declared. This is the first publicly - offered REIT product declared by a local enterprise in Guangxi, marking an important breakthrough in the in - depth linkage between local infrastructure and the capital market [1]. Summary by Related Catalogs Secondary Market Trends - As of October 24, 2025, the closing price of the CSI REITs (closing) Index was 816.04 points, with a weekly price change of +0.2%. It performed worse than the CSI Convertible Bond Index (+1.5%) and the CSI 300 Index (+3.2%), but better than the CSI Aggregate Bond Index (0.0%). Year - to - date, the price change rankings of major indices were: CSI 300 (+18.4%) > CSI Convertible Bond Index (+16.1%) > CSI REITs Index (+3.4%) > CSI Aggregate Bond Index (+0.4%) [2][6]. - In the past year, the return rate of the CSI REITs Index was 5.2%, with a volatility of 7.3%. The return rate was lower than that of the CSI 300 Index and the CSI Convertible Bond Index, but higher than that of the CSI Aggregate Bond Index. The volatility was lower than that of the CSI 300 Index and the CSI Convertible Bond Index, but higher than that of the CSI Aggregate Bond Index [2][11]. - The total market value of REITs rose to 218.8 billion yuan on October 24, an increase of 500 million yuan from the previous week. The average daily turnover rate for the whole week was 0.52%, an increase of 0.13 percentage points from the previous week [2][11]. Sector Performance - As of October 24, 2025, from the perspective of different project attributes, the average weekly price changes of property - type REITs and franchise - type REITs were +0.1% and +0.7% respectively. From the perspective of different project types, most REIT sectors closed up, with water conservancy facilities, municipal facilities, and new infrastructure leading the gains [3][16]. - The top three REITs in terms of weekly price increases were ICBC Mongolia Energy Clean Energy REIT (+4.06%), AVIC Yishang Warehouse Logistics REIT (+3.58%), and Zheshang Shanghai - Hangzhou - Ningbo REIT (+3.23%) [3][20]. - Water conservancy facilities REITs had the highest trading activity. In terms of different project types, water conservancy facilities REITs had the highest average daily turnover rate during the period, with an average daily turnover rate of 1.0%. Transportation infrastructure REITs had the highest trading volume share this week, accounting for 18.9% of the total REIT trading volume [3][23]. - In terms of the capital flow of different REIT products this week, the top three in terms of net inflow of main funds were CICC In - City Mall Consumption REIT (10.04 million yuan), China Merchants Fund Shekou Rental Housing REIT (7.32 million yuan), and Yin Hua Shaoxing Raw Water Water Conservancy REIT (4.34 million yuan) [3][24]. Primary Market Issuance - From the beginning of the year to October 24, 2025, there were 2 REIT products in the "accepted" stage on the exchange, 1 in the "declared" stage, 1 in the "inquired" stage, 5 in the "feedback" stage, 7 products that had passed and were waiting to be listed, and 12 first - issued products that had passed and were already listed [26]. Valuation Tracking - REITs have both bond - like and stock - like characteristics. From the bond - like perspective, under the constraint of mandatory high dividends, the average annualized cash distribution rate of publicly - offered REITs was 6.5% as of October 17. From the stock - like perspective, the valuation of REITs was judged through relative net value premium rate, IRR, and P/FFO [28]. - As of October 24, 2025, the dividend yield of property REITs was 83 basis points higher than the average dividend yield of CSI Dividend stocks, and the spread between the average internal rate of return of franchise - type REITs and the 10 - year Treasury yield was 210 basis points [31]. Industry News - E Fund Guangxi Beitou Expressway Closed - end Infrastructure Securities Investment Fund was officially declared. The project initiator was Guangxi Beibu Gulf Investment Group Co., Ltd., and the manager was E Fund Management Co., Ltd. Guangxi Beibu Gulf Investment Group Co., Ltd. is a large - scale wholly - state - owned enterprise directly under the People's Government of Guangxi Zhuang Autonomous Region, mainly engaged in infrastructure investment, financing, and construction such as comprehensive transportation, port logistics, and environmental protection water services [4][33].
基金经理任内亏损近40%,还指挥好友“抄作业”
Zhong Guo Jing Ji Wang· 2025-10-27 02:52
Group 1 - The Shanghai Securities Regulatory Commission announced a penalty of 500,000 yuan against Yang Ningjia for engaging in insider trading activities, specifically for using non-public information to suggest trading actions to others [1][3]. - Yang Ningjia had a controversial tenure at Hai Fu Tong Fund, where he served as a stock analyst and fund manager, with significant losses reported in the products he managed [2][4]. - During his management, the Hai Fu Tong Electronic Information Media Industry fund experienced a loss of 13.51%, despite a strong performance in the TMT sector, attributed to his heavy investment in the new energy sector [4][5]. Group 2 - Yang Ningjia's management saw the total scale of funds reach a peak of 1.735 billion yuan by the second quarter of 2023, but this dropped to 617 million yuan by the third quarter of 2024 [4]. - The performance of the funds under Yang's management was poor, with two products recording significant losses of 39.52% and 20.39%, ranking in the bottom 30% of their peers [5]. - The trend of regulatory penalties for fund managers involved in insider trading is notable, with similar cases resulting in fines despite the lack of profitable outcomes from the trades [7].


中欧优利债券基金成立 规模19.5亿元
Zhong Guo Jing Ji Wang· 2025-10-27 02:31
Core Viewpoint - The announcement details the effective contract of the China Europe Fund's China Europe Youli Bond Fund, highlighting its successful fundraising and management team background [1][2][3] Fund Details - Fund Name: China Europe Youli Bond Fund [2] - Fund Abbreviation: China Europe Youli Bond [2] - Fund Main Code: 025305 [2] - Fund Operation Type: Contractual, Open-ended [2] - Fund Contract Effective Date: October 24, 2025 [2] - Fund Manager: China Europe Fund Management Co., Ltd. [2] - Fund Custodian: Bank of China Co., Ltd. [2] Fundraising Information - Total Net Subscription Amount During Fundraising: ¥1,951,405,398.56 [1][3] - Interest Earned During Fundraising Period: ¥473,731.55 [1][3] - Total Fund Shares: 1,951,879,130.11 shares [1][3] - Number of Valid Subscription Accounts: 3,579 [3] Management Team - Fund Manager: Huang Hua, with previous experience at Ping An Asset Management and China Ping An Group [1]

公募REITs周报(第39期):指数止跌回暖,换手率上行-20251027
Guoxin Securities· 2025-10-27 02:22
1. Report Industry Investment Rating No relevant content provided in the given text. 2. Core Viewpoints of the Report - This week, the China Securities REITs Index stopped falling and rebounded, rising 0.2% for the week. The average weekly price changes of property - type REITs and franchise - type REITs were +0.1% and +0.7% respectively. In terms of the comparison of weekly price changes of major indices: CSI 300 > CSI Convertible Bond Index > China Securities REITs Index > China Bond Aggregate Index [1]. - Most sectors closed up, with water conservancy facilities, municipal facilities, and new infrastructure leading the gains. As of October 24, 2025, the dividend yield of property - type REITs was 83 basis points higher than the average dividend yield of CSI Dividend stocks, and the spread between the average internal rate of return of franchise - type REITs and the 10 - year Treasury yield was 210 basis points [1]. - E Fund Guangxi Beitou Expressway REIT was officially declared. This is the first publicly offered REIT product declared by a local enterprise in Guangxi, marking an important breakthrough in the in - depth linkage between local infrastructure and the capital market [1][4]. 3. Summary by Relevant Catalogs 3.1 Secondary Market Trends - As of October 24, 2025, the closing price of the China Securities REITs (closing) Index was 816.04 points, with a weekly price change of +0.2%. It performed worse than the CSI Convertible Bond Index (+1.5%) and the CSI 300 Index (+3.2%), but better than the China Bond Aggregate Index (0.0%). Year - to - date, the price change rankings of major indices were: CSI 300 (+18.4%) > CSI Convertible Bond Index (+16.1%) > China Securities REITs Index (+3.4%) > China Bond Aggregate Index (+0.4%) [2][6]. - In the past year, the return rate of the China Securities REITs Index was 5.2%, with a volatility of 7.3%. The return rate was lower than that of the CSI 300 Index and the CSI Convertible Bond Index, but higher than that of the China Bond Aggregate Index; the volatility was lower than that of the CSI 300 Index and the CSI Convertible Bond Index, but higher than that of the China Bond Aggregate Index [2][11]. - The total market value of REITs rose to 218.8 billion yuan on October 24, an increase of 500 million yuan from the previous week. The average daily turnover rate for the week was 0.52%, up 0.13 percentage points from the previous week [2][11]. - Most sectors closed up, with water conservancy facilities, municipal facilities, and new infrastructure leading the gains. The top three REITs in terms of weekly price increases were ICBC Mengneng Clean Energy REIT (+4.06%), AVIC Yishang Warehouse Logistics REIT (+3.58%), and Zheshang Hu杭Yong REIT (+3.23%) [3][16][20]. - Water conservancy facilities REITs had the highest trading activity. The average daily turnover rate of water conservancy facilities REITs was 1.0%, and transportation infrastructure REITs had the highest trading volume share this week, accounting for 18.9% of the total REIT trading volume [3][23]. - In terms of the capital flow of different REIT products this week, the top three in terms of net inflow of main funds were CICC InTime Consumption REIT (10.04 million yuan), China Merchants Fund Shekou Rental Housing REIT (7.32 million yuan), and YinHua Shaoxing Raw Water Water Conservancy REIT (4.34 million yuan) [3][24]. 3.2 Primary Market Issuance - From the beginning of the year to October 24, 2025, there were 2 REIT products in the "accepted" stage, 1 in the "declared" stage, 1 in the "inquired" stage, 5 in the "feedback" stage, 7 in the "passed and awaiting listing" stage, and 12 first - issued products that had passed and were listed on the exchange [26]. - E Fund Guangxi Beitou Expressway Closed - end Infrastructure Securities Investment Fund was officially declared. The initiator of the project was Guangxi Beibu Gulf Investment Group Co., Ltd., and the manager was E Fund Management Co., Ltd. This was the first publicly offered REIT product declared by a local enterprise in Guangxi [4][33]. 3.3 Valuation Tracking - REITs have both bond and equity characteristics. As of October 17, the average annualized cash distribution rate of publicly offered REITs was 6.5%. From the perspective of equity characteristics, relative net value premium rate, IRR, and P/FFO were used to judge the valuation of REITs [28]. - As of October 24, 2025, the dividend yield of property - type REITs was 83 basis points higher than the average dividend yield of CSI Dividend stocks, and the spread between the average internal rate of return of franchise - type REITs and the 10 - year Treasury yield was 210 basis points [31].
QDII基金9月表现:平均回报5.92% 易方达、华夏、创金合信基金产品业绩领跑
Sou Hu Cai Jing· 2025-10-27 01:48
Group 1 - The average return rate of over 300 existing QDII funds in the public market for September 2025 is 5.92% [1][2] - The top-performing QDII funds in September include E Fund CSI Overseas Internet ETF with a return of 18.78%, and other funds related to internet technology [4][5] - The actively managed equity fund, Chuangjin Hexin Global Chip Industry A, achieved a return of 15.01%, with a year-to-date net value increase of 38.74% [5] Group 2 - Over 20 QDII funds reported negative returns in September, with Tianhong Vietnam Market A showing a decline of 3.81% [7] - The underperforming funds primarily include index funds such as Tianhong and GF Hang Seng Consumer ETFs [9]

景顺长城基金管理有限公司关于旗下部分基金非港股通交易日暂停申购、赎回等业务安排的提示性公告
Zhong Guo Zheng Quan Bao - Zhong Zheng Wang· 2025-10-27 01:45
Group 1 - The company announced the suspension of subscription, redemption, conversion, and regular investment for certain funds starting from October 29, 2025, due to it being a non-Hong Kong Stock Connect trading day, with operations resuming on October 30, 2025 [1][2] - The announcement specifies that the affected funds are those participating in the Hong Kong Stock Connect, and any new funds added later will also follow the same suspension rules [1][2] - Investors are advised to check the company's website or contact customer service for further details regarding the fund operations [2] Group 2 - The company issued a notice regarding the significant premium of the market trading price over the reference net asset value for the Invesco Nasdaq Technology ETF, leading to a temporary suspension of trading from October 27, 2025, until 10:30 AM [3] - The fund management emphasizes that the trading price can be influenced by market supply and demand, systemic risks, and liquidity risks, which may lead to potential losses for investors [3][4] - The fund management assures that the fund is operating normally and will comply with legal regulations and disclosure obligations [4] Group 3 - The company has entered into a sales agreement with GF Securities to expand the distribution of its funds, effective from October 27, 2025 [6] - The announcement includes details about the sales institution, including its address, contact information, and the nature of the services provided [6][7] - Investors are encouraged to consult the company or GF Securities for more information regarding fund operations and any applicable fee discounts [7][8]
华宝中证港股通信息技术综合ETF今日起发售
Zheng Quan Shi Bao Wang· 2025-10-27 01:41
Group 1 - The Huabao CSI Hong Kong Stock Connect Information Technology Comprehensive ETF (159131) will be launched from October 27 to October 31, 2025, with a fundraising cap of 2 billion yuan [1] - The fund will be managed by Huabao Fund, with Zhang Fang and Cao Xuchen as the fund managers [1] - The performance benchmark for the fund is the return of the CSI Hong Kong Stock Connect Information Technology Comprehensive Index, adjusted for the RMB exchange rate [1]
安联基金沈良:立高远之志 行务实之事
Zhong Guo Zheng Quan Bao· 2025-10-27 01:01
Core Viewpoint - Allianz Fund aims to integrate international vision with local practices in China's asset management industry, focusing on long-term stable investment experiences and customized solutions for investors [1][7]. Group 1: Company Vision and Strategy - Allianz Fund inherits the rigorous cultural style of the Allianz Group, leveraging strong data advantages and extensive market investment experience to serve Chinese investors [1][6]. - The company emphasizes the importance of asset allocation and customized services in the "Wealth Management 2.0" era, aiming to provide comprehensive solutions for diverse investor needs [1][8]. - Allianz Fund's investment philosophy is rooted in a proactive asset management approach, focusing on quality, technology, and excellence [1][11]. Group 2: Leadership and Team - Shen Liang, the chairman and general manager of Allianz Fund, has over 23 years of experience in the financial sector, having held various leadership roles in prominent financial institutions [3][5]. - The investment research team at Allianz Fund comprises a significant portion of its workforce, reflecting the company's commitment to building strong research capabilities [11][12]. Group 3: Market Position and Product Offerings - Allianz Fund is set to officially launch in 2024, becoming the ninth wholly foreign-owned public fund company in China, indicating a strategic entry into the growing Chinese asset management market [5][6]. - The company has already initiated its product lineup, including the Allianz China Select Mixed Fund, which was launched in a challenging market environment, showcasing its confidence in the Chinese asset market [12][13]. - Allianz Fund plans to expand its product offerings to include fixed-income products and potentially cross-border investment products, catering to diverse investor preferences [13][14]. Group 4: Market Insights and Opportunities - Shen Liang believes that the Chinese stock market still has significant value re-evaluation potential, with long-term investment opportunities remaining attractive [16][17]. - The company highlights the importance of China's technological advancements and the ongoing transformation of its economic structure, which are expected to enhance market confidence and attract global investment [17][18]. - Allianz Fund emphasizes that high-quality alpha opportunities in the Chinese market are expected to continue emerging, driven by sustainable development and innovation [18].

安联基金沈良: 立高远之志 行务实之事
Zhong Guo Zheng Quan Bao· 2025-10-26 22:55
Core Insights - Allianz Fund aims to integrate international vision with local practices in China's asset management market, emphasizing a long-term, stable investment experience for investors [1][3] - The company is positioned to leverage its strong data advantages, extensive market investment experience, and deep risk management culture to meet the evolving needs of Chinese investors in the "Wealth Management 2.0" era [1][3][4] Group 1: Company Vision and Strategy - Allianz Fund is committed to providing customized asset allocation solutions and one-stop services, reflecting its ambition in the "Wealth Management 2.0" era [2][4] - The firm emphasizes a pragmatic approach, focusing on professional research, product development, and service quality to build trust with investors [1][5] Group 2: Team and Research Capabilities - The investment research team at Allianz Fund comprises a significant portion of its workforce, indicating a strong focus on research-driven asset management [5][6] - The team utilizes grassroots research methods to gain insights into market opportunities, enhancing its competitive edge in the foreign asset management sector [6][5] Group 3: Product Development and Market Positioning - Allianz Fund launched its first product, the Allianz China Select Mixed Fund, in a challenging market environment, demonstrating confidence in the Chinese asset market [7][8] - The company plans to expand its product offerings, including fixed-income products and potentially cross-border investment products, to cater to diverse investor needs [8][7] Group 4: Market Outlook and Investment Opportunities - Allianz Fund identifies significant value re-evaluation potential in the Chinese stock market, supported by structural economic transformations and advancements in technology [10][11] - The firm highlights the importance of high-quality alpha opportunities in China, emphasizing the need to focus on sustainable development and long-term investment quality [12][11]
银华基金李晓星旗下银华心怡A三季报最新持仓,重仓中国移动
Sou Hu Cai Jing· 2025-10-26 21:39
Group 1 - The core viewpoint of the news is the performance and changes in the top holdings of the Yinhua Xinyi Flexible Allocation Mixed Fund, which reported a net value growth rate of 23.93% over the past year [1] - The fund has added new top holdings including HSBC Holdings, Standard Chartered Group, Bank of China Hong Kong, Luzhou Laojiao, ZTO Express, Wuliangye, and Shenzhou International [1] - China Mobile remains the largest holding with an increase of 22.35 million shares, while other previous top holdings such as SMIC, Xiaomi Group, CATL, Tencent Holdings, and others have exited the top ten holdings [1] Group 2 - The fund's top ten holdings now include significant investments in HSBC Holdings with 2.68 billion yuan, Standard Chartered Group with 2.48 billion yuan, and Bank of China Hong Kong with 2.47 billion yuan [1] - The fund has increased its stake in China Mobile by 6.04%, holding 3.03 billion yuan worth of shares, while it has reduced its position in Focus Media by 34.09% [1] - The overall changes in the fund's portfolio reflect a strategic shift towards financial and consumer sectors, indicating potential investment opportunities in these areas [1]