POLY PROPERTY(00119)
Search documents
保利置业10月合同销售金额43亿元
Bei Jing Shang Bao· 2025-11-06 13:16
Core Insights - Poly Real Estate reported a contract sales amount of approximately 4.3 billion yuan in October, indicating ongoing activity in the real estate market [1] - The total contract sales area reached about 148,000 square meters, reflecting the company's operational scale [1] - The average contract sales price was approximately 29,300 yuan per square meter, suggesting pricing trends in the current market [1] Summary by Categories Sales Performance - In October, the company achieved a contract sales amount of around 4.3 billion yuan [1] - The total contract sales area was approximately 148,000 square meters [1] Pricing Trends - The average contract sales price was reported at about 29,300 yuan per square meter [1]
百济神州前三季营收同比增超4成 信利国际年内综合营收达约140亿元
Xin Lang Cai Jing· 2025-11-06 13:11
Company News - BeiGene reported total revenue of approximately $3.845 billion for the first nine months, a year-on-year increase of 43%. Adjusted net profit was approximately $693 million, marking a return to profitability. In Q3, revenue reached $1.412 billion, up 41% year-on-year, with adjusted net profit of approximately $304 million, a 489% increase year-on-year. The growth is primarily attributed to the sales increase of BeiYueZe® in the US and Europe, with the US remaining the largest market for the company. The full-year revenue guidance is set at $5.1 billion to $5.3 billion, reflecting strong growth expectations from BeiYueZe® in the US and continued expansion in Europe and other key global markets [2] - Yidu International Holdings announced an earnings upgrade, expecting a profit attributable to shareholders of approximately HKD 1.2 billion for the first half, representing an increase year-on-year [3] - Hua Hong Semiconductor reported sales revenue of $635 million for Q3 2025, a year-on-year increase of 20.7%. However, net profit decreased by 42.6% to $25.725 million [4] - Autohome's net profit attributable to the parent company for Q3 was approximately RMB 436.6 million, with online marketing and other business revenues increasing by 32.1% year-on-year [5] - Xinyi International reported a cumulative net operating income of approximately HKD 13.981 billion for the first ten months, a year-on-year decrease of about 5.3%, with October revenue at HKD 1.457 billion [6] - Dongfeng Motor Group's cumulative vehicle sales for the first ten months reached 1.501 million units, a year-on-year decline of approximately 1.6%. However, sales of new energy vehicles increased by approximately 37.1% to 421,400 units [7] - China Overseas Land & Investment reported a cumulative contracted property sales amount of approximately RMB 189.165 billion for the first ten months, a year-on-year decrease of 21.3% [8] - Poly Property Group reported a cumulative contracted sales amount of RMB 43.8 billion for the first ten months, a year-on-year decrease of 10.43% [9] - Gemdale reported a cumulative contracted sales amount of approximately RMB 9.125 billion for the first ten months, a year-on-year decrease of 43.93% [10] - Sunac China reported a cumulative contract sales amount of approximately RMB 32.77 billion for the first ten months, a year-on-year decline of 25.1% [11] - Guoyin Financial Leasing plans to purchase 1,198 units of domestic information technology computing equipment for a total consideration of RMB 1.04 billion [12] - Youjia Innovation recently received project designation notifications from a globally renowned automotive group's joint venture and luxury brand, with a total order amount of approximately RMB 320 million [13] - Swire Properties reported a rental rate of 96% for Taikoo Place in Q3, with a rental reduction of 13%. Other Swire properties had an occupancy rate of 90%, with a rental reduction of 15% [14] - Zhongshen Construction Industry plans to acquire 100% equity of Huajian Development Co., Ltd. for approximately HKD 213.6 million [15] - Hard Egg Innovation signed a memorandum of understanding with Huixin Investment to jointly develop an AIoT innovation enterprise incubation platform [16] - Damai Entertainment expects mid-term net profit to increase to no less than RMB 500 million, compared to RMB 337 million last year [17] - Cafe de Coral Group issued a profit warning, expecting mid-term profit attributable to shareholders to decline by 65% to 70% [18] - Qingci Games signed a game licensing transfer agreement with Disney, obtaining authorization to develop and publish the game "Disney: Book of Legends," expected to launch in 2026 across various regions [19] - Now Medical Technology's subsidiary signed a strategic cooperation framework agreement with Medtronic Changzhou to promote clinical applications of real-time navigation tracking endoscopic technology in China [19] - Zhaoke Ophthalmology-B signed a distribution agreement with PT FERRON for the commercialization of BRIMOCHOL PF in Indonesia, receiving an upfront payment and potential milestone payments [19] - Shoujia Technology signed a strategic framework cooperation agreement with Stardust Intelligence, covering the development of humanoid robot tendon and related fields [20] Buyback Dynamics - Helen's decided to exercise its share buyback authorization, planning to repurchase up to 127 million shares [21] - China Feihe repurchased 6.806 million shares for a total of approximately HKD 29.4298 million, with a buyback price of HKD 4.29 to HKD 4.35 [22] - Kintor Pharmaceutical repurchased 1.734 million shares for a total of approximately HKD 26.3078 million, with a buyback price of HKD 14.35 to HKD 15.8 [23] - COSCO Shipping Holdings repurchased 1.53 million shares for a total of approximately HKD 20.9869 million, with a buyback price of HKD 13.57 to HKD 13.84 [24] - Sinopec repurchased 2.398 million H-shares for a total of approximately HKD 10.1066 million, with a buyback price of HKD 4.20 to HKD 4.23 [25]


保利置业集团:前10个月合同销售金额约438亿元
Xin Lang Cai Jing· 2025-11-06 10:20
Core Viewpoint - Poly Real Estate Group reported its unaudited sales data for October 2025, indicating a significant performance in contract sales [1] Group 1: October 2025 Sales Performance - In October 2025, Poly Real Estate achieved a contract sales amount of approximately 4.3 billion yuan [1] - The total contract sales area for October 2025 was about 148,000 square meters [1] - The average contract sales price for October 2025 was approximately 29,269 yuan per square meter [1] Group 2: Cumulative Sales Data - As of October 2025, the cumulative contract sales amount reached approximately 43.8 billion yuan [1] - The cumulative contract sales area totaled around 1.443 million square meters [1] - The average contract sales price on a cumulative basis was approximately 30,348 yuan per square meter [1]
保利置业集团:前10月合同销售约438亿元 同比降10.43%
Xin Lang Cai Jing· 2025-11-06 09:14
Core Viewpoint - Poly Real Estate Group reported a total contract sales amount of approximately RMB 43.8 billion for the first ten months of 2025, representing a year-on-year decline of 10.43% [1] Summary by Category Sales Performance - The cumulative contract sales area reached approximately 1.443 million square meters [1] - The average contract sales price was approximately RMB 30,348 per square meter [1]
保利置业集团:10月合同销售金额约43亿元
Xin Lang Cai Jing· 2025-11-06 08:58
保利置业集团公告,10月,置业集团实现合同销售金额约人民币43亿元,合同销售面积约14.8万平方 米,合同销售均价约人民币29,269元/平方米。截至2025年10月,置业集团累计实现合同销售金额约人 民币438亿元。累计合同销售面积约144.3万平方米,合同销售均价约人民币30,348元/平方米。 ...
保利置业集团前10个月累计合同销售金额约438亿元 同比减少10.43%
Zhi Tong Cai Jing· 2025-11-06 08:46
保利置业集团(00119)发布公告,2025年10月,置业集团实现合同销售金额约人民币43亿元,同比减少 50%,合同销售面积约14.8万平方米,合同销售均价约人民币29269元/平方米。 截至2025年10月,置业集团累计实现合同销售金额约人民币438亿元,同比减少10.43%。累计合同销售 面积约144.3万平方米,合同销售均价约人民币30348元/平方米。 ...
保利置业集团(00119)前10个月累计合同销售金额约438亿元 同比减少10.43%
智通财经网· 2025-11-06 08:46
智通财经APP讯,保利置业集团(00119)发布公告,2025年10月,置业集团实现合同销售金额约人民币43 亿元,同比减少50%,合同销售面积约14.8万平方米,合同销售均价约人民币29269元/平方米。 截至2025年10月,置业集团累计实现合同销售金额约人民币438亿元,同比减少10.43%。累计合同销售 面积约144.3万平方米,合同销售均价约人民币30348元/平方米。 ...
保利置业集团(00119) - 二零二五年十月未经审核销售数据
2025-11-06 08:35
香港交易及結算所有限公司及香港聯合交易所有限公司對本公告的內容概不負責,對其準確性 或完整性亦不發表任何聲明,並明確表示,概不對因本公告全部或任何部分內容而產生或因依 賴該等內容而引致的任何損失承擔任何責任。 2025年10月,置業集團實現合同銷售金額約人民幣43億元,合同銷售面積約14.8萬平方 米,合同銷售均價約人民幣29,269元/平方米。 截至2025年10月,置業集團累計實現合同銷售金額約人民幣438億元。累計合同銷售面 積約144.3萬平方米,合同銷售均價約人民幣30,348元/平方米。 上述銷售數據未經審核,乃根據本集團內部管理紀錄編製。鑒於收集該等銷售數據過程 中存在各種不確定因素,該等數據與本公司按年度或半年度刊發的經審核或未經審核綜 合財務報表中披露的數字可能存在差異,因此上述數據僅供投資者參考。投資者於買賣 本公司證券時,務請審慎行事,避免不恰當地依賴該等資料。如有任何疑問,投資者應 尋求專業人士或財務顧問的專業意見。 Poly Property Group Co., Limited 保 利 置 業 集 團 有 限 公 司 (於香港註冊成立之有限公司) (股份代號:00119) 二零二五 ...
保利置业集团(00119) - 截至二零二五年十月三十一日股份发行人的证券变动月报表
2025-11-03 09:09
股份發行人及根據《上市規則》第十九B章上市的香港預託證券發行人的證券變動月報表 | 截至月份: | 2025年10月31日 | 狀態: 新提交 | | --- | --- | --- | | 致:香港交易及結算所有限公司 | | | | 公司名稱: | 保利置業集團有限公司 | | | 呈交日期: | 2025年11月3日 | | | I. 法定/註冊股本變動 不適用 | | | FF301 第 1 頁 共 10 頁 v 1.1.1 FF301 II. 已發行股份及/或庫存股份變動 | 1. 股份分類 | 普通股 | 股份類別 | 不適用 | | 於香港聯交所上市 (註1) | 是 | | | --- | --- | --- | --- | --- | --- | --- | --- | | 證券代號 (如上市) | 00119 | 說明 | | | | | | | | | 已發行股份(不包括庫存股份)數目 | | 庫存股份數目 | | 已發行股份總數 | | | 上月底結存 | | | 3,821,183,118 | | 0 | | 3,821,183,118 | | 增加 / 減少 (-) | | | | ...
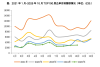
房企“银十”成绩单:48家企业销售额环比上涨
Di Yi Cai Jing· 2025-10-31 14:27
Core Insights - The total sales of the top 100 real estate companies in China for the first ten months of 2025 reached 289.67 billion yuan, representing a year-on-year decline of 16.3%, with the decline rate widening by 4.1 percentage points compared to the first nine months of the year [1] - The sales performance in October showed a slight month-on-month recovery, with a total sales amount of 253 billion yuan, reflecting a 0.1% increase from the previous month [6] Group 1: Sales Performance by Company Tier - The average sales for the top 10 real estate companies was 143.09 billion yuan, down 15.0% year-on-year [4] - The average sales for companies ranked 11 to 30 was 35.51 billion yuan, down 17.8% year-on-year [4] - The average sales for companies ranked 31 to 50 was 17.21 billion yuan, down 16.6% year-on-year [4] Group 2: Company Breakdown - There are 7 companies in the 100 billion yuan and above tier, with sales figures of 222.7 billion yuan, 201.1 billion yuan, 189.1 billion yuan, 169.6 billion yuan, 156.0 billion yuan, 114.6 billion yuan, and 106.5 billion yuan respectively [4] - The second tier (500-1000 billion yuan) has 7 companies, down 2 from the previous year, with sales figures of 92.6 billion yuan, 92.1 billion yuan, 86.3 billion yuan, 68.7 billion yuan, 62.1 billion yuan, 55.7 billion yuan, and 55.3 billion yuan respectively [4] - The third tier (300-500 billion yuan) has 6 companies, down 3 from the previous year, with sales figures of 43.8 billion yuan, 43.5 billion yuan, 41.5 billion yuan, 33.9 billion yuan, and 32.7 billion yuan respectively [4] Group 3: Market Trends - In October, first-tier cities recorded a total transaction volume of 1.68 million square meters, remaining flat month-on-month but down 41% year-on-year [6] - The total transaction volume in 26 second and third-tier cities was 7.91 million square meters, with a slight month-on-month increase of 1% but a year-on-year decline of 35% [6] - The city of Chengdu led in monthly transactions with 800,000 square meters, followed by Qingdao, Wuhan, and Xi'an [6] Group 4: Policy Implications - The recent "14th Five-Year Plan" emphasizes boosting consumption and may lead to the relaxation of housing purchase restrictions in major cities [7] - The industry anticipates that as year-end performance targets approach, supply in key cities may improve, providing some support to the market [7] - A more comprehensive approach from the central government is needed to stabilize the industry and break the negative cycle [7]