SHENGYI ELECTRONICS CO.(688183)
Search documents
半日主力资金丨加仓电子板块 抛售公用事业板块


Di Yi Cai Jing· 2025-10-24 03:57
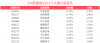
Group 1 - Main capital inflow observed in sectors such as electronics, electrical equipment, and defense industry, while public utilities, food and beverage, and real estate sectors experienced capital outflow [1] - Specific stocks with significant net inflow include Yangguang Electric (¥1.516 billion), Shengyi Technology (¥1.401 billion), and Zhongji Xuchuang (¥1.391 billion) [1] - Stocks facing notable net outflow include Shihua Machinery (¥0.536 billion), Huanghe Xuanfeng (¥0.438 billion), and Antai Technology (¥0.403 billion) [1]
重磅会议提及“科技自立自强”,500质量成长ETF(560500)盘中涨0.6%
Sou Hu Cai Jing· 2025-10-24 02:48
Core Viewpoint - The news highlights the performance of the CSI 500 Quality Growth Index and its ETF, emphasizing the importance of technological self-reliance and innovation in the context of China's economic strategy and the ongoing global technological competition [1][2]. Group 1: Index Performance - As of October 24, 2025, the CSI 500 Quality Growth Index rose by 0.51%, with notable increases in constituent stocks such as Shengyi Electronics (19.99%) and Deep Technology (6.33%) [1]. - The CSI 500 Quality Growth ETF experienced a 0.60% increase, with a significant growth in scale of 10.88 million yuan over the past month and an increase of 20 million shares [1]. Group 2: Strategic Context - The emphasis on accelerating high-level technological self-reliance is seen as a response to the ongoing global technological competition and the need for China to enhance its innovation capabilities [2]. - The development of a domestic computing power system is identified as a crucial measure for China to address technological blockades and ensure industrial security, particularly in the semiconductor industry [2]. Group 3: Index Composition - As of September 30, 2025, the top ten weighted stocks in the CSI 500 Quality Growth Index accounted for 22.61% of the index, with companies like Huagong Technology and Kaiying Network among the leaders [3]. - The index is designed to provide diverse investment options by selecting 100 companies with strong profitability, sustainable earnings, and robust cash flow from the broader CSI 500 Index [2].

生益电子盘中涨停 513只科创板股上涨
Zheng Quan Shi Bao Wang· 2025-10-24 02:19
(原标题:生益电子盘中涨停 513只科创板股上涨) 融资融券数据显示,该股最新(10月23日)两融余额为9.76亿元,其中,融资余额为9.71亿元,较上一 个交易日增加1838.76万元,增幅为1.93%;融券余额为494.43万元,较上一个交易日减少526.91万元, 降幅为51.59%。近10日两融余额合计增加558.29万元,增幅为0.58%,其间融资余额增长0.92%,融券余 额下降39.84%。 10月24日公司公布了前三季业绩预告,预计实现净利润107400.00万元至115370.00万元,变动区间为 476.00%~519.00%。 从机构评级来看,近一个月该股获1家机构买入评级。9月28日华鑫证券发布的研报给予公司买入评级。 (数据宝)注:本文系新闻报道,不构成投资建议,股市有风险,投资需谨慎。 10月24日盘中科创板股生益电子涨停,截至09:37,股价报88.94元,成交13.97亿元,换手率1.89%,振 幅1.61%。 科创板个股中,截至发稿上涨的共有513只,涨幅在5%以上的共有16只,涨幅较高的有生益电子、航天 环宇、皖仪科技等,分别上涨19.99%、17.80%、9.50%,下跌 ...
AIPC板块上涨 生益电子上涨19.99%
Mei Ri Jing Ji Xin Wen· 2025-10-24 01:51
Group 1 - The AIPC sector led the market with a rise of 2.73% [1] - Shengyi Electronics experienced a significant increase of 19.99% [1] - Demingli and Jiangbolong also saw gains of 6.24% and 4.78% respectively [1] Group 2 - Bawei Storage, Jucheng Co., and Spring Autumn Electronics all rose by over 3% [1]
早新闻|“十五五”主要目标来了
Zheng Quan Shi Bao· 2025-10-24 00:06
Macro Highlights - The main goals for the "14th Five-Year Plan" period include significant achievements in high-quality development, substantial improvement in technological self-reliance, breakthroughs in comprehensive reforms, enhanced social civilization, improved quality of life, major progress in building a beautiful China, and a more solid national security barrier [1] - By 2035, the aim is to significantly elevate China's economic, technological, defense, and comprehensive national strength, with per capita GDP reaching the level of moderately developed countries, leading to a happier and better life for the people and basic realization of socialist modernization [1] Trade Relations - The Ministry of Commerce announced that a Chinese delegation led by Vice Premier He Lifeng will engage in economic and trade consultations with the U.S. in Malaysia from October 24 to 27, focusing on important issues in Sino-U.S. economic relations [1] EU Sanctions Response - The Ministry of Commerce expressed strong dissatisfaction and firm opposition to the EU's decision to sanction Chinese companies, including large oil refineries and traders, during the 19th round of sanctions against Russia, emphasizing the need to protect the legitimate rights and interests of Chinese enterprises [2] State-Owned Enterprises Planning - The State-owned Assets Supervision and Administration Commission held a meeting to discuss the "14th Five-Year Plan" for central enterprises, emphasizing the need to align with the strategic mission assigned by the Party Central Committee and to enhance core functions and competitiveness [3] - The meeting highlighted the importance of optimizing layout and structural adjustments in line with national needs and industry trends, and improving the quality of planning through thorough research and unified thinking [3] Foreign Exchange Management - The Deputy Director of the State Administration of Foreign Exchange encouraged the implementation of innovative and integrated exploratory policies in Shanghai, focusing on the use of AI and big data to enhance foreign exchange services [4] - The aim is to improve the cross-border financial service capabilities of Shanghai while balancing financial openness and security [4] Company News - Huagong Technology reported a 40.92% year-on-year increase in net profit for the first three quarters and is planning to issue H-shares for listing in Hong Kong [8] - Yangjie Technology terminated its acquisition of 100% equity in Better Electronics [8] - Xinda Securities received approval for the issuance of up to 10 billion yuan in technology innovation corporate bonds [8] - Shuangliang Energy plans to raise no more than 1.292 billion yuan for projects related to zero-carbon intelligent manufacturing [8] - New Lai Materials' subsidiary plans to invest 2 billion yuan in semiconductor core component projects [8] - Chuanfa Longmang's subsidiary intends to invest 366 million yuan in a 100,000 tons/year lithium dihydrogen phosphate project [8] - Steel Research High-tech plans to establish a subsidiary and new industrial base in Saudi Arabia [8] - Aote Electronics intends to terminate the smart integration project for intelligent outlets [8] - Shengyi Electronics expects a year-on-year net profit increase of 476% to 519% for the first three quarters [8] - Other companies reported significant year-on-year net profit growth, including Tianeng Heavy Industry (1359.03%), Te Yi Pharmaceutical (985.18%), and Zhuanlei Technology (598.09%) [8][9]
重磅发布会,今天上午举行;宇树科技完成更名,王兴兴任董事长……盘前重要消息一览
证券时报· 2025-10-23 23:37
New Stock Subscription - Daming Electronics has a subscription code of 732376, with an issue price of 12.55 yuan per share and a subscription limit of 0.95 million shares [1] Important News - The main goals for the "14th Five-Year Plan" period include significant achievements in high-quality development, substantial improvements in technological self-reliance, and enhanced social civilization levels. By 2035, the aim is to elevate China's economic, technological, and comprehensive national strength significantly, achieving a per capita GDP at the level of moderately developed countries [4] - A press conference will be held on October 24 to introduce and interpret the spirit of the 20th Central Committee's Fourth Plenary Session, with live broadcasts from major media outlets [4] - The Ministry of Commerce announced that Vice Premier He Lifeng will lead a delegation to Malaysia for new rounds of Sino-U.S. economic and trade consultations from October 24 to 27 [4] - The Ministry of Commerce expressed strong dissatisfaction and firm opposition to the EU's recent sanctions against Chinese companies, including major oil refineries, stating that such actions undermine China-EU economic cooperation and global energy security [5] - The National People's Congress will continue reviewing the cybersecurity law amendment draft, which aims to enhance the safety and development of artificial intelligence [6] Company News - Anshi China stated that decisions made by its Dutch headquarters are not legally effective in China, and Zhang Qiuming's position remains unchanged [9] - Yushutech has completed its name change, with Wang Xingxing appointed as chairman [10] - Huagong Technology is planning to issue H-shares and list on the Hong Kong Stock Exchange [11] - Jinggong Steel Structure signed a significant overseas project worth approximately 1.23 billion yuan [12] - Tengda Construction won a major engineering project worth 469 million yuan [13] - Xinlai Materials' subsidiary plans to invest 2 billion yuan in a semiconductor core component project [14] - Shuangliang Energy plans to raise no more than 1.292 billion yuan through a private placement for projects including a zero-carbon intelligent manufacturing factory [15] - Youfa Group reported a 2320.53% year-on-year increase in net profit for the third quarter [16] - Beifang Navigation reported a 1681.27% year-on-year increase in net profit for the third quarter [17] - Shengyi Electronics expects a year-on-year net profit increase of 476% to 519% for the first three quarters [18] - Colin Electric reported a 705.48% year-on-year increase in net profit for the third quarter [19] - Tianneng Heavy Industry reported a 1359.03% year-on-year increase in net profit for the first three quarters [20] - Hualv Biological reported a 619.37% year-on-year increase in net profit for the third quarter [21] - Te Yi Pharmaceutical reported a 985.18% year-on-year increase in net profit for the first three quarters [22] - Zhuoyi Information reported a 2074.65% year-on-year increase in net profit for the third quarter [23] Broker Insights - Guotai Junan highlighted the explosive growth of the electric heavy truck market in China, driven by trade-in policies, which is expected to create significant opportunities for the lithium battery industry [25] - Zhongyuan Securities noted the ongoing trend of domestic production in the IT industry, emphasizing the importance of developments in key software areas like Hongmeng and EDA amidst increasing international challenges [26]

生益电子股份有限公司2025年前三季度业绩预告的自愿性披露公告
Shang Hai Zheng Quan Bao· 2025-10-23 18:14
Performance Forecast - The company expects to achieve operating revenue between 661,380 thousand yuan and 703,380 thousand yuan for the first three quarters of 2025, representing an increase of 343,446 thousand yuan to 385,446 thousand yuan compared to the same period last year, which is a year-on-year increase of 108% to 121% [3] - The net profit attributable to the parent company is projected to be between 107,400 thousand yuan and 115,370 thousand yuan, an increase of 88,748 thousand yuan to 96,718 thousand yuan compared to the same period last year, reflecting a year-on-year increase of 476% to 519% [3] - The net profit attributable to the parent company after deducting non-recurring gains and losses is expected to be between 107,140 thousand yuan and 115,090 thousand yuan, which is an increase of 89,382 thousand yuan to 97,332 thousand yuan compared to the same period last year, indicating a year-on-year increase of 503% to 548% [3] Previous Year Performance - In the first three quarters of 2024, the company reported operating revenue of 317,934 thousand yuan [5] - The total profit for the same period was 19,007 thousand yuan, with a net profit attributable to the parent company of 18,652 thousand yuan [5] - The net profit attributable to the parent company after deducting non-recurring gains and losses was 17,758 thousand yuan, with earnings per share of 0.23 yuan [6] Reasons for Performance Change - The company has focused on enhancing its market, technology, and quality management capabilities, leading to an increase in the proportion of high value-added products, which has strengthened its competitive advantage in the mid-to-high-end market, resulting in significant growth in both operating revenue and net profit compared to the previous year [7]
上市公司动态 | 华夏银行前三季度净利润降2.86%;华工科技筹划港交所上市,前三季度净利同比增40.92%
Sou Hu Cai Jing· 2025-10-23 15:16
Group 1: 华夏银行 Financial Performance - In Q3 2025, 华夏银行 reported operating revenue of 19.36 billion yuan, a year-on-year decrease of 15.02% [1][2] - The net profit attributable to shareholders was 6.51 billion yuan, an increase of 7.62% year-on-year [1][2] - For the first three quarters, the bank's operating revenue was 64.88 billion yuan, down 8.79% year-on-year, while net profit decreased by 2.86% to 17.98 billion yuan [1][2] Group 2: 华夏银行 Key Financial Ratios - Basic earnings per share remained stable at 0.38 yuan for Q3 and 1.04 yuan for the first three quarters [2] - The weighted average return on equity was 1.98% in Q3, down 0.12 percentage points year-on-year [3] - The total assets at the end of the reporting period were 4.586 trillion yuan, an increase of 4.80% from the end of the previous year [2] Group 3: 不良贷款和拨备情况 - The non-performing loan ratio was 1.58%, a decrease of 0.02 percentage points from the end of the previous year [3] - The provision coverage ratio was 149.33%, down 12.56 percentage points year-on-year [3] - The loan provision ratio was 2.36%, a decrease of 0.23 percentage points from the end of the previous year [3] Group 4: 华工科技 Financial Performance - 华工科技 reported Q3 2025 operating revenue of 3.41 billion yuan, a decrease of 10.33% year-on-year, while net profit increased by 31.15% to 410 million yuan [4][5] - For the first three quarters, the company achieved operating revenue of 11.04 billion yuan, a year-on-year increase of 22.62%, and net profit of 1.32 billion yuan, up 40.92% [4][5] Group 5: 汇川技术 Financial Performance - 汇川技术 reported operating revenue of 316.63 billion yuan for the first three quarters, a year-on-year increase of 24.67%, with net profit rising by 26.84% to 42.54 billion yuan [6][7] - In Q3, the company achieved operating revenue of 111.53 billion yuan, up 21.05% year-on-year, and net profit of 12.86 billion yuan, an increase of 4.04% [6][7] Group 6: 宝丰能源 Financial Performance - 宝丰能源 reported operating revenue of 355.45 billion yuan for the first three quarters, a year-on-year increase of 46.43%, with net profit rising by 97.27% to 89.5 billion yuan [8][9] - In Q3, the company achieved operating revenue of 127.25 billion yuan, up 72.49% year-on-year, and net profit of 32.32 billion yuan, an increase of 162.34% [8][9] Group 7: 生益科技 Performance Forecast - 生益科技 expects net profit for the first three quarters of 2025 to be between 2.42 billion and 2.46 billion yuan, representing a year-on-year increase of 76% to 79% [10] - The increase is attributed to higher sales of copper-clad laminates and improved product structure [10] Group 8: 巨化股份 Financial Performance - 巨化股份 reported Q3 2025 operating revenue of 70.62 billion yuan, a year-on-year increase of 21.22%, with net profit rising by 186.55% to 11.97 billion yuan [11] - For the first three quarters, the company achieved operating revenue of 203.94 billion yuan, up 13.89%, and net profit of 32.48 billion yuan, an increase of 160.22% [11] Group 9: 电投能源 Financial Performance - 电投能源 reported Q3 operating revenue of 79.39 billion yuan, a year-on-year increase of 3.34%, while net profit decreased by 8.52% to 13.31 billion yuan [21][22] - For the first three quarters, the company achieved operating revenue of 224.03 billion yuan, up 2.72%, and net profit decreased by 6.40% to 41.18 billion yuan [21][22]

扬杰科技终止收购贝特电子100%股权;生益电子预计前三季度净利润同比增加476%~519% |公告精选


Mei Ri Jing Ji Xin Wen· 2025-10-23 14:47
Group 1: Acquisition Termination - Yangjie Technology announced the termination of the acquisition of 100% equity in Better Electronics, as the actual controller and major shareholder decided to withdraw from the transfer [1] Group 2: Shareholding Changes - Yunlu Co., Ltd. announced that shareholder and director Guo Keyun plans to reduce his stake by up to 3%, equivalent to no more than 3.6 million shares [2] - Guo Zhan Real Estate, a shareholder of Guo New Energy, intends to reduce its holdings by no more than 2.07%, which amounts to up to 40 million shares [3] - Li Aizhen, a significant shareholder of Power Diamond, plans to reduce his stake by up to 3%, which is approximately 763.35 thousand shares [4] - The National Integrated Circuit Industry Investment Fund plans to reduce its holdings in Hu Silicon Industry by no more than 2%, translating to up to 54.94 million shares [5] Group 3: Earnings Reports - Hemei Group reported a net profit of 61.75 million yuan for the third quarter, marking a year-on-year increase of 706.30%, with a revenue of 139 million yuan, up 53.35% [6] - Zhongtai Automobile reported a net loss of 223 million yuan for the first three quarters, with a revenue of 419 million yuan, reflecting a year-on-year growth of 8.98% [7] - Shengyi Electronics expects a net profit increase of 476% to 519% for the first three quarters, estimating a profit between 1.074 billion yuan and 1.154 billion yuan [8]
晚间公告丨10月23日这些公告有看头
第一财经· 2025-10-23 13:03
Major Events - Former Chairman of Beiyin Wealth Management, Fang Yi, has joined Huaxia Bank as Chief Risk Officer, pending regulatory approval [4] - Xilai Materials' subsidiary plans to invest 2 billion yuan in a semiconductor core component project, expected to generate over 1.5 billion yuan in annual output after reaching production [5][6] - Huatai Securities' subsidiary Huatai Futures has appointed Zhao Changtao as the new chairman [7] - Chuanfa Longmang's subsidiary plans to invest 366 million yuan in a 100,000 tons/year lithium dihydrogen phosphate project [8] - Huagong Technology is planning to issue H-shares and apply for listing on the Hong Kong Stock Exchange [9] - Jiangsu Leili's actual controller has changed from Su Jianguo to both Su Jianguo and Su Da due to internal share transfers [10] - Electric Power Investment Energy has been unable to contact independent director Han Fang, but this does not affect the board's operation [11] - Qiaqia Food's subsidiary is establishing an investment company focused on the leisure food industry with a total investment of 4 billion yuan [12][13] - Steel Research High-tech plans to set up a wholly-owned subsidiary in Saudi Arabia with an investment of up to 138 million yuan [14] - Yangjie Technology has terminated the acquisition of 100% equity in Better Electronics due to differences in business types and management [15] Performance Reports - Youfa Group reported a 2320.53% increase in net profit for Q3, despite a 3.97% decline in revenue [16] - Zhuoyi Information's net profit increased by 2074.65% in Q3, with revenue growth of 2.52% [17] - North Navigation's Q3 net profit surged by 1681.27%, with a 52.12% increase in revenue [18] - Tianneng Heavy Industry's net profit grew by 1359.03% in Q3, driven by increased sales of tower tubes [19] - Te Yi Pharmaceutical's net profit rose by 985.18% in Q3, with significant growth in traditional Chinese medicine sales [20] - Hualgreen Bio's Q3 net profit increased by 619.37%, with a 35.24% rise in revenue [21] - Zhenlei Technology's net profit grew by 598.09% in Q3, supported by strong revenue growth [22] - Shengyi Electronics expects a net profit increase of 476% to 519% for the first three quarters of 2025 [23] - Glodon reported a 244.89% increase in Q3 net profit, despite a slight decline in revenue [24] - Yingli Co., Ltd. saw a 229.14% increase in Q3 net profit, with a 14.73% rise in revenue [25] - Guangkang Biochemical's Q3 net profit increased by 236.87%, despite a decline in revenue [26] - High-speed Electric's Q3 net profit rose by 242.35%, with a 44.51% increase in revenue [27] - Wide Special Materials reported a 213.65% increase in net profit for Q3, driven by improved gross margins [28] - Baofeng Energy's Q3 net profit increased by 162.34%, attributed to increased production capacity [29] - Sanfu Co., Ltd. reported a 162.25% increase in Q3 net profit, driven by improved profitability of potassium and silane products [30] - Wuku New Energy's Q3 net profit increased by 106.31%, despite a loss in the first three quarters [32] - Pioneering Technology's Q3 net profit grew by 94.01%, supported by a recovery in the household energy storage market [33] - Sanlife Guojian's net profit increased by 71.15% in Q3, driven by project collaboration and CDMO business growth [34] - BGI Genomics reported a loss of 120 million yuan in the first three quarters, despite revenue growth [35] - Rejing Bio reported a net loss of 10.9 million yuan in the first three quarters, impacted by industry policies [36] - Jiangshan Oupai reported a net loss of 51.58 million yuan in Q3, attributed to market downturns and increased competition [38] - Taiping Bird reported a net loss of 49.45 million yuan in Q3, due to declining revenue and increased inventory losses [39] - Zhongke Tongda reported a loss of 6.87 million yuan in the first three quarters, affected by project delays and market competition [40] - Wolong New Energy reported a loss of 579.7 thousand yuan in Q3, transitioning from profit to loss [41] Major Contracts - Jinggong Steel Structure signed a significant overseas project contract worth approximately 1.23 billion yuan [42][43] - New Beiyang's subsidiary won a 105 million yuan postal equipment outsourcing project [44] - Maipu Medical plans to sign product sales agency agreements with related parties, with estimated procurement amounts of 21.5 million yuan and 3.5 million yuan [45] Shareholding Changes - Yunlu Co., Ltd. shareholder Guo Keyun plans to reduce his stake by up to 3% [46] Financing - Xinda Securities has received approval from the CSRC to issue up to 10 billion yuan in technology innovation corporate bonds [47]
