技术分析
Search documents
郑氏点银:黄金持续下跌,今日风水岭下移3972
Sou Hu Cai Jing· 2025-10-28 12:49
Core Viewpoint - The article discusses the recent downward trend in gold and silver prices, highlighting key support and resistance levels, and anticipates potential market movements following an upcoming interest rate decision. Gold Market Analysis - Gold prices experienced a significant drop, failing to maintain support at key levels of 4055 and 4090, leading to further declines towards 3945 and 3914 [1][3] - The article identifies three critical support levels for gold: 3870 (4-hour average), 3846 (50% retracement from a previous rally), and 3825 (weekly average) [1] - A bearish outlook is maintained unless gold can break above the resistance level of 3972, which is considered a pivotal point for short-term price action [3] Silver Market Analysis - Silver prices have shown relative strength compared to gold, with a recent correction to the weekly average of 45.6 and a potential bottom forming [5] - The article notes a significant bullish divergence in the MACD indicator for silver, suggesting a possible reversal if it can break above the resistance level of 46.6 [5] - If silver surpasses 46.6, it may trigger a short-term bullish signal, with targets set at 47.2 and 48 [5]


多頭排列VS賣出信號:中芯當前技術面解讀
Ge Long Hui· 2025-10-28 08:13
Core Viewpoint - Semiconductor Manufacturing International Corporation (SMIC) has shown strong stock performance recently, with a 3.5% increase on the latest trading day, reaching a price of 82.7 HKD, indicating a critical technical position for the stock [3]. Technical Analysis - The stock price has surpassed all major moving averages, with MA10 at 74.73 HKD, MA30 at 75.24 HKD, and MA60 at 65.05 HKD, forming a bullish arrangement [3]. - Multiple oscillators are signaling sell indications, particularly the MACD and Bollinger Bands, which suggest caution for investors [3]. - The RSI is at 57, indicating a neutral range, while the Williams %R shows overbought conditions, hinting at potential short-term pullback pressure [3]. Support and Resistance Levels - Key resistance is at 86.5 HKD; a breakthrough could lead to a target of 95.5 HKD. Support levels are at 72.6 HKD and 64.5 HKD [3]. - The stock has experienced a volatility of 12.3% over the past five days, suggesting significant price fluctuations may occur around these critical levels [3]. Derivative Products Performance - Recent performance of structured products has been notable, with the BNP Paribas call option (19088) surging 27% in two days, and the UBS bull certificate (63595) rising 63%, while the underlying stock only increased by 6.88% [3]. - Popular call options include those from Bank of China (21283) and UBS (17146), both with a strike price around 95.05 HKD, offering approximately 3.3 times leverage [5]. Bear and Bull Certificates - UBS bull certificate (63595) and HSBC bull certificate (61585) have a redemption price set at 68 HKD, providing nearly 6 times actual leverage, suitable for high-risk tolerance investors [7]. - For bearish investors, UBS bear certificate (63598) and Societe Generale bear certificate (62695) have a redemption price at 95 HKD, aligning with the second resistance level [7]. Market Sentiment - Despite the recent price increase, some investors are beginning to adopt a slightly bearish outlook, which aligns with the technical signals indicating a predominance of sell signals [10]. - The stock's resistance level at 86 HKD is crucial for determining whether the upward trend can continue or if a correction is imminent [11].

小米強力買入信號現!窩輪牛熊揀邊隻博反彈?
Ge Long Hui· 2025-10-27 11:56
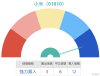
Core Viewpoint - Xiaomi has recently launched the Redmi K 90 series smartphones and announced a new subsidy for electric vehicle purchases, indicating a strategic push to enhance product offerings and customer incentives amidst a challenging stock performance [1][3]. Product Launch and Pricing Strategy - The Redmi K 90 series smartphones were released on October 23, with prices ranging from 2,599 to 5,499 yuan, accompanied by promotional discounts and extended warranty offers [1]. - The company is expected to invest over 2 billion yuan in subsidies for electric vehicle purchases, targeting customers who place orders by the end of November and face delays due to manufacturer issues [1]. Stock Performance Analysis - Xiaomi's stock price closed at 45.92 yuan on October 24, down 1.75%, continuing a period of consolidation after a decline from nearly 60 yuan [1]. - The short-term support level is around 44.5 yuan, with potential downside to 40 yuan if this level is breached, while resistance is identified at 49.7 yuan, with a breakthrough potentially leading to a challenge of the 56 yuan high [1]. Technical Analysis - Technical indicators show a divergence, with a strong buy signal at a strength of 12, while moving averages also indicate buy signals; however, MACD and Bollinger Bands maintain sell signals, reflecting ongoing market volatility [3]. - The 5-day volatility is at 5.3%, indicating a tug-of-war between bullish and bearish sentiments [3]. Derivative Products - For bullish investors, HSBC call options (product code 16370) and UBS call options (product code 13630) are recommended, with leverage ratios of 3.4 and 3.1 respectively, offering controlled costs and low premiums [5][6]. - For bearish strategies, Bank of China put options (product code 14387) and Societe Generale put options (product code 14178) are highlighted, with leverage ratios of 3 and 3.3 respectively, suitable for those anticipating a price correction [5][6]. Market Sentiment and Discussion - The article invites readers to discuss whether the new product launches and tax subsidies can help Xiaomi's stock price break through the 49.7 yuan resistance, and whether to opt for high-leverage products or more stable options [7].

Gold vs Ethereum: Which Hits $5K First? Here’s What the Charts Say
Yahoo Finance· 2025-10-24 20:30
The race is on, and $5,000 is the finish line. But which asset gets there first—gold or Ethereum? On Myriad, the prediction market built by Decrypt's parent company Dastan, traders have placed their bets: 65.5% of the money is on ETH reaching $5,000 before gold does. It's a bold call considering gold, trading for $4,115 today, is closer to the target, despite registering its biggest one-day correction in over a decade. But the technical analysis reveals why crypto traders might be onto something—and why ...
郑氏点银:今晚CPI数据会带来不小的振幅,留意4044得失
Sou Hu Cai Jing· 2025-10-24 16:40
Core Viewpoint - The article discusses the volatility expected from the upcoming CPI data, emphasizing the importance of the 4044 level for market movements, particularly in gold and silver trading. Gold Analysis - The gold market experienced fluctuations, with a low of 4052 and a high of 4155, facing resistance at 4160, indicating a potential bearish trend if it closes below the midline support [1] - The daily chart shows a small bullish candle, suggesting ongoing consolidation within a bottom range, with critical resistance at 4155-4160 and support at 4025 [1] - The 4-hour chart indicates that the 4044 level is crucial for determining the market's direction, with potential further declines if it breaks below 4100 [1][3] Silver Analysis - Silver is trading within a range of 47.75-49.7, with recent signals indicating a potential for further declines if it fails to hold above key support levels [1][3] - The support level for silver is noted at 46.8-46.9, with resistance at 48.5-48.8, suggesting a cautious approach to trading in this range [3] Oil Market - The oil market is showing signs of upward movement, with a focus on the upper channel resistance at 64.3, indicating a potential for continued gains [6]

Watch These Key Netflix Price Levels as Stock Drops After Disappointing Earnings
Yahoo Finance· 2025-10-22 12:46
Core Insights - Netflix's third-quarter earnings fell short of Wall Street expectations, leading to a decline in share price during premarket trading [1][8] - The company reported earnings per share (EPS) of $5.87, significantly lower than the anticipated $6.92, impacted by an unplanned charge related to a dispute with Brazilian tax authorities [2] - Revenue increased by 17% year-over-year to $11.51 billion, aligning with analyst estimates, and Netflix forecasts another 17% growth in the fourth quarter driven by membership growth, pricing adjustments, and increased ad revenue [2] Stock Performance - Netflix shares dropped over 7% to around $1,150 in premarket trading, despite a 40% increase since the beginning of the year, outperforming the S&P 500 index's 15% gain [3] - The stock is currently consolidating within a descending triangle pattern, indicating a potential bearish trend following the disappointing earnings report [4] Technical Analysis - Key support levels to monitor include approximately $1,065, which may attract buying interest, and a further downside target around $942, where investors may look for buying opportunities [6][7] - Critical overhead resistance levels to watch during potential recovery efforts are near $1,265 and $1,341 [8]
小米超賣觸底?搶反彈關鍵位全解析
Ge Long Hui· 2025-10-22 11:55
Core Viewpoint - Xiaomi's stock price is showing signs of a potential technical rebound after experiencing a period of adjustment, with current trading between 47.1 and 48.4 HKD, and an RSI indicator at 36 indicating oversold conditions [1][2]. Technical Analysis - The stock has fallen below the 10-day moving average (MA10) of 49.5 HKD and the 30-day moving average (MA30) of 53.65 HKD, creating a favorable entry point for investors [1]. - Multiple technical indicators are showing divergence, with momentum oscillators and VR ratio indicators signaling a buy, suggesting that a bottom is forming [1][2]. - Current short-term technical signals indicate a "strong buy" with 13 buy signals and 3 sell signals, reinforcing the notion that it may be a good time for short-term investors to consider buying [2]. Key Price Levels - The critical support level for Xiaomi is at 45.7 HKD; maintaining this level could provide a solid foundation for a rebound. A secondary support level is at 41 HKD [3]. - On the upside, the first resistance level is at 51.6 HKD, and if this is surpassed, the next target would be 55.7 HKD [3]. Derivative Products Performance - Recent performance of derivative products shows significant gains, with Societe Generale's bull certificate achieving a 95% increase over two days amid a 3.83% rise in the underlying stock [6]. - UBS's bull certificate also recorded a 75% increase, indicating strong market expectations for Xiaomi's rebound [6]. Investment Opportunities - For aggressive investors, Societe Generale's bull certificate with a recovery price of 45.5 HKD and a leverage of 14.9 times is recommended [9]. - More conservative strategies can consider UBS's bull certificate with a recovery price of 45 HKD and a leverage of 12.6 times [9]. - Investors anticipating a downturn may look at UBS's bear certificate and Morgan Stanley's bear certificate, both offering leverage of 6.1 times with a recovery price set at 57 HKD [9].
黄金今日行情走势要点分析(2025.10.22)
Sou Hu Cai Jing· 2025-10-22 00:59
Core Viewpoint - The significant drop in gold prices is attributed to multiple factors, including profit-taking, a retreat in safe-haven demand, a strong US dollar, and adverse impacts on the precious metals market [2][3]. Fundamental Analysis - The recent plunge in gold prices is a result of profit-taking and a decline in safe-haven demand, driven by optimistic signals in international trade, ceasefire expectations in the Russia-Ukraine conflict, and potential resolution of the US government shutdown [2]. - The US dollar index rose by 0.34% to 98.98, influenced by the election of Japan's new Prime Minister, which further supported the dollar and increased the cost for non-US currency investors to purchase gold [2]. - Silver prices fell by 7% to $48.62 per ounce, while platinum and palladium also saw declines exceeding 5%, indicating a broader weakness in the precious metals sector [2]. Technical Analysis - On the daily chart, gold formed a "bearish engulfing" pattern, indicating strong bearish signals and effective suppression of bullish momentum [4]. - The break below the 5-day and 10-day moving averages marks the beginning of an adjustment phase, with the next key support level at the weekly MA5, currently around 3990 [4]. - The four-hour chart indicated a potential "double top" pattern, with actual price movement exceeding expectations, highlighting market uncertainty [6]. Future Outlook - In the short term, gold prices may enter a consolidation phase lasting two to three weeks, while medium to long-term factors such as geopolitical uncertainty and central bank buying demand may continue to support gold [3]. - Upcoming inflation data and Federal Reserve meetings could pose potential impacts on gold prices, but the core value of gold as a hedging tool remains unchanged [3].

金融系教授罕见发声:A股目前阶段,还会回到2400点吗,应该加仓还是落袋为安?
Sou Hu Cai Jing· 2025-10-19 04:26
Group 1 - The breakthrough of the 3000-point mark in the A-share market is seen as a significant psychological barrier, indicating a shift in market sentiment rather than just a numerical value [1][2] - The long-term critical level to watch is 3587 points, which, if sustained, would suggest that major players have accumulated enough shares for a potential market rally [2][4] - Historical patterns indicate that after significant bear markets, substantial bull markets typically follow, emphasizing the importance of understanding market cycles rather than timing [4][6] Group 2 - The end of a bear market is characterized by a significant price drop (40%-75%), sufficient duration (often 3-4 years), and a "crazy bear" phase, which has not yet been fully realized in the current market [6] - Current market conditions suggest that A-shares are unlikely to return to the low levels seen at the end of last year (around 2400 points) due to ongoing foreign investment and MSCI index inclusion [6][11] - The MSCI inclusion process is gradual, with a 5% increase in A-share inclusion each quarter, translating to approximately 150 billion yuan in market value being purchased [7][9][11] Group 3 - The total scale of domestic index funds is around 700 billion yuan, and the quarterly MSCI inclusion represents about 20% of this total, indicating a significant impact on the market [11] - Short-term fluctuations in A-shares may occur, but they are expected to remain within a range of about 10% [11]

FPG财盛国际:外汇风险管理的实践与案例分享
Sou Hu Cai Jing· 2025-10-19 04:09
Core Insights - The article emphasizes the importance of foreign exchange risk management in today's volatile market, highlighting practical strategies and successful case studies from FPG Financial International [1][22]. Foreign Exchange Risk Concepts - Understanding the basic concepts of foreign exchange risk is crucial, which includes transaction risk, translation risk, and economic risk, as exchange rate fluctuations significantly impact corporate profitability and cash flow [1][8]. Risk Identification and Assessment - Companies should utilize various data analysis tools to identify potential risks and assess their impact on financial decisions [1][8]. Common Types of Foreign Exchange Risks - Common types of foreign exchange risks include exchange rate risk, interest rate risk, and credit risk, which can affect business decisions and financing costs [1][8]. Hedging Tools and Strategy Analysis - Effective use of hedging tools such as options and futures can help mitigate risks, with a focus on market volatility to select appropriate hedging strategies [1][8]. Case Studies: Successful Mitigation of Exchange Rate Fluctuations - Successful case studies illustrate how companies have effectively mitigated exchange rate fluctuations, such as a multinational corporation using forward contracts to lock in costs and another company employing options strategies to maintain profitability while reducing risk [1][8]. Application of Technical Analysis in Risk Management - Technical analysis aids in predicting market trends, allowing for more informed decision-making through indicators like moving averages and relative strength indices [1][9]. Developing an Effective Risk Management Plan - An effective risk management plan should identify potential risks, set reasonable risk tolerance limits, and include diversification and dynamic adjustment strategies [1][13]. Impact of Foreign Exchange Market Volatility on Businesses - Volatility in the foreign exchange market can directly affect a company's financial stability, particularly in low-margin situations, necessitating effective hedging strategies to protect financial health [1][14]. Real-time Monitoring and Risk Control Mechanisms - Real-time monitoring systems enable companies to stay informed about market fluctuations and take swift action to control risks, with automated tools providing updates on market movements [1][15]. Latest Trends and Outlook in the Global Foreign Exchange Market - Companies must closely monitor the latest trends in the global foreign exchange market, as increasing uncertainty requires flexible responses to rapid exchange rate changes [1][16].
