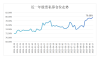
市场赚钱效应
Search documents
刚刚!市场突现三大变数!
券商中国· 2026-01-16 04:22
Core Viewpoint - The market's expectations are changing, with a notable shift in sentiment following a structural interest rate cut, leading to adjustments in various market segments [1]. Group 1: Liquidity Expectations - The M1 growth rate fell in December, with a monthly increase of 2.6 trillion yuan, raising debates about liquidity transmission and corporate investment willingness [2][3]. - Some analysts believe the decline in M1 growth is due to a high base effect, while others point to a decrease in corporate and household liquidity willingness, as indicated by a drop in M0 and demand deposits [3]. - M2 growth increased by 0.5 percentage points to 8.5%, but M1 did not show a corresponding improvement, suggesting that credit expansion has not effectively converted into demand deposits [3]. Group 2: Interest Rate Cut Expectations - On January 15, the central bank announced a 25 basis point cut in the re-lending and rediscount rates, which initially boosted market sentiment [5]. - However, subsequent market performance indicated a divergence from initial expectations, with analysts suggesting that the likelihood of further interest rate cuts before the Spring Festival has decreased, although a reserve requirement ratio cut remains possible [6]. Group 3: Investor Profit Expectations - Market participants' profit expectations are shifting, with State Grid announcing a 4 trillion yuan fixed asset investment plan for the 14th Five-Year Plan, a 40% year-on-year increase [7]. - Despite the initial positive response in the smart grid sector, the overall market sentiment has cooled, as evidenced by a nearly 1 trillion yuan drop in trading volume [7]. - Analysts suggest that a temporary cooling of market sentiment is not necessarily negative, as maintaining high trading volumes could deplete market liquidity and disrupt market ecology [7].


“申”度解盘 | 春季行情的高潮
申万宏源证券上海北京西路营业部· 2026-01-12 03:24
Market Overview - In December 2025, the Shanghai Composite Index experienced a rebound, closing at 3968.84 points, up 2.06% from the end of November 2025. The average daily trading volume decreased by 4.1% to 774.1 billion yuan [5][6]. - The CSI 300 Index also rebounded in December, closing at 4629.94 points, with a 2.28% increase. The average daily trading volume fell by 8% to 426.5 billion yuan [5][6]. January Market Analysis and Outlook Fundamental Drivers - The PMI index returned to the expansion zone in December 2025, with a manufacturing PMI of 50.1%, indicating a marginal improvement in the economic fundamentals after nine months [7]. Equity Risk Premium - The equity risk premium for the CSI 300 Index fell to 5.57 at the end of December, ending a two-month upward trend. This suggests potential for further decline in risk premium, contingent on clear signals of fundamental improvement [9]. Market Profitability - The number of stocks with gains exceeding 20% increased to 357 in December, a 64% rise from the previous month, indicating a resurgence in market profitability [11]. Volume-Price Relationship - The relationship between volume and price remains crucial for sustaining upward trends, as both experienced a rebound in December despite lower trading volumes [13]. Average Transaction Price - The average transaction price on the Shanghai Stock Exchange reached a new high of 16.58 yuan per share, influenced by the listing of high-priced new stocks [15]. Major Market Index Predictions Shanghai Composite Index - The Shanghai Composite Index is expected to continue its rebound, fluctuating around the 60-day moving average, with significant support established at previous market highs [17]. CSI 300 Index - The CSI 300 Index is also anticipated to challenge previous highs, with resistance levels identified at the range of the second half of 2021 [19].

“申”度解盘 | 布局春季行情
申万宏源证券上海北京西路营业部· 2025-12-10 02:31
Market Overview - In November 2025, the Shanghai Composite Index experienced a slight adjustment, closing at 3888.60 points, down 1.67% from the end of October 2025. The average daily trading volume in Shanghai was 806.9 billion yuan, a decrease of 16% month-on-month [5][10]. - The CSI 300 Index remained flat in October, with an average daily trading volume of 463.8 billion yuan, down 26.1% from the previous month [9][10]. Global Economic Influences - The expectation of a Federal Reserve interest rate cut in December has significantly influenced global capital markets. Following a hawkish statement from Fed Chairman Powell, the probability of a rate cut dropped, leading to market adjustments. However, dovish comments from New York Fed President Williams on November 21 raised the probability of a December cut to nearly 70%, prompting a market recovery [5][11]. Equity Risk Premium - The equity risk premium for the CSI 300 Index rose to 5.74 at the end of October, marking a slight increase and indicating a decrease in investor risk appetite. This increase has occurred for two consecutive months, suggesting a potential phase of adjustment before a spring market rally [6][14]. Market Profitability - In November, the number of stocks with gains exceeding 20% decreased to 218, an 8% decline, indicating a return to a consolidation phase. However, the number of stocks with gains over 50% increased, suggesting that while overall profitability is down, specific sectors may be gaining strength [6][16]. Trading Volume Trends - The average daily trading volume fell for the second consecutive month, reaching 1914.7 billion yuan, a decline of 11.5% from October. This trend aligns with the market's price performance, indicating a typical relationship where volume and price movements are positively correlated [6][18]. Price Movement Analysis - The current market rally has not yet reached the average growth levels seen in previous major uptrends. Historical data shows that the average price increase for stocks on the Shanghai Stock Exchange during uptrends is approximately 115% over 30 months, while the Shenzhen Stock Exchange sees an average increase of 172% over 29 months. The current rally has seen gains of 87% in Shanghai and 118% in Shenzhen since the "924" market [7][20]. Index Predictions - The Shanghai Composite Index faced resistance in November, breaking below the 60-day moving average and leaving a gap on the daily chart. The previous market high from 2021 has become a significant support level, while the pressure point remains at the November high [8][24]. - The CSI 300 Index also showed clear signs of adjustment in November, breaking below the 60-day moving average and leaving two downward gaps. The primary technical resistance is at the range established during the second half of 2021, with support near the six-month moving average [8][26].

“申”度解盘 | 布局春季行情
申万宏源证券上海北京西路营业部· 2025-12-08 02:00
Core Viewpoint - The article discusses the recent adjustments in the Shanghai Composite Index and the implications of Federal Reserve's interest rate decisions on global capital markets, highlighting the importance of market support and resistance levels [1][6][11]. Market Overview - In November 2025, the Shanghai Composite Index closed at 3888.60 points, down 1.67% from the end of October 2025, with an average daily trading volume of 806.9 billion yuan, a decrease of 16% [6][10]. - The highest point for the Shanghai Composite Index in November was 4034.08 points, while the lowest was 3816.58 points, aligning with expectations [9][10]. - The CSI 300 Index remained flat in October, with an average daily trading volume of 463.8 billion yuan, down 26.1% [6][10]. Federal Reserve Influence - The anticipation of a rate cut by the Federal Reserve in December has significantly influenced global capital market trends, with market expectations for a rate cut rising to nearly 70% following dovish comments from New York Fed President Williams [6][11]. Equity Risk Premium - The equity risk premium for the CSI 300 Index rose to 5.74 at the end of October, indicating a decrease in investor risk appetite, marking a second consecutive month of increase [7][13]. Market Profitability - In November, the number of stocks with gains exceeding 20% decreased to 218, an 8% decline, indicating a return to a more stagnant market environment [7][15]. - The number of stocks with gains over 50% increased, suggesting that while overall profitability is declining, specific sectors may be experiencing stronger performance [7][15]. Trading Volume and Price Relationship - The average daily trading volume fell for the second consecutive month to 1914.7 billion yuan, down 11.5% from October, reflecting a typical correlation between trading volume and market price movements [7][17]. Price Movement Analysis - The current market rally has not yet reached the average growth levels seen in previous major uptrends, with the Shanghai and Shenzhen markets experiencing significant price adjustments [8][19]. - Historical data indicates that the average price increase for stocks on the Shanghai Stock Exchange during uptrends is approximately 115% over 30 months, while the Shenzhen Stock Exchange sees an average increase of 172% over 29 months [8][19]. Index Predictions - The Shanghai Composite Index is currently facing resistance after a downward adjustment in November, having broken below the 60-day moving average, with key support now at the levels established in 2021 [6][21]. - The CSI 300 Index also showed significant adjustments in November, with two downward gaps and a breach of the 60-day moving average, indicating potential challenges ahead [6][24].

10年新高!一波大行情要来了?
大胡子说房· 2025-10-30 11:07
Core Viewpoint - The Shanghai Composite Index has reached 4000 points for the first time in 10 years, indicating a gradual increase in market enthusiasm, despite a lack of strong profit-making effects for investors [1][2][28]. Market Performance - The Shanghai Composite Index closed at 4002.83, with a gain of 14.61 points (+0.37%), while the Shenzhen Component Index and the ChiNext Index also saw increases of 120.55 points (+0.90%) and 43.70 points (+1.35%) respectively [2]. - The index has risen from a low of 3100 points this year, reflecting a warming market sentiment [2]. Investor Sentiment - Many investors are conflicted about entering the market, fearing they might buy at a peak while also wanting to capitalize on the ongoing bull market [3][4]. - The current market reaction to the index reaching 4000 points is notably subdued compared to previous instances, with less media excitement and fewer discussions [6][8]. Market Dynamics - The speed of retail investors moving their deposits has decreased compared to previous bull markets, indicating a lack of confidence in sustained upward movement [7]. - The primary reason for the lack of enthusiasm is that while the index has risen, the actual account balances of many investors have not increased, leading to a disconnect between index performance and individual investor returns [9][10][12]. Market Control - The new high in the index is largely attributed to government intervention rather than an influx of new capital, suggesting that the market is currently in a phase of stock selection rather than broad-based growth [15][18]. - The absence of sufficient incremental capital means that the market is characterized by a struggle between existing funds, often resulting in larger funds dominating smaller ones [19][21]. Future Outlook - Historically, the Shanghai Composite Index has previously surpassed 4000 points in 2007 and 2015, both times leading to further increases towards 5000 points [26][28]. - Current monetary policies, both domestically and internationally, are supportive of continued upward movement in the index, which could enhance profit-making opportunities in the future [30][31]. Investment Strategy - Investors are advised to identify undervalued sectors and stocks that may attract large capital flows as the index continues to rise [36]. - The expectation is that as the index approaches 5000 points, the profit-making effect will gradually improve, although this process may take time and require patience [35].

大A突破新高!一波大行情要来了?
大胡子说房· 2025-10-29 04:23
Core Viewpoint - The Shanghai Composite Index has reached 4000 points for the first time in 10 years, indicating a gradual increase in market enthusiasm, despite the lack of strong market reactions and profit-making opportunities for investors [1][2][6][9]. Market Performance - The Shanghai Composite Index closed at 4002.83, with a 0.37% increase, while the Shenzhen Component Index and the ChiNext Index also saw gains of 0.90% and 1.35% respectively [2]. - The index has risen from a low of 3100 points this year, reflecting a warming market sentiment [2]. Investor Sentiment - Many investors are conflicted about entering the market, fearing they might buy at a peak and face subsequent declines [3][4]. - The current market reaction to the index reaching 4000 points is muted compared to previous instances, with less media excitement and fewer discussions [6][8]. Profitability Concerns - Despite the index reaching new highs, the overall market has not shown strong profit-making effects, with many investors' account balances remaining stagnant since August or September [9][10][12]. - The divergence between index performance and individual stock profitability is attributed to a lack of incremental capital entering the market, leading to a scenario where large funds dominate the trading landscape [18][21]. Historical Context - Historically, the Shanghai Composite Index has reached 4000 points twice before, in 2007 and 2015, both times followed by a rise to 5000 points [26][27]. - Current government policies continue to support the capital market, suggesting potential for further upward movement in the index [27][30]. Future Outlook - The market is expected to transition from a phase of stock selection to one where larger funds will begin to invest in undervalued sectors and stocks, potentially improving the overall profitability for investors [32][34]. - Investors are advised to identify undervalued sectors and stocks that may attract large funds as the index continues to rise [36].

股票私募仓位创近一年新高,头部私募尤为激进
Guo Ji Jin Rong Bao· 2025-10-24 12:52
Core Insights - The overall stock private equity positions have reached a nearly one-year high, with a particularly aggressive stance from large private equity firms managing between 5 billion to 10 billion yuan, where over 60% are fully invested, indicating a highly optimistic market outlook [1][3]. Group 1: Stock Private Equity Positioning - As of October 17, the stock private equity position index rose to 79.68%, an increase of 0.55% from the previous week, marking a nearly one-year high. Since August, this index has cumulatively increased by 5.75%, showing a significant trend towards increasing positions [1][3]. - Over 63.40% of stock private equity firms are fully invested, while medium positions account for 20.41%. Low and empty positions are only 11.47% and 4.72%, respectively, indicating that the majority of private equity firms are opting for high positions [3]. Group 2: Aggressive Positioning of Leading Private Equity Firms - The position index for private equity firms of different sizes as of October 17 is as follows: over 100 billion yuan at 80.18%, 50-100 billion yuan at 87.35%, 20-50 billion yuan at 76.68%, 10-20 billion yuan at 78.09%, 5-10 billion yuan at 80.79%, and 0-5 billion yuan at 79.65%. Notably, firms managing between 50 billion to 100 billion yuan have the highest position at 87.35%, a three-year high [5][6]. - The sustained high positions of large private equity firms reflect their long-term confidence in the market, supported by stable client bases and low redemption pressures, allowing for a long-term holding strategy [5]. Group 3: Market Conditions and Confidence - The recent upward trend in the A-share market since August, along with clear upward movements in certain growth and consumer sectors, has attracted private equity funds to increase their allocations [6]. - Recent policy signals aimed at stabilizing growth and encouraging innovation have bolstered private equity firms' confidence in the medium to long-term market performance. Additionally, the overall liquidity in the market is reasonable and ample, providing favorable conditions for private equity to increase positions while reducing the costs associated with large-scale adjustments [7].
年内私募分红逾140亿元 股票策略成分红主力
Zheng Quan Shi Bao Wang· 2025-10-15 03:11
Group 1 - The A-share market has shown strong profitability this year, leading to increased dividend distribution by private equity funds, with 1,038 products distributing dividends totaling 14.085 billion yuan as of September 30, 2025 [1] - Stock strategy products have been the primary contributors to dividends, accounting for 107.35 billion yuan, which is 76.22% of the total, and achieving an average return of 31.19%, the highest among five mainstream strategies [1][2] - The active dividend distribution from stock strategy products is attributed to strong performance, management's intention to control product scale, and enhancing investor experience [1] Group 2 - Multi-asset strategies have distributed dividends 190 times, totaling 1.267 billion yuan, ranking second after stock strategies [2] - Subjective private equity products have shown more active dividend distribution, with 848 distributions totaling 94.15 billion yuan, while quantitative products have distributed 443 times for 46.70 billion yuan [2] - The rise in private equity fund dividends reflects both market profitability and management's efforts to optimize operations and improve investor experience [3] Group 3 - Market outlook suggests a continued upward trend amidst fluctuations, with investment strategies focusing on growth and balanced allocation, particularly in TMT, non-ferrous metals, and pharmaceutical sectors [3] - Companies with competitive advantages, high-quality earnings, and core technology patents are prioritized for stock selection, alongside those with improved fundamentals [3] - Confidence in China's economy and capital markets remains strong, with a focus on long-term competitive advantage in sectors represented by new productive forces [3]
华泰证券:资金面正反馈仍在持续
Ge Long Hui· 2025-09-22 02:07
Core Viewpoint - The A-share market has experienced adjustments after reaching new highs, but it remains in a consolidation phase since September, with a positive outlook on liquidity and market sustainability [1] Market Analysis - The current market's sustainability is heavily influenced by the liquidity situation, which appears to be positive [1] - There is a focus on the direction of market profitability moving forward, with ongoing improvements in overseas liquidity and geopolitical issues [1] - The domestic economic fundamentals are showing upward momentum, supporting a mid-term bullish outlook for the market [1] Investment Strategy - It is recommended to maintain a high position in the market, with an emphasis on balanced sector selection [1] - Attention should be given to the continuation of the positive trends indicated in the third-quarter reports [1] - Specific sectors to focus on include domestic computing power chains, innovative pharmaceuticals, robotics, chemicals, batteries, and leading consumer goods companies [1]
华泰证券A股策略:资金面正反馈仍在持续
Zheng Quan Shi Bao Wang· 2025-09-22 00:27
Core Viewpoint - The report from Huatai Securities indicates that after reaching a new high, the A-share market has experienced some adjustments but remains in a consolidation phase since September. The sustainability of the current market trend is largely dependent on the positive feedback from the liquidity situation [1] Market Conditions - The current liquidity environment is viewed as positive, with ongoing improvements in overseas liquidity and geopolitical issues. The domestic economic fundamentals are also showing upward momentum, supporting the mid-term outlook for the market [1] Investment Strategy - The company recommends maintaining a high position in the market and emphasizes the importance of balanced sector selection. Attention should be paid to the continuation of profitability trends as reflected in the upcoming third-quarter reports [1] Sector Focus - Specific sectors to watch include: - Domestic computing power chain - Innovative pharmaceuticals - Robotics - Chemicals - Batteries - Leading consumer goods companies [1]