Guo Jia Tong Ji Ju
Search documents
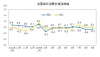
2025年9月份居民消费价格同比下降0.3% 环比上涨0.1%
Guo Jia Tong Ji Ju· 2025-10-15 01:31
Core Insights - In September 2025, the national consumer price index (CPI) decreased by 0.3% year-on-year, with urban areas down 0.2% and rural areas down 0.5% [1] - The average CPI for January to September 2025 showed a decline of 0.1% compared to the same period last year [1] - Month-on-month, the CPI increased by 0.1% in September, with urban prices stable and rural prices rising by 0.2% [1] Price Changes by Category - Food and tobacco prices fell by 2.6% year-on-year, contributing approximately 0.74 percentage points to the CPI decline [3] - Fresh vegetable prices dropped by 13.7%, impacting the CPI by about 0.35 percentage points, while pork prices decreased by 17.0%, contributing 0.26 percentage points to the CPI decline [3] - Other categories showed mixed results, with clothing prices up by 1.7% and healthcare costs rising by 1.1% year-on-year [3] Month-on-Month Price Movements - In September, food and tobacco prices rose by 0.5% month-on-month, contributing approximately 0.13 percentage points to the CPI increase [6] - Fresh vegetable prices increased by 6.1% month-on-month, while pork prices saw a slight decrease of 0.7% [6] - Other categories experienced varied changes, with transportation and communication prices declining by 0.9% and 0.4%, respectively [6] Detailed Price Index Data - The CPI for September 2025 was 0.1% higher than the previous month, while the year-on-year change was a decrease of 0.3% [8] - Food prices saw a significant year-on-year decline of 4.4%, while non-food prices increased by 0.7% [8] - The index for clothing and other services showed increases of 1.7% and 9.9% year-on-year, respectively [8]

统计局:9月下旬全国各煤种价格全面上涨
Guo Jia Tong Ji Ju· 2025-10-13 01:32
Core Insights - In late September, coal prices across various types in China experienced a comprehensive increase, indicating a shift in market dynamics [1] Price Changes Summary - Anthracite coal (washed middle block, volatile matter ≤8%) price reached 917.0 CNY/ton, up by 47.9 CNY/ton, a rise of 5.5% [1] - Ordinary mixed coal (Shanxi mixed coal with a calorific value of 4500 kcal) price was 544.0 CNY/ton, increasing by 14.7 CNY/ton, a rise of 2.8% [1] - Shanxi big mixed coal (higher quality mixed coal with a calorific value of 5000 kcal) price stood at 616.9 CNY/ton, up by 17.6 CNY/ton, a rise of 2.9% [1] - Shanxi premium mixed coal (high-quality mixed coal with a calorific value of 5500 kcal) price was 706.9 CNY/ton, increasing by 17.0 CNY/ton, a rise of 2.5% [1] - Datong mixed coal (Datong produced mixed coal with a calorific value of 5800 kcal) price reached 744.9 CNY/ton, up by 17.5 CNY/ton, a rise of 2.4% [1] - Coking coal (main coking coal, sulfur content <1%) price was 1478.6 CNY/ton, increasing by 57.2 CNY/ton, a rise of 4.0% [1] - In summary, anthracite coal prices continued to rise, while the trend for thermal coal shifted from divergence to collective increase, and coking coal prices reversed from decline to increase [1] Coking Coal and Coke Price Summary - In late September, the price of coke (quasi-first-grade metallurgical coke, ash content between 12.01% and 13.50%) was 1346.4 CNY/ton, down by 14.3 CNY/ton, a decline of 1.1% [1]
9月下旬全国流通市场钢材价格走势分化
Guo Jia Tong Ji Ju· 2025-10-13 01:32
Core Insights - The national statistics indicate a mixed trend in steel prices across the market as of late September 2025 [1] Price Summary - Rebar (Φ20mm, HRB400E) price remains stable at 3184.1 CNY/ton, unchanged from the previous period, which had a slight increase of 0.3% [1] - Wire rod (Φ8-10mm, HPB300) price increased by 13.7 CNY/ton to 3331.3 CNY/ton, reflecting a 0.4% rise, consistent with the previous period [1] - Ordinary medium plate (20mm, Q235) price decreased by 5.2 CNY/ton to 3507.7 CNY/ton, showing a 0.1% decline, compared to a 0.3% increase in the prior period [1] - Hot-rolled ordinary coil (4.75-11.5mm, Q235) price fell by 16.4 CNY/ton to 3412.4 CNY/ton, marking a 0.5% decrease, whereas the previous period had a 0.6% increase [1] - Seamless steel pipe (219*6, 20) price dropped by 2.7 CNY/ton to 4141.1 CNY/ton, with a 0.1% decline, which is a larger drop compared to the previous period [1] - Angle steel (5) price decreased by 8.9 CNY/ton to 3472.1 CNY/ton, reflecting a 0.3% decline, contrasting with a 0.3% increase in the prior period [1]
2025年9月下旬全国生猪(外三元)价格为12.4元/公斤 较9月中旬下降4.6%
Guo Jia Tong Ji Ju· 2025-10-11 03:09
Group 1 - The core observation indicates that in the monitoring of prices for 50 important production materials across nine categories, there were 15 products with price increases, 31 with decreases, and 4 remaining stable from mid to late September 2025 [1] - The national price of live pigs (external three yuan) is reported at 12.4 yuan per kilogram, reflecting a decrease of 4.6% compared to mid-September [1]
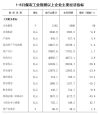
2025年1-8月煤炭工业规模以上企业主要经济指标
Guo Jia Tong Ji Ju· 2025-10-11 01:40
1-8月煤炭工业规模以上企业主要经济指标 | 指 标 名 称 | 单位 | 本月止累计 | 去年同期 | 增长(增加)% | | --- | --- | --- | --- | --- | | 主要财务指标 | | | | | | 企业数量 | 个 | 5185 | 5096 | 89 | | 应收账款 | 亿元 | 5046.9 | 5305. 2 | -4.9 | | 产成品 | 亿元 | 845. 3 | 817. 4 | 3.4 | | 流动资产平均余额 | 亿元 | 34627.0 | 35109. 1 | -1.4 | | 资产合计 | 亿元 | 78997.6 | 77701. 8 | 1.7 | | 负债合计 | 亿元 | 48095. 7 | 46271. 1 | 3.9 | | 营业收入 | 亿元 | 16559. 1 | 20919. 7 | -20. 8 | | 营业成本 | 亿元 | 12079. 2 | 13953. 0 | -13.4 | | 销售费用 | 亿元 | 224. 1 | 258. 5 | -13.3 | | 管理费用 | 亿元 | 1066. 3 | 1187.7 ...

国家统计局:2025年9月下旬流通领域棉花价格下跌1.9%
Guo Jia Tong Ji Ju· 2025-10-10 10:33
Core Viewpoint - The monitoring of prices for 50 important production materials across nine categories in the national circulation market indicates a mixed trend in prices, with 15 products experiencing price increases, 31 seeing declines, and 4 remaining stable [1] Price Changes Summary - Cotton (specifically, white cotton grade three) has a current price of 14,374.1 yuan per ton, which represents a decrease of 280.2 yuan per ton, equating to a decline of 1.9% compared to the previous period [1]
1月—8月煤炭工业规模以上企业主要经济指标
Guo Jia Tong Ji Ju· 2025-10-10 08:27
Core Insights - The article highlights a significant decline in key financial metrics for the company, indicating a challenging financial environment [1] Financial Performance Summary - The number of enterprises decreased to 2,185 from 5,096, representing a decline of 89% [1] - Accounts receivable decreased to 504.69 billion from 530.52 billion, a reduction of 4.9% [1] - Finished goods inventory increased to 84.53 billion from 81.74 billion, showing a growth of 3.4% [1] - Average balance of current assets decreased to 3,462.7 billion from 3,510.91 billion, down by 1.4% [1] - Total assets rose to 7,899.76 billion from 7,770.18 billion, an increase of 1.7% [1] - Total liabilities increased to 4,809.57 billion from 4,627.11 billion, up by 3.9% [1] - Operating revenue fell to 1,655.91 billion from 2,091.97 billion, a decline of 20.8% [1] - Operating costs decreased to 1,207.92 billion from 1,395.30 billion, down by 13.4% [1] - Selling expenses reduced to 22.41 billion from 25.85 billion, a decrease of 13.3% [1] - Administrative expenses fell to 106.63 billion from 118.77 billion, down by 10.2% [1] - Financial expenses decreased to 33.87 billion from 37.47 billion, a reduction of 9.6% [1] - Total profit (after subsidies) dropped to 193.73 billion from 417.22 billion, a significant decline of 53.6% [1] - Losses from loss-making enterprises increased to 78.21 billion from 54.82 billion, up by 42.7% [1] - The asset-liability ratio rose to 96% from 60.9%, an increase of 1.3% [1]
2025年9月下旬流通领域重要生产资料市场价格变动情况
Guo Jia Tong Ji Ju· 2025-10-10 01:30
Core Insights - The monitoring of market prices for 50 important production materials across nine categories shows a mixed trend, with 15 products experiencing price increases, 31 seeing declines, and 4 remaining stable [2]. Group 1: Price Changes in Major Categories - In the black metal category, rebar prices remained stable at 3184.1 yuan per ton, while wire rod increased by 13.7 yuan (0.4%) to 3331.3 yuan per ton. However, ordinary medium plates and hot-rolled ordinary plates saw declines of 5.2 yuan (-0.1%) and 16.4 yuan (-0.5%), respectively [4]. - For non-ferrous metals, electrolytic copper rose by 659.3 yuan (0.8%) to 81,210.0 yuan per ton, while aluminum ingots fell by 174.3 yuan (-0.8%) to 20,720.0 yuan per ton [4]. - Chemical products showed significant declines, with sulfuric acid dropping by 40.4 yuan (-5.9%) to 644.6 yuan per ton and caustic soda decreasing by 25.7 yuan (-2.9%) to 867.5 yuan per ton [4]. Group 2: Energy and Coal Prices - In the petroleum and natural gas sector, liquefied natural gas (LNG) prices decreased by 23.2 yuan (-0.6%) to 3840.6 yuan per ton, while liquefied petroleum gas (LPG) fell by 23.0 yuan (-0.5%) to 4484.7 yuan per ton [4]. - Coal prices showed a mixed trend, with anthracite coal increasing by 47.9 yuan (5.5%) to 917.0 yuan per ton, while coking coal decreased by 14.3 yuan (-1.1%) to 1346.4 yuan per ton [4]. Group 3: Agricultural and Forestry Products - In agricultural products, the price of rice fell by 19.3 yuan (-0.5%) to 4001.7 yuan per ton, while wheat increased by 9.2 yuan (0.4%) to 2422.2 yuan per ton [5]. - The price of corn decreased by 4.0 yuan (-0.2%) to 2300.0 yuan per ton, and cotton prices dropped by 280.2 yuan (-1.9%) to 14,374.1 yuan per ton [5]. - In forestry products, natural rubber prices fell by 239.3 yuan (-1.6%) to 14,633.3 yuan per ton, while corrugated paper saw an increase of 31.3 yuan (1.1%) to 2812.0 yuan per ton [5].
研究与试验发展(R&D)经费投入稳定增长投入强度较快提升
Guo Jia Tong Ji Ju· 2025-10-09 01:21
Core Insights - The total R&D expenditure in China for 2024 is projected to exceed 3.6 trillion yuan, marking an 8.9% increase from the previous year, indicating a stable growth trend in R&D investment [2] - China ranks second globally in R&D expenditure, following the United States, and has a higher growth rate than major economies [2] - The R&D expenditure intensity (R&D expenditure as a percentage of GDP) is 2.69%, up by 0.11 percentage points from the previous year, reflecting a faster increase than the average since the 14th Five-Year Plan [2] R&D Expenditure Breakdown - In 2024, R&D expenditures from enterprises, government research institutions, and higher education institutions are 28,211.6 billion yuan, 4,231.6 billion yuan, and 3,065.5 billion yuan respectively, with growth rates of 8.8%, 9.7%, and 11.3% [3] - Enterprises contribute over 75% of total R&D funding, with a contribution rate of 77.1% to the overall growth of R&D expenditure [3] - High-tech manufacturing and equipment manufacturing sectors show R&D expenditure growth rates of 10.2% and 10.5%, respectively, outpacing the overall growth rate [3] Basic Research Investment - Basic research funding reached 250.09 billion yuan, with a growth rate of 10.7%, while applied research and experimental development funding grew by 17.6% and 7.6% respectively [4] - The proportion of basic research funding in total R&D expenditure is 6.88%, the highest in history, with government research institutions and universities contributing significantly to this growth [4] Fiscal Support and Tax Incentives - National fiscal science and technology expenditure for 2024 is 12,629.2 billion yuan, a 5.3% increase from the previous year, focusing on basic research and scientific research facilities [5] - Tax incentives for R&D have led to a 16.7% increase in the number of enterprises benefiting from R&D expense deductions and a 25.5% increase in the amount of expenses claimed compared to 2021 [5] Regional Development and Innovation - R&D expenditures in eastern, central, western, and northeastern regions of China are 23,773.0 billion yuan, 6,582.1 billion yuan, 4,759.8 billion yuan, and 1,211.9 billion yuan respectively, all showing significant growth [7] - Key regions like Beijing, Shanghai, and Guangdong have R&D expenditures exceeding 5,000 billion yuan, highlighting their role as innovation hubs [7] - The Yangtze River Economic Belt and Yellow River Basin regions also show robust R&D expenditure growth, indicating effective regional collaboration in innovation [7]
9月制造业采购经理指数为49.8%
Guo Jia Tong Ji Ju· 2025-09-30 05:22
Group 1: Manufacturing PMI Overview - The manufacturing Purchasing Managers' Index (PMI) for September is 49.8%, an increase of 0.4 percentage points from the previous month, indicating continued improvement in manufacturing sentiment [1] - Large enterprises have a PMI of 51.0%, up 0.2 percentage points, indicating expansion; medium-sized enterprises have a PMI of 48.8%, down 0.1 percentage points; small enterprises have a PMI of 48.2%, up 1.6 percentage points, but still below the critical point [4] - The production index is at 51.9%, up 1.1 percentage points, indicating accelerated production expansion; the new orders index is at 49.7%, up 0.2 percentage points, suggesting improved market demand [4] Group 2: Non-Manufacturing PMI Overview - The non-manufacturing business activity index for September is 50.0%, a decrease of 0.3 percentage points, indicating overall stability in non-manufacturing business volume [7] - The construction business activity index is at 49.3%, up 0.2 percentage points; the service industry index is at 50.1%, down 0.4 percentage points, with certain sectors like postal and financial services showing strong performance [9] - The new orders index for non-manufacturing is at 46.0%, down 0.6 percentage points, indicating a decline in market demand; the input prices index is at 49.0%, down 1.3 percentage points, suggesting a decrease in input costs [14] Group 3: Employment and Expectations - The employment index for manufacturing is at 48.5%, up 0.6 percentage points, indicating improved hiring sentiment in manufacturing [5] - The employment index for non-manufacturing is at 45.0%, down 0.6 percentage points, indicating a decline in hiring sentiment; the construction sector's employment index is particularly low at 39.7% [15] - The business activity expectations index for non-manufacturing is at 55.7%, down 0.5 percentage points, but still indicates optimism among most non-manufacturing enterprises [15] Group 4: Comprehensive PMI Insights - The comprehensive PMI output index for September is 50.6%, an increase of 0.1 percentage points, indicating continued expansion in production and business activities across sectors [15]
