可选消费
Search documents
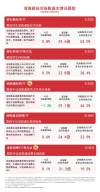
美国消费行业9月跟踪报告:美国政府停摆,信心指数进一步下滑
Haitong Securities International· 2025-10-31 09:40
Investment Rating - The report maintains a cautious stance on the consumer sector, particularly essential consumer goods, due to ongoing economic pressures and declining consumer confidence [4][58]. Core Insights - Consumer confidence continues to decline, with the University of Michigan Consumer Sentiment Index dropping to 53.6 in October from 55.1 in September, marking the third consecutive month of decline [1][7]. - Inflation appears to be stabilizing, with the Consumer Price Index (CPI) showing a year-on-year increase of 3.0% in September, while core CPI also increased by 3.0% [9][12]. - The labor market shows signs of weakness, with ADP reporting a decrease of 32,000 jobs in September and job openings falling to 7.227 million [13][17]. - The essential consumer goods sector is experiencing mixed performance, with alcohol prices rebounding moderately while food and beverage inflation shows significant divergence across categories [24][28]. Summary by Sections Macroeconomic Overview - Consumer confidence is declining, with the confidence index at 53.6 in October, down from 55.1 in September [1][7]. - Inflation is stabilizing, with September CPI at 3.0% year-on-year and core CPI also at 3.0% [9][12]. - The labor market is weak, with a decrease of 32,000 jobs reported by ADP in September [13][17]. - Credit data shows a decrease in revolving credit by $5.958 billion in August, indicating cautious consumer borrowing [19]. Essential Consumer Goods - Alcohol prices have shown a moderate rebound, driven by strong recovery in spirits prices, while wine prices continue to decline [24][28]. - The food and beverage sector shows significant inflation divergence, with tobacco CPI above 5.0% and dairy CPI remaining weak [28][55]. Stock Market Performance - The discretionary consumer goods sector outperformed, closing up 5.8%, while essential consumer goods closed down 1.4% [57]. - Essential consumer goods ETF saw a net inflow of $670 million, reflecting rising investor confidence [57][35]. Investment Recommendations - The report advises maintaining caution in the consumer sector, focusing on essential consumer goods due to economic uncertainties and declining consumer confidence [4][58].
张坤三季度调仓动态出炉!或被动减持腾讯、阿里巴巴,顺丰跌出前十大重仓股名单,大手笔加仓分众传媒
Ge Long Hui A P P· 2025-10-28 08:23
Core Viewpoint - Zhang Kun, a prominent fund manager at E Fund, has disclosed the top ten holdings of four funds as of Q3 2025, indicating a strategic shift in investment focus towards consumer and technology sectors, while also reflecting on the long-term growth potential of China's consumption market [1][9]. Fund Holdings Summary - The combined top ten holdings of Zhang Kun's four funds include Tencent Holdings, Alibaba-W, Kweichow Moutai, Luzhou Laojiao, Shanxi Fenjiu, Wuliangye, JD Health, Yum China, CNOOC, and Focus Media [1]. - The total market value of the top holdings is as follows: - Tencent Holdings: 56.18 billion - Alibaba-W: 56.16 billion - Kweichow Moutai: 51.36 billion - Luzhou Laojiao: 51.13 billion - Shanxi Fenjiu: 50.69 billion - Wuliangye: 50.64 billion - JD Health: 45.02 billion - Yum China: 28.69 billion - CNOOC: 27.60 billion - Focus Media: 26.44 billion [2]. Changes in Holdings - Compared to Q2 2025, the only change in the top ten holdings was the exit of SF Express, replaced by Focus Media [2]. - In Q3, Zhang Kun reduced his holdings in Tencent and Alibaba by 2.465 million shares and 17.392 million shares, respectively, likely due to price increases of 31% and 61% during the quarter [5]. - In the liquor sector, there was an increase in Kweichow Moutai by 48,100 shares, while reductions were made in Luzhou Laojiao, Shanxi Fenjiu, and Wuliangye [6]. Sector Analysis - In the consumer sector, there were reductions in Luzhou Laojiao and Shanxi Fenjiu, but increases in Kweichow Moutai and Wuliangye, indicating a positive outlook on premium liquor [7]. - The new investments in Yum China and Focus Media reflect expectations of recovery in the restaurant and advertising sectors [7]. - In the technology sector, there were reductions in Tencent and Alibaba across all funds, while new positions were taken in Google-A and reductions in ASML and TSMC, indicating a shift towards more globally competitive tech giants [8]. Long-term Outlook - The team believes that China's consumption growth is likely to outpace GDP growth, supported by a low consumer spending ratio relative to GDP compared to other major economies [9]. - The potential for a unified market of 1.4 billion people offers significant scale advantages for product development and sales [9]. - The current low valuation levels provide a safety margin for investments in the domestic consumption market, which is expected to remain fertile ground for long-term investment [9].


加仓分众传媒、百胜中国 张坤:中国消费增速有望长期跑赢GDP增速
Sou Hu Cai Jing· 2025-10-28 06:47
Core Viewpoint - Zhang Kun, a prominent fund manager at E Fund, has demonstrated strong performance across his managed funds, focusing on domestic consumption and technology sectors while adjusting his portfolio in response to market conditions [1][2][14]. Fund Performance - As of September 30, 2025, all four funds managed by Zhang Kun outperformed their respective benchmarks, with a total managed scale of approximately 56.544 billion yuan [1]. - The E Fund Blue Chip Select Fund reported a net asset value of 36.413 billion yuan, with a net value growth rate of 16.37%, surpassing the benchmark return of 13.25% [3][8]. - The E Fund Quality Select Fund achieved a net value growth rate of 17.58%, outperforming its benchmark of 13.57% [8]. Portfolio Adjustments - In Q3 2025, Zhang Kun increased his focus on domestic consumption, adding positions in companies like Kweichow Moutai and Wuliangye, while reducing holdings in JD Health and other stocks [4][5]. - The E Fund Blue Chip Select Fund saw a significant net redemption of 2.078 billion shares, marking the second-highest redemption record since its inception [3]. - The E Fund Quality Select Fund saw changes in its top ten holdings, with notable increases in Kweichow Moutai and Wuliangye, while JD Health and other stocks were reduced [7][9]. Sector Focus - Zhang Kun emphasized the potential of China's domestic consumption market, predicting that the growth rate of Chinese consumption will exceed both GDP growth and global GDP growth in the long term [2][14][15]. - The portfolio adjustments reflect a strategic shift towards sectors with sustained growth potential, particularly in consumer goods and technology [14][16]. Geographic Allocation - There has been an increase in holdings in Hong Kong, Taiwan, and the U.S., while exposure to South Korean stocks has significantly decreased [2][12]. - The E Fund Asia Select Fund, the smallest among Zhang Kun's managed funds, has seen a rise in its holdings in major markets, with Google entering its top ten holdings for the first time [12][13]. Investment Philosophy - Zhang Kun maintains a long-term investment philosophy, focusing on companies with strong business models and competitive advantages, despite short-term market volatility [14][15][16]. - He believes that the current low valuation levels in the market provide a significant margin of safety for long-term investments in quality companies [16].

帮主郑重:超千家三季报扎堆出,别光看涨跌,这3个信号才定生死
Sou Hu Cai Jing· 2025-10-25 08:48
Core Insights - The overall performance of companies in the third quarter is mixed, with some showing stable growth while others are struggling with inventory issues and slower sales [3][4] Industry Analysis - In the high-end manufacturing sector, particularly in industrial robotics, companies reported revenue growth of 15%-20% and a 2% increase in gross margins, indicating strong demand [3] - The renewable energy sector shows significant divergence, with solar component companies experiencing profit declines of 10%-15% due to weak overseas demand, while energy storage inverter companies saw profits surge by over 40% driven by demand in Europe and Southeast Asia [4] - The semiconductor industry is showing signs of recovery, with orders for upstream equipment companies increasing by 12% quarter-over-quarter, while some consumer electronics companies are beginning to reduce inventory levels [4] - In the consumer sector, essential goods like grains and oils maintain stable revenue growth around 5%, while discretionary items like home appliances are experiencing a mixed recovery, with high-end models performing well but mid-range products lagging [4] Financial Metrics - Companies should focus on three key metrics when evaluating quarterly reports: trends over multiple quarters, cash flow, and industry position [5] - A company showing a trend of revenue and profit growth over several quarters is more reliable than one with a single strong quarter but declining performance in previous periods [5] - Negative cash flow despite profit increases indicates potential issues, as it suggests reliance on accounts receivable rather than actual cash generation [5] - Companies gaining market share even in a declining industry are likely to outperform their peers in the long run [5] Investment Strategy - A three-pronged strategy for long-term investment includes: eliminating companies with consecutive declines in revenue and profit along with worsening cash flow, identifying companies in a recovery phase with decreasing inventory and improving gross margins, and avoiding companies that rely on one-time gains from asset sales or government subsidies [6] - An example of a company that is managing inventory effectively is a white liquor company, which, despite slow revenue growth, reduced inventory by 10% and improved sales velocity, indicating a positive trend [6]

九号公司中证ESG评级升至AAA 可选消费行业排名第一
Zheng Quan Shi Bao Wang· 2025-10-24 10:32
近期,九号公司(689009)获中证指数ESG评级AAA等级,在可选消费行业中位列第一,显示公司在环 境、社会责任与公司治理方面的领先水平。 本次评级结果体现了九号公司在ESG管理体系建设、绿色发展及社会责任履行上的持续努力。公司将继 续以"科技创新、绿色出行"为核心,深化ESG实践,推动可持续发展,巩固行业领先地位。(燕云) 中证指数ESG评级目前覆盖近5000家上市公司和约2500家发债主体,仅基于公开信息进行评分,权威性 高。评级采用十档体系,从高到低依次为:AAA、AA、A、BBB、BB、B、CCC、CC、C、D,其中 AAA/AA/A代表表现优秀、风险低、具备可持续发展机会。 ...
港股大型科技股午后走强,港股通互联网ETF(513040)、恒生科技ETF易方达(513010)助力布局科技龙头
Sou Hu Cai Jing· 2025-10-23 10:54
Core Insights - The Hong Kong stock market experienced overall fluctuations, with major technology stocks like Alibaba, Tencent, and Meituan showing strength towards the end of the trading session. The Hang Seng Hong Kong Stock Connect New Economy Index rose by 0.8%, while the Hang Seng Technology Index increased by 0.5% [1]. Group 1: Index Performance - The Hang Seng Hong Kong Stock Connect New Economy Index increased by 0.8% [1]. - The CSI Hong Kong Stock Connect Internet Index rose by 0.6% [1]. - The Hang Seng Technology Index saw a gain of 0.5% [1]. - The CSI Hong Kong Stock Connect Consumer Theme Index increased by 0.1% [1]. - The CSI Hong Kong Stock Connect Medical and Health Comprehensive Index decreased by 1.3% [1]. Group 2: Fund Flows - There has been a continuous inflow of funds into related ETFs, with the Hong Kong Stock Connect Internet ETF (513040) seeing a net inflow of 2.3 billion yuan this month [1]. - The Hang Seng Technology ETF (513010) recorded a net inflow of 1.1 billion yuan during the same period [1].
科技股走强,恒生科技指数涨超3%,恒生科技ETF易方达(513010)助力布局板块龙头
Mei Ri Jing Ji Xin Wen· 2025-10-20 11:33
Group 1 - The core viewpoint of the news is that Hong Kong's technology and internet stocks have rebounded significantly, with the Hang Seng Technology Index rising by 3.0% and the Hang Seng New Economy Index increasing by 2.9% [1] - The recent influx of capital into Hong Kong's technology-related ETFs is notable, with the E Fund Hang Seng Technology ETF (513010) attracting over 4 billion yuan in net inflows over the past month, ranking first among similar ETFs [1] - Other indices also showed positive performance, including the China Securities Hong Kong Internet Index up by 2.7% and the China Securities Hong Kong Consumption Theme Index up by 2.2% [1] Group 2 - The Hang Seng New Economy ETF tracks the largest 50 stocks in the "new economy" sector within the Hong Kong Stock Connect, primarily including information technology, consumer discretionary, and healthcare [2] - The rolling P/E ratio for the Hang Seng Technology ETF is reported at 22.1 times, with a valuation percentile of 24.1% since its inception in 2020 [2] - The China Securities Hong Kong Consumption Theme Index, which includes 50 major consumer stocks, has a rolling P/E ratio of 20.9 times and a valuation percentile of 16.1% since its launch in 2020 [3]

招银国际焦点股份-20251020
Zhao Yin Guo Ji· 2025-10-20 09:02
Group 1: Stock Recommendations - 吉利汽车 (Geely Auto) has a target price of HKD 32.00, with a current market value of USD 24.8 billion and a PE ratio of 19.01[5] - 零跑汽车 (Leap Motor) is rated as a buy with a target price of HKD 80.00, showing a potential upside of 35%[5] - 极兔速递 (J&T Express) has a target price of HKD 58.00, with a market value of USD 11.7 million and a PE ratio of 11.7[5] Group 2: Performance Overview - The basket of 25 stocks listed in the previous report had an average return of -3.9%, compared to the MSCI China Index return of -3.6%[10] - Out of the 25 stocks, 11 stocks outperformed the benchmark index[10] - The report includes a total of 25 long positions, indicating a diverse investment strategy[10]
抄底消费?先看懂这张“藏宝图”
雪球· 2025-10-20 08:12
Core Viewpoint - The article emphasizes the importance of understanding the long-term value of assets by aligning them with fundamental human needs, categorizing consumption into essential and discretionary segments, and highlighting the structural differences between A-shares and H-shares in the consumer sector [4][5]. Group 1: Consumer Sector Analysis - The consumer sector is divided into essential consumption, which includes food, beverages, and daily retail, and discretionary consumption, which includes appliances, automobiles, and tourism, with the former being more resilient to economic fluctuations [4]. - A-shares focus more on essential consumption and brand manufacturing, while H-shares have a higher weight in discretionary consumption and services, providing complementary investment opportunities [4][12]. Group 2: Key Consumer Indices - The article reviews ten key consumer indices in A/H shares, detailing their establishment dates, sample sizes, and average ROE, with the China Securities Consumer Index being a core index for essential consumption [6][7]. - The China Securities White Wine Index has a high ROE of 27.86%, indicating strong performance in the wine sector, while the Hang Seng Consumer Index has a significant focus on discretionary consumption, with 66.18% of its weight in this category [12][18]. Group 3: Valuation Comparisons - Current valuation data shows that the consumer sector is generally undervalued, with the China Securities Consumer Index having a PE of 19.30 and a PB of 4.33, indicating a historical low valuation range [14][16]. - The CS Food and Beverage Index has a low temperature of 8.6°C, suggesting it is also undervalued, while the Hang Seng Consumer Index has a high temperature of 52.1°C, indicating it may be overvalued [16][17]. Group 4: Investment Recommendations - For investors looking to focus on essential consumption, the China Securities Consumer Index is recommended, while those seeking exposure to discretionary consumption should consider the Consumer Leaders or CS Consumer 50 indices for a more diversified approach [20][22]. - The combination of the China Securities Consumer Index and the Hang Seng Consumer Index can effectively represent the overall trend of the Chinese consumer market, providing a balanced investment strategy [25].

全球宽松浪潮重启,谁是下一轮流动性修复的核心受益?
Sou Hu Cai Jing· 2025-10-20 03:31
Group 1: Core Insights - The global liquidity environment is becoming more accommodative, with the Federal Reserve signaling a policy shift that enhances expectations for improved dollar liquidity [1] - The Hang Seng China Enterprises Index and its corresponding ETF are becoming core assets as they reflect the profitability and industrial trends of mainland enterprises [1] Group 2: Overseas Liquidity - The Federal Reserve's shift towards easing is expected to relieve pressure on the liabilities of H-share ETFs, with Powell indicating a pause in balance sheet runoff and potential rate cuts [1][2] - The downward adjustment of discount rates will elevate the present value of future cash flows, leading to valuation recovery, particularly in sectors sensitive to liabilities like technology and consumer goods [2] Group 3: Fundamentals - The overall EPS forecast for the Hong Kong market shows signs of stabilization and recovery, with a 0.35% increase in the Hang Seng Index EPS forecast since September 26 [5] - The Hang Seng China Enterprises Index consists entirely of mainland enterprises, with major sectors including consumer discretionary (29.5%), information technology (25.2%), and financials (23.0%), reflecting structural trends in consumption recovery and manufacturing upgrades [5] Group 4: Capital Flows - There has been a noticeable increase in net inflows from southbound funds, with significant investments in consumer discretionary and financial sectors amounting to 923 million HKD and 233 million HKD respectively over the past 20 trading days [8] - The rising proportion of southbound capital in the Hong Kong Stock Exchange indicates a growing reallocation interest from mainland investors towards Hong Kong stocks [8] Group 5: Overall Market Outlook - The combination of the Federal Reserve's easing policies, improving dollar liquidity, and the recovery of mainland economic performance is providing strong support for the Hong Kong stock market [13] - The Hang Seng China Enterprises Index is expected to benefit significantly from the recovery of the mainland economy, with H-share ETFs being ideal tools for investors to capitalize on the liquidity recovery window [13]
