ETF基金
Search documents
Is WisdomTree U.S. Multifactor ETF (USMF) a Strong ETF Right Now?
ZACKS· 2025-11-04 12:21
Core Insights - The WisdomTree U.S. Multifactor ETF (USMF) is designed to provide broad exposure to the Style Box - All Cap Blend category and was launched on June 29, 2017 [1] - USMF is managed by WisdomTree and has accumulated over $379.17 million in assets, making it an average-sized ETF in its category [5] - The fund seeks to match the performance of the WisdomTree U.S. Multifactor Index, which includes 200 U.S. companies selected based on value, quality, momentum, and correlation factors [5] Fund Characteristics - USMF has an annual operating expense ratio of 0.28%, which is competitive within its peer group [6] - The fund offers a 12-month trailing dividend yield of 1.34% [6] - The top holding, Dreyfus Trsy Oblig Cash Mgmt Cl Ins, constitutes approximately 53.05% of the fund's total assets [7] - The top 10 holdings account for about 110.35% of total assets under management, indicating a concentration in these positions [8] Performance Metrics - Year-to-date, USMF has increased by approximately 3.3%, and it has risen about 5.42% over the last 12 months as of November 4, 2025 [9] - The fund has traded between $44.42 and $52.86 in the past 52 weeks [9] - USMF has a beta of 0.81 and a standard deviation of 12.98% over the trailing three-year period, indicating a lower risk profile compared to the market [10] Alternatives - Other ETFs in the Style Box - All Cap Blend segment include iShares Core S&P Total U.S. Stock Market ETF (ITOT) and Vanguard Total Stock Market ETF (VTI), with assets of $80.02 billion and $559.88 billion respectively [12] - Both ITOT and VTI have a lower expense ratio of 0.03%, making them attractive alternatives for cost-conscious investors [12]


红利国企ETF(510720)涨近1%,关注上市以来连续分红18个月的红利国企ETF
Mei Ri Jing Ji Xin Wen· 2025-11-04 06:08
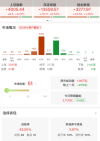
Group 1 - The core viewpoint indicates that in the short term, the dividend style configuration offers high cost-effectiveness during market fluctuations, while in the long term, policies such as the new "National Nine Articles" and market capitalization management encourage listed companies to distribute dividends [1] - For state-owned enterprises (SOEs), establishing a sound dividend policy and stabilizing dividend expectations can enhance investor returns and help SOEs gain value recognition and valuation recovery, aligning with the requirements of "Chinese-style valuation" [1] - The new "National Nine Articles" guidance, combined with the decline in risk-free yields, highlights the high allocation value of dividend assets [1] Group 2 - The Dividend State-Owned Enterprise ETF (510720) tracks the Shanghai Stock Exchange Dividend Index (000151), which selects stocks with high dividend characteristics, stable dividend performance, and good liquidity, primarily covering traditional sectors such as finance, energy, and industry [1] - The Dividend State-Owned Enterprise ETF (510720) has achieved monthly dividends since its listing, maintaining a continuous dividend distribution for 18 months, making it one of the few ETFs in the market to consistently distribute dividends since inception [1] - Investors are encouraged to consider buying on dips for the Dividend State-Owned Enterprise ETF (510720) due to its consistent performance [1]
ETF周报(20251027-20251031)-20251103
Mai Gao Zheng Quan· 2025-11-03 09:23
Market Overview - The performance of major indices during the sample period shows that Nikkei 225, CSI 1000, and CSI 500 had returns of 6.31%, 1.18%, and 1.00% respectively [1][10] - Among the Shenwan first-level industries, the top performers were electric power equipment, non-ferrous metals, and steel, with returns of 4.29%, 2.56%, and 2.55% respectively, while communication, beauty care, and banking lagged behind with returns of -3.59%, -2.21%, and -2.16% [1][15] ETF Product Overview ETF Market Performance - QDII ETFs had the best average performance with a weighted average return of 0.47%, while commodity ETFs had the worst performance with a return of -1.74% [19][20] - ETFs tracking Japanese and US stocks performed well, with average returns of 7.51% and 3.21% respectively, while those related to the STAR Market and the STAR 50 had poorer performances of -2.45% and -1.88% [19][20] ETF Fund Flow - The net inflow for broad-based ETFs was the highest at 156.53 billion, while money market ETFs saw the largest net outflow of -60.83 billion [2][24] - The CSI 300 ETF had the highest net inflow of 54.83 billion, while US stock ETFs experienced the largest net outflow of -18.08 billion [2][24] - The technology sector ETFs had the highest net inflow of 86.33 billion, while the cyclical sector ETFs had the lowest net inflow of -48.59 billion [2][26] ETF Trading Volume - Bond ETFs saw the highest increase in average daily trading volume, with a change rate of 6.57%, while commodity ETFs experienced the largest decrease at -12.10% [32][34] - US stock ETFs had the highest increase in average daily trading volume at 20.56%, while CSI 500 ETFs had the largest decrease at -23.09% [35][36] New ETF Issuance and Listings - During the sample period, a total of 8 new funds were established and 3 funds were listed [3]
关注均衡宽基配置机会,A500ETF易方达(159361)盘中净申购超1.3亿份
Mei Ri Jing Ji Xin Wen· 2025-11-03 04:42
Group 1 - The A-share market experienced fluctuations in the morning session, with coal, gaming, and media sectors leading in gains, while battery, precious metals, and semiconductor sectors saw declines [1] - As of 11:05, the CSI A500 index fell by 0.6%, and the A500 ETF from E Fund (159361) saw a net subscription exceeding 130 million units during the session, with over 1.3 billion yuan net inflow in the past 10 trading days [1] - Citic Securities noted that the current index level at 4000 points is significantly better than the same period in 2015, with a notably lower valuation level, suggesting that there is no need to overly focus on the index point itself [1] Group 2 - The CSI A500 index consists of 500 stocks with large market capitalization and good liquidity, covering 91 out of 93 sub-industries, reflecting the overall performance of representative companies in A-shares from a balanced industry perspective [2] - Emerging industries such as information technology, communication services, and healthcare have a higher weight in the index, catering to both "core assets" and "new productive forces" [2] - Investors looking for balanced broad-based investments can consider products like the A500 ETF from E Fund (159361) for allocation [2]
ETF市场日报 | 稀有金属相关ETF领涨!巴西ETF要来了
Sou Hu Cai Jing· 2025-10-30 07:37
Market Overview - The A-share market experienced a collective pullback, with the Shanghai Composite Index falling below the 4000-point mark, closing down by 0.73% [1] - The total trading volume in the Shanghai and Shenzhen markets reached 24,217 billion [1] Sector Performance - The rare metals sector led the gains, with several ETFs in this category showing positive performance, including a 2.77% increase in the Rare Metals ETF (159608) [2] - Conversely, the innovative drug sector saw significant declines, with the ChiNext 50 ETF (159371) dropping by 9.67% [4][5] Investment Trends - The 20th Central Committee's Fourth Plenary Session emphasized the development of future industries, including quantum technology, biomanufacturing, hydrogen energy, and nuclear fusion, positioning new materials as a key component in supporting sectors like new energy and low-altitude economy [3] - Battery manufacturers are benefiting from dual demand for power and energy storage, with production expected to increase by 10% month-on-month and over 35% year-on-year in October [3] ETF Activity - The Short-term Bond ETF (511360) had the highest trading volume at 372.75 billion [6] - The turnover rate was led by the China-Korea Semiconductor ETF (213310) at 148.58% [8] New ETF Launches - Two Brazilian ETFs, the Huaxia Brazil ETF (159100) and the E Fund Brazil ETF (520870), will begin fundraising, closely tracking the Ibovespa Index, which reflects Brazil's economic performance [9] - The Jiashi Hang Seng Index Hong Kong Stock Connect ETF (520960) is designed for investors looking to access core Hong Kong stocks efficiently [10]

Is Xtrackers Net Zero Pathway Paris Aligned US Equity ETF (USNZ) a Strong ETF Right Now?
ZACKS· 2025-10-29 11:21
Core Insights - The Xtrackers Net Zero Pathway Paris Aligned US Equity ETF (USNZ) launched on June 28, 2022, offers broad exposure to the Style Box - All Cap Blend category [1] - The fund is sponsored by Deutsche Bank Ag and has accumulated assets over $285.39 million, positioning it as an average-sized ETF in its category [5] - USNZ aims to match the performance of the SOLACTIVE ISS ESG US NT ZR PATHWY ENH ID index, which includes large and mid-cap companies meeting specific environmental, social, and governance criteria [5] Fund Characteristics - USNZ has an annual operating expense ratio of 0.10%, making it one of the least expensive options in the market [6] - The ETF has a 12-month trailing dividend yield of 1.02% [6] - The top three holdings are Microsoft Corp (8.67%), Apple Inc, and Nvidia Corp, with the top 10 holdings accounting for approximately 43.54% of total assets [7][8] Performance Metrics - The ETF has gained about 18.86% year-to-date and 18.14% over the past year as of October 29, 2025 [9] - USNZ has traded between $31.29 and $43.88 in the last 52 weeks [9] - The fund has a beta of 1.00 and a standard deviation of 15.86% over the trailing three-year period, indicating effective diversification of company-specific risk with around 318 holdings [10] Alternatives and Comparisons - Other ETFs in the space include Vanguard ESG U.S. Stock ETF (ESGV) and iShares ESG Aware MSCI USA ETF (ESGU), with assets of $11.95 billion and $15.27 billion respectively [12] - ESGV has an expense ratio of 0.09% while ESGU has a ratio of 0.15%, suggesting potential alternatives for cost-conscious investors [12]

创业50ETF(159682)涨1.54%,成分股阳光电源Q3净利润创新高,股价涨超6%
2 1 Shi Ji Jing Ji Bao Dao· 2025-10-29 05:17
Group 1 - The market experienced a morning rally on October 29, with the Shanghai Composite Index rising above 4000 points and the ChiNext Index increasing by over 2% at one point [1] - By the midday close, the Shanghai Composite Index rose by 0.37%, the Shenzhen Component Index increased by 0.9%, and the ChiNext Index gained 1.35% [1] - The total trading volume in the Shanghai and Shenzhen markets reached 1.42 trillion yuan, an increase of 719 billion yuan compared to the previous trading day [1] Group 2 - The Chuangye 50 ETF (159682) closed up 1.54% with a trading volume exceeding 200 million yuan [1] - Notable stocks within the ETF included Sanhuan Group, which rose over 9%, and Tonghuashun and Sunshine Power, both increasing by over 6% [1] - The Chuangye 50 ETF tracks the ChiNext 50 Index, with sector allocations including manufacturing, information transmission, software, and technology services [1] Group 3 - Sunshine Power released its Q3 2025 financial report on October 28, reporting total revenue of 66.4 billion yuan for the first three quarters, a year-on-year increase of 33% [1] - The net profit for the same period was 11.9 billion yuan, reflecting a year-on-year growth of 56% [1] - In Q3 alone, the company achieved revenue of 22.87 billion yuan, a year-on-year increase of 20.83%, with a net profit of 4.147 billion yuan, marking a 57.04% year-on-year growth and the highest quarterly net profit since its listing [1] Group 4 - CICC pointed out that the government has clearly defined the direction for wind and solar energy, accelerating the comprehensive green transformation of economic and social development [2] - The focus is on advancing pollution prevention and ecological system optimization while promoting the construction of a new energy system [2] - The government aims to steadily advance and achieve carbon peak targets [2]

ETF午评 | A股时隔十年重返4000点,AI硬件板块继续领涨云50ETF、创业板人工智能ETF涨2.6%,大数据ETF涨2%
Sou Hu Cai Jing· 2025-10-28 04:30
Market Performance - The Shanghai Composite Index rose by 0.21%, reaching 4005.44 points, marking a return above 4000 points for the first time in ten years [1] - The Shenzhen Component increased by 0.52%, while the ChiNext Index saw a rise of 1.35% [1] - The total trading volume in the Shanghai and Shenzhen markets was 135.95 billion yuan, a decrease of 21.65 billion yuan compared to the previous day [1] - Over 3000 stocks in the market experienced gains [1] Sector Performance - The Fujian Haixi sector saw a surge in stocks hitting the daily limit, with significant activity in Rubin concept stocks, fiberglass, CPO, and copper-clad laminate concepts [1] - The coal mining and processing, Shenzhen, precious metals, wind power equipment, beauty care, and steel sectors experienced the largest declines [1] ETF Performance - The AI hardware sector continued to lead gains, with the Xinhua Fund Cloud 50 ETF, Southern's and Huabao's entrepreneurial AI ETFs rising by 2.67%, 2.64%, and 2.62% respectively [3] - The software sector also showed positive performance, with Penghua Fund's big data ETF, Wanji Fund's software index ETF, and Huitianfu Fund's software 50 ETF increasing by 2.3%, 2.26%, and 2.26% respectively [3] Precious Metals and Materials - The precious metals sector faced significant declines, with gold stock ETFs and related funds dropping by 2.5% [4] - The non-ferrous metals sector followed suit, with mining ETFs and industrial non-ferrous ETFs decreasing by 1.53% and 1.45% respectively [4]
只差临门一脚!沪指冲刺4000点,你的账户跑赢指数了吗?ETF助力把握大行情!
Sou Hu Cai Jing· 2025-10-28 02:23
Market Overview - The A-share market experienced a strong upward trend, with the Shanghai Composite Index approaching 4000 points, closing up 1.18%, marking a 10-year high [1] - The recent strength in the index is attributed to favorable macro policies announced on October 23, which are expected to provide clearer market direction and facilitate a rally [1][3] External Factors - Short-term external risks have eased, boosting market risk appetite. Recent economic discussions between China and the U.S. in Malaysia resulted in constructive exchanges on key trade issues, including maritime logistics and tariff suspensions [3] Market Dynamics - Despite the index reaching a new high, nearly 70% of individual stocks underperformed the Shanghai Composite Index, leading to investor concerns about the disparity between index performance and individual stock gains [4] - The market is characterized by a structural trend where quality stocks are favored, resulting in a more concentrated performance rather than a broad market rally [4][6] Investment Strategies - Given the challenges for individual investors to outperform the index, especially for newcomers lacking experience, investing in index ETFs is recommended as a more effective strategy [6][7] - ETFs provide lower investment thresholds, high liquidity, and the ability to trade throughout the day, enhancing capital efficiency [7] Notable ETFs - The ChiNext 50 Index ETF (588870) has shown a cumulative increase of 50.08% year-to-date, outperforming 74% of its constituent stocks, with a low fee rate of 0.15% [8] - The MSCI China A50 ETF (560050) has achieved a year-to-date increase of 25.5%, outperforming 76% of its constituent stocks, providing a solution for investors looking to access leading Chinese assets [9] - The CSI A500 Index ETF (563880) has recorded a year-to-date increase of 22.78%, outperforming 60% of its constituent stocks, while maintaining a lower volatility compared to 94% of its peers [11] Sector Performance - Key sectors such as cloud computing, semiconductor, and battery industries are highlighted as areas of potential growth, driven by technological advancements and market trends [11][12][13] - The Cloud Computing ETF (159273) has outperformed 92% of its constituent stocks, while the Semiconductor ETF (588750) has shown a 66.5% increase, outperforming 74% of its peers [12][13]
科技成长类ETF本周普遍上行 黄金相关ETF跌幅较前
Sou Hu Cai Jing· 2025-10-26 10:58
Market Performance - The A-share market experienced a strong upward trend this week, with the technology growth sector outperforming [1] - According to Go-Goal ETF data, technology-related ETFs, particularly in artificial intelligence and communication sectors, saw significant gains, with most rising over 12% [1] ETF Performance - The top-performing ETFs included: - Southern China A-share AI ETF, up 13.98% with a latest scale of 272 million [2] - Huabao A-share AI ETF, up 13.77% with a scale of 3.49 billion [2] - Huaxia A-share AI ETF, up 13.71% with a scale of 637 million [2] - Communication ETF, up 13.57% with a scale of 9.64 billion [2] - Conversely, gold-related ETFs experienced the largest declines [1] Fund Flows - The overall net inflow in the ETF market was 12.923 billion, with stock ETFs seeing a net outflow of 30.676 billion [2] - Cross-border ETFs, money market ETFs, and commodity ETFs recorded net inflows of 9.127 billion, 13.754 billion, and 15.348 billion respectively [2] Upcoming ETFs - Six new ETFs are set to be issued next week, including Hong Kong stock information technology ETF and Hong Kong stock technology ETF [3] - One ETF, the Shanghai 180 ETF, is scheduled to be listed next week [4]
