钢铁
Search documents
A股开盘速递 | A股窄幅震荡!油气等资源股延续强势 贵金属人气股斩获5连板
智通财经网· 2026-01-29 01:56
1月29日,A股早盘窄幅震荡,截至9:40,沪指跌0.04%,深成指涨0.22%,创业板指上涨0.34%。 盘面上,黄金等有色金属概念股延续强势,白银有色斩获8连板,中国黄金5连板,四川黄金4连板;油 气等资源股延续活跃,石化油服2连板。下跌方面,军工、半导体、医药等方向跌幅居前。 展望后市,兴业证券认为,虽然行情节奏趋缓,但向上趋势仍在延续,并且结构上赚钱效应正在朝着更 广的范围扩散。 热门板块 1、黄金概念延续强势 油气等资源股延续活跃,石化油服2连板,通源石油、洲际油气、准油股份、中国海油、中曼石油、科 力股份跟涨。 点评:消息面上,中东地区紧张态势升级,成为本轮油价上涨的主力推手。据证券时报,有分析称,近 期地缘政治紧张与美国极端寒潮共同冲击全球能源与化工品供给,导致油价淡季反弹,并可能引发部分 化工品供应短缺,为价格提供支撑。 机构观点 1、兴业证券:虽然行情节奏趋缓,但向上趋势仍在延续 兴业证券认为,虽然行情节奏趋缓,但向上趋势仍在延续,并且结构上赚钱效应正在朝着更广的范围扩 散。配置方面,随着A股上市公司年报预告进入披露高峰,叠加北美科技巨头财报集中披露,业绩对于 结构的影响或将更加显著,继续聚 ...
散户认购越积极,亏损概率越大?ETF新老赛道建仓策略分化
券商中国· 2025-11-24 03:57
Core Insights - The article discusses the significant divergence in ETF (Exchange-Traded Fund) building strategies amid rising risk aversion, highlighting the differences in institutional participation and stock coverage speed between traditional and emerging ETF sectors [1][2]. ETF Building Strategies - There is a notable disparity in the building pace of new ETFs, with traditional sector ETFs seeing higher institutional participation and faster stock coverage compared to previously popular sectors that now have a higher retail investor ratio and cautious institutional involvement [1][2]. - The newly launched Penghua Hang Seng Biotechnology ETF has a staggering 97.08% retail investor participation, with only about 3% held by institutional investors, and a cautious stock position of less than 2% as of November 20 [2]. Performance of Different Sectors - Some sectors that have not performed well this year are becoming targets for new ETF investments, such as the Bosera National Industrial Software ETF, which achieved a stock position of 47% just a week before its launch [3]. - The article notes that the first major holding of the Bosera ETF, BGI Genomics, has seen a year-to-date decline of approximately 16% [3]. Lessons from Previous ETF Launches - The cautious approach in the biotechnology sector may stem from past experiences where high retail participation led to poor performance, as seen with earlier launched biotechnology ETFs that have not generated positive returns [4][5]. - The article highlights that the Huatai-PineBridge Hang Seng Biotechnology ETF, despite being launched in a hot market, has lost 15% of its value within two months, indicating that high initial enthusiasm can serve as a contrary indicator [5]. Shift in Investment Focus - As the year-end approaches, there is a shift in focus towards traditional low-position industries, with some fund companies suggesting a cautious approach to high-position sectors [6]. - The market is showing a preference for traditional sectors like electricity, coal, and steel, while technology sectors are being overlooked, reflecting a demand for safer investments [6]. Future Market Outlook - The article suggests that for the market to continue its upward trend, macro policies and industrial logic need to align, particularly in emerging tech industries like AI and robotics, which are at a critical commercialization phase [7]. - The potential for systemic revaluation in traditional economic sectors is highlighted, contingent on supportive policies from both supply and demand sides [7].


午评:沪指跌0.56% 半导体板块逆势走高
Zheng Quan Shi Bao Wang· 2025-11-18 03:46
Core Viewpoint - A-shares experienced a collective decline in the morning session, with the Shanghai Composite Index down by 0.56%, Shenzhen Component Index down by 0.43%, and ChiNext Index also down by 0.43% [1] Market Performance - The semiconductor sector showed resilience, with Jingyi Equipment rising over 12% [1] - The power battery sector faced significant losses, with Shida Shenghua hitting the daily limit down [1] - Sectors such as internet celebrity economy, software development, CPO, and engineering machinery saw notable gains [1] - Conversely, solid-state batteries, energy storage, phosphorus chemical, fluorochemical, real estate, coal, and steel sectors experienced the largest declines [1] Trading Volume - The total market turnover reached nearly 1.3 trillion yuan, an increase of over 10 billion yuan compared to the previous trading day [1] - More than 4,000 stocks declined during the session [1]
中信建投:市场或继续维持震荡轮动状态
Zheng Quan Shi Bao Wang· 2025-11-16 23:53
Group 1 - The core viewpoint of the article is that after the improvement in China-US relations, market risk appetite has decreased, leading to fluctuations around the 4000-point mark for the Shanghai Composite Index [1] - The average trading volume for the entire A-share market has decreased to around 2 trillion yuan [1] - Recent capital flows have been active in thematic investments and sectors with growth potential, indicating a shift in market focus [1] Group 2 - The market is expected to continue its oscillating and rotating characteristics, with the key to breaking the current state lying in capital attacking new main lines [1] - The mid-term allocation strategy suggested is to adopt a balanced approach, focusing on clear growth signals without excessive switching [1] - Key sectors to watch include dividends, new chemical materials, superhard materials, lithium battery materials, steel, agriculture, forestry, animal husbandry, batteries, and AI [1]
热点追踪周报:由创新高个股看市场投资热点(第218期)-20251107
Guoxin Securities· 2025-11-07 11:32
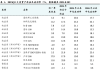
- The report introduces a quantitative model called "250-day new high distance" to track market trends and identify investment hotspots. The model is based on the idea that stocks nearing their 52-week high tend to outperform those far from their 52-week high, as supported by research from [George@2004] and other experts[11][18]. The formula for calculating the 250-day new high distance is: $ 250 \text{ day new high distance} = 1 - \frac{\text{Close}_{t}}{\text{ts\_max(Close, 250)}} $ where $\text{Close}_{t}$ represents the latest closing price, and $\text{ts\_max(Close, 250)}$ is the maximum closing price over the past 250 trading days. If the latest closing price reaches a new high, the distance is 0; otherwise, it is a positive value indicating the degree of decline from the high[11] - The report evaluates the model positively, highlighting its effectiveness in identifying market trends and leading stocks that drive market cycles[11][18] - The report also introduces a factor-based screening method for "stable new high stocks" using criteria such as analyst attention, relative stock strength, price path smoothness, and new high sustainability. The screening process includes: 1. Analyst attention: At least 5 buy or overweight ratings in the past 3 months 2. Relative stock strength: Top 20% of market-wide 250-day price change 3. Price path smoothness: Evaluated using metrics like absolute value of price changes over the past 120 days and cumulative absolute price changes over the same period 4. New high sustainability: Average 250-day new high distance over the past 120 days 5. Trend continuation: Average 250-day new high distance over the past 5 days[25][27] - The report positively evaluates the factor-based screening method, citing research that smooth price paths and sustained momentum are associated with stronger returns[25][27] --- - The backtesting results for the "250-day new high distance" model show that as of November 7, 2025, major indices such as the Shanghai Composite Index, Shenzhen Component Index, CSI 300, CSI 500, CSI 1000, CSI 2000, ChiNext Index, and STAR 50 Index have respective 250-day new high distances of 0.47%, 2.34%, 1.45%, 2.93%, 1.39%, 1.36%, 3.49%, and 8.02%[2][12][32] - The backtesting results for the "stable new high stocks" factor show that 50 stocks were selected based on the screening criteria. Among these, the cyclical and technology sectors had the highest number of stocks, with 21 and 16 stocks respectively. Within the cyclical sector, the non-ferrous metals industry had the most new high stocks, while the electric equipment and new energy industry led the technology sector[3][28][33]
收评:沪指放量涨0.97% 半导体、磷化工板块大涨
Zheng Quan Shi Bao Wang· 2025-11-06 07:09
Market Performance - A-shares experienced a strong opening and closing, with the Shanghai Composite Index surpassing 4000 points, closing up 0.97% [1] - The Shenzhen Component Index rose by 1.73%, while the ChiNext Index increased by 1.84%, and the Sci-Tech 50 Index surged by 3.34% [1] - Over 2800 stocks in the market saw gains, with total trading volume exceeding 2 trillion yuan [1] Sector Highlights - The phosphate chemical sector saw significant gains, with stocks like Qing Shui Yuan, Ba Tian Co., and Yun Tian Hua hitting the daily limit [1] - The semiconductor sector also performed well, with stocks such as Deming Li reaching the daily limit and Han Wu Ji rising over 9% [1] - The humanoid robot concept was active, with stocks like Wan Xiang Qian Chao and Fang Zheng Electric hitting the daily limit [1] - Apple-related stocks rose in the afternoon, with Dongshan Precision hitting the daily limit and Lens Technology increasing over 9% [1] Declines - The media and entertainment sector faced adjustments, with Yue Media hitting the daily limit down [1] - Other sectors that saw declines included CPO concepts, non-ferrous metals, Hainan Free Trade, duty-free concepts, and tourism [1]
2025年第四季度大类资产配置
Sou Hu Cai Jing· 2025-10-17 00:37
Core Insights - The asset allocation performance for Q3 2025 showed positive returns across all risk profiles, with the aggressive portfolio achieving the highest return of 12.50% [1][7][10] - The analysis indicates that equity and gold contributed significantly to the overall positive performance, while bonds experienced negative returns [10][12] Asset Performance Summary - In Q3 2025, the A-share market outperformed with a 17.9% increase in the CSI 300 index, while the Hang Seng Index rose by 11.6% [5][6] - The U.S. stock market also saw gains, with the Nasdaq leading at 11.2% [5][6] - Gold prices increased by 16.8%, driven by multiple favorable factors including high inflation and a renewed interest in gold as a safe haven [5][6] - Conversely, the oil market faced challenges, with WTI crude oil prices declining by 2.9% due to weak demand and increased production [5][6] Risk and Return Analysis - The annualized volatility for the conservative to aggressive portfolios ranged from 1.78% to 10.27%, with maximum drawdowns between -0.39% and -3.35% [7][9] - The aggressive portfolio's performance lagged behind the CSI 300 ETF by 6.56 percentage points but outperformed the 10-year government bond by 13.17 percentage points [7][8] Investment Strategy and Asset Selection - The recommended ETFs for various portfolios include Huatai-PB CSI 300 ETF, Huaxia Hang Seng Technology ETF, and others, with specific weightings for equity, bonds, and commodities [3][12][13] - The conservative portfolio allocated 10.16% to equities, 70.01% to bonds, and 4.82% to commodities, while the aggressive portfolio allocated 57.44% to equities [3][12][13] Future Outlook - For Q4 2025, the expected asset performance ranking is: Hong Kong stocks > A-shares > gold > U.S. stocks > U.S. bonds > domestic bonds > oil [19][21] - The focus for investment will be on sectors aligned with the "14th Five-Year Plan" and "anti-involution" policies, particularly in AI, robotics, new energy, and metals [18][21]
资讯日报:美股甲骨文大涨36%收于纪录新高-20250911
Guoxin Securities Hongkong· 2025-09-11 04:19
Market Performance - The Hang Seng Technology Index closed at 5902.69, up 1.27% for the day and 31.15% year-to-date[3] - The S&P 500 Index closed at 6512.61, up 0.30% for the day and 10.25% year-to-date[3] - Oracle's stock surged 36% to a record high, with a market capitalization increase of approximately $250 billion, reaching $922.24 billion[9] Sector Highlights - Major technology stocks in Hong Kong saw significant gains, with JD.com up 3.6% and Baidu up over 2%[9] - Financial stocks also performed well, with Agricultural Bank rising 3.5% and China Construction Bank up 2.84%[9] - Semiconductor stocks were active, with SMIC gaining 3.6%[9] Economic Indicators - The U.S. Producer Price Index (PPI) unexpectedly fell by 0.1% month-over-month in August, marking the first decline in four months, strengthening the case for potential interest rate cuts by the Federal Reserve[9] - Japan's manufacturing sentiment index rose to 13, the highest in three years, indicating improved economic confidence[14] Investment Trends - Net inflows from mainland investors into Hong Kong stocks amounted to HKD 7.566 billion on September 10[9] - AI infrastructure stocks like CoreWeave rose by 16.88%, reflecting growing investor interest in the sector[9]
股指期货热点:当下股指衍生品交易该如何抉择?
Nan Hua Qi Huo· 2025-08-29 07:06
Report Industry Investment Rating - Not provided Core Viewpoints - The recent stock market rally is driven by funds, sentiment, and structural benefits, forming a positive cycle where increased funds lead to higher trading volumes and greater upward momentum. However, there is a risk of a callback, and key indicators to watch for a shift in sentiment include a contraction in trading volume, a decline in basis, and a drop in implied volatility of options. Currently, trading volume remains around 3 trillion, and while optimism persists, risk management is necessary for single - sided long positions in futures. [1] - The market sentiment is generally positive, and after mid - August, optimism about the long - term stock market trend has increased. Strategies should be mainly long - oriented, but attention should be paid to key indicators for sentiment changes. In terms of style, weight - based stocks are showing advantages, and different trading strategies are recommended for different scenarios. [24] Summary by Directory 1. Recent Stock Market Trend Analysis - Since April, the stock index has shown an overall oscillating upward trend. After the sharp decline in April, the trading volume of broad - based indices gradually returned to normal with the entry of the national team. The rapid upward movement since late June is due to the easing of the Middle - East situation and various structural benefits. From June 20th to now, sectors such as TMT, new energy, non - banking finance, and steel have seen significant gains. [2] - The current rally is driven by the support of the national team, the release of structural benefits, positive sentiment, and the influx of funds. The trading volume of the two markets has climbed from around 1 trillion to about 3.1 trillion, approaching the high of last year. The proportion of margin trading in the total trading volume has also increased from about 8% to around 11.6%. [2] - In terms of stock index style, due to the influx of funds, small - cap stocks represented by the CSI 1000 are stronger as both hot money and leveraged funds prefer small - cap stocks with high elasticity and the support of technology concepts. [3] 2. Futures Index Observation and Analysis - With the rise of the stock market and the strong performance of small - cap stocks, the futures index has the following changes: the inter - period spread (next - quarter - current month) first dropped significantly and then rose rapidly; small - cap futures index IM has shown better performance, but there are signs of a recent style shift; the basis of the futures index has generally increased. [8] - The inter - period spread has not deviated from its operating rules. The stronger performance of the far - month contracts since mid - August may reflect an optimistic shift in market expectations for the far - term trend, influenced by factors such as the rebound from low spreads and the change in market expectations from short - term to long - term. Additionally, arbitrage trading at low spread levels has also contributed to the spread rebound. [8][9] - In terms of cross - varieties, small - and medium - cap futures indices have been stronger during the rally, but there are signs of a style shift since the end of August. This may be due to low - point arbitrage trading, the high valuation of small - cap stocks leading to a potential shift of funds to weight - based stocks, and the heavy trading of weight - based stocks in broad - based indices. [15][16] - The basis of the futures index has been rising due to positive sentiment and is currently at a high level for the year. Although there is still room for growth compared to last year's high, considering the low starting point and significant increase, there is a need to be vigilant about a cooling of sentiment. [18] 3. Stock Index Option Observation and Analysis - The implied volatility of options has increased significantly since mid - August, indicating that the market's long - term expectations have deviated from the previous consensus, and optimism about the long - term trend has increased. The stock index has also made breakthroughs, which may have attracted more funds and boosted sentiment. Currently, the implied volatility of stock index options is at a relatively high - middle level in history with room for further increase. [22] 4. Strategy Recommendations - In terms of futures, single - sided long positions should be held with risk management. In terms of style, it is recommended to focus on IF, but if the Fed cuts interest rates in September and liquidity expectations rise, small - cap stocks may show advantages again, and a temporary shift to IM can be considered. For long - term holding, IF is still recommended. Cross - variety arbitrage can focus on long IF and short IM, especially when the spread is at a low level. In terms of inter - period trading, follow the long - term rule of negative correlation between the stock market and the inter - period spread, and take the opportunity to short far - month contracts and long near - month contracts when the two show positive correlation. [24] - For options, due to the high uncertainty of the stock index trend and implied volatility, it is recommended to combine with spot trading, mainly using the insurance strategy (spot + buying put options) to obtain stock market gains while avoiding the risk of a market decline. [25]
科技LOF: 鹏华中证沪港深科技龙头指数证券投资基金(LOF)2025年中期报告
Zheng Quan Zhi Xing· 2025-08-27 15:17
Core Viewpoint - The report provides an overview of the performance and management of the Penghua CSI Hong Kong-Shenzhen Technology Leaders Index Securities Investment Fund (LOF) for the first half of 2025, highlighting its investment strategy, financial performance, and market conditions affecting the fund [1][8]. Fund Overview - Fund Name: Penghua CSI Hong Kong-Shenzhen Technology Leaders Index Securities Investment Fund (LOF) [1] - Fund Management Company: Penghua Fund Management Co., Ltd. [1] - Fund Custodian: China Merchants Bank Co., Ltd. [1] - Fund Operation Type: Listed open-ended fund (LOF) [1] - Fund Contract Effective Date: December 7, 2021 [1] - Total Fund Shares at Period End: 53,449,959.75 shares [1] Investment Objectives and Strategies - The fund aims to closely track the benchmark index, minimizing tracking deviation and error, with daily tracking deviation controlled within 0.35% and annual tracking error within 4% [1][2]. - The fund employs a passive index investment strategy, constructing an investment portfolio based on the benchmark weights of constituent stocks [2][3]. Financial Performance - The fund's A share net value growth rate for the reporting period was 12.79%, while the benchmark growth rate was 11.72% [9]. - The C share net value growth rate was 12.68%, and the I share net value growth rate was 12.58%, both outperforming the benchmark [9]. - The fund's total net asset value at the end of the reporting period was 0.9192 RMB for A shares, 0.9075 RMB for C shares, and 1.1168 RMB for I shares [10][12]. Market Conditions - The report notes that the A-share and Hong Kong stock markets experienced fluctuations due to global uncertainties, particularly trade tensions, but showed resilience overall [9][10]. - The technology sector was highlighted as a key area of focus, with significant interest in artificial intelligence, innovative pharmaceuticals, and other high-growth industries [10]. Risk Management and Compliance - The fund management strictly adheres to legal regulations and the fund contract, ensuring compliance and risk management throughout the reporting period [7][12]. - The fund has mechanisms in place to monitor and control risks associated with investment strategies and market conditions [11].
