红利指数
Search documents
每日钉一下(红利指数演化的两个方向)
银行螺丝钉· 2025-11-11 14:04
Group 1 - The article discusses the importance of smart investment strategies for mutual fund regular investment, emphasizing the need for preparation and planning before starting [2][3] - It introduces four methods of regular investment and highlights the significance of setting a clear profit-taking strategy [2] - A free course is offered to help individuals understand these investment strategies better, including course notes and mind maps for efficient learning [2][3] Group 2 - The article explains the evolution of dividend indices, originating from the "Dogs of the Dow" strategy, which focuses on selecting stocks with high dividend yields [5][6] - The initial dividend indices, such as the Shanghai Dividend Index and the CSI Dividend Index, were based on the core principle of selecting stocks according to their dividend yield [6] - The article outlines two main directions of evolution for dividend indices: pursuing dividend stability and seeking lower market volatility [8][14] Group 3 - The first evolution direction focuses on dividend stability, which can be further divided into categories such as selecting industry leaders with strong competitive advantages and high return on equity (ROE) companies [10][12] - The second evolution direction aims for lower market volatility, suggesting that investors prefer stable returns with less price fluctuation [14][15] - The combination of pursuing dividend stability and lower price volatility has led to the creation of various low-volatility dividend indices [15][16]


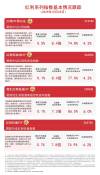
华宝全息图 | 红利指数股息率、债息、现金流,一图速览 (2025年11月)
Xin Lang Ji Jin· 2025-11-11 10:00
Group 1 - The article discusses various dividend yields of different indices, highlighting the performance of specific ETFs and their respective dividend rates [1][2][3] - The S&P Hong Kong Stock Connect Low Volatility Dividend ETF has a dividend yield of 5.54%, while the S&P China A-Share Dividend Opportunity Index shows a yield of 4.92% [1] - The China Securities A500 Low Volatility Dividend Index has a dividend yield of 4.18%, indicating a competitive return compared to other indices [1][3] Group 2 - The Shanghai Composite 180 Value Index has a dividend yield of 4.15%, and the CSI 800 Low Volatility Dividend Index yields 4.14% [3] - The 5-year Loan Prime Rate (LPR) is at 3.50%, while the 1-year LPR is at 3.00%, reflecting the current interest rate environment [3] - The article also mentions various bond yields, including the 10-year government bond yield at 1.80% and the AAA-rated corporate bond yield at 1.96% [3]

每日钉一下(什么是红利指数呢?)
银行螺丝钉· 2025-11-05 14:03
Group 1 - Funds are suitable investment products for ordinary people [2] - New investors should consider what type of funds are appropriate for them [2] - There is a free course available to help new investors understand fund investment from scratch [2] Group 2 - Dividend indices are a common type of strategy index [5] - Strategy indices are based on specific investment strategies and cover a wide range of industries [6] - There are four main types of indices: broad-based indices, strategy indices, industry indices, and thematic indices [6] Group 3 - The core strategy of dividend indices is to select stocks with high dividend yields [8] - Dividend yield is calculated by dividing the total cash dividends by the company's market capitalization [8] - For example, a company with a market cap of 10 billion and annual dividends of 500 million has a dividend yield of 5% [8]

Q3分红潮来临,A、H股两大红利ETF备受关注
Sou Hu Cai Jing· 2025-11-04 09:08
Core Viewpoint - After the third quarter, the dividend index sector, characterized by low valuations and high dividends, has begun to rise. The market's trading logic is shifting from profit improvement expectations to verification of profit improvements, indicating a potential style switch in the market. However, November is a policy and performance gap period, which may accelerate market rotation, raising questions about the attractiveness of dividends [1][2]. Summary by Sections Dividend Payout Increase - As of October 31, a total of 1,033 listed companies have announced cash dividend plans for the first, second, and third quarters, an increase of 141 companies compared to the same period last year. Among these, 38 companies have made multiple dividend distributions [1]. - The total cash dividend amount across the market is 734.9 billion yuan, with 89 companies distributing over 1 billion yuan within the year, indicating a significant increase in both the amount and frequency of dividends [1]. Strong Performance of Dividend Sectors - In a volatile market environment, high dividend assets are becoming a choice for funds seeking "risk aversion + yield," supported by stable cash flows and low valuations. Additionally, the increase in dividend repurchases by listed companies further enhances the attractiveness of dividend assets [2]. Low-Interest Rate Environment - In recent years, the central bank has frequently implemented interest rate cuts, leading to a decline in deposit rates. This has reduced the appeal of traditional savings. Currently, dividend indices have a dividend yield of over 4%, making high dividend assets attractive in the context of economic restructuring and high household savings-to-loan ratios [5]. - Institutional funds have begun to increase their holdings in bank shares, with a total increase of 8.36 billion shares in the third quarter, primarily in Postal Savings Bank, Nanjing Bank, and Changshu Bank [5]. Investment Strategies - For investors seeking stable returns and lower volatility, now is an appropriate time to maintain a dividend investment strategy. Investing in dividend ETFs provides a convenient way to access low valuation and high dividend assets [6]. - Notable A-share dividend ETFs include E Fund Dividend ETF (code: 515180), Low Volatility Dividend ETF (code: 563020), and Value Dividend ETF (code: 563700). For Hong Kong stocks, the Hang Seng Low Volatility Dividend ETF (code: 159545) is highlighted [6].

每日钉一下(为啥有的红利指数百分位位置比较高但还在低估呢?)
银行螺丝钉· 2025-10-31 13:56
Core Viewpoint - The article discusses the reasons behind the discrepancies in dividend indices' percentile rankings and their valuation, emphasizing that percentile data serves as a reference rather than a definitive measure of value [2][3]. Group 1: Changes in Dividend Index Rules - The dividend index rules have undergone significant changes over the past decade, impacting the percentile rankings and valuations of stocks within these indices [5]. - The first major change occurred in 2013, where the selection method shifted from "dividend yield stock selection, market capitalization weighting" to "dividend yield stock selection, dividend yield weighting," leading to a more balanced representation across sectors [6]. - A second major adjustment took place around 2022, increasing the requirements for sample stocks regarding dividend stability and continuity, influenced partly by the issues faced by real estate companies [7]. Group 2: Impact of Real Estate Sector on Dividend Indices - The real estate sector's practices of high short-term dividends led to inflated dividend yields, which were unsustainable and resulted in significant losses when these companies faced financial difficulties [8]. - Following the rule changes, the requirement for consistent high dividends has mitigated the issues previously caused by real estate stocks, leading to an overall improvement in the valuation metrics of the dividend indices [9]. Group 3: Interpretation of Percentile Data - Percentile data should be viewed as a tool for identifying anomalies rather than a sole basis for investment decisions, as extreme percentile values may indicate underlying issues worth investigating [10].

红利指数集体上涨,红利ETF易方达等产品连续多日获资金加仓
Sou Hu Cai Jing· 2025-10-23 05:21
Group 1 - The coal sector experienced a surge, leading to significant gains in transportation and banking sectors, which contributed to an increase in dividend indices, with the CSI Dividend Value Index rising by 0.7% and the CSI Dividend Index by 0.5% as of midday [1] - The Wind data indicates that the E Fund Dividend ETF (515180) has seen a net inflow of over 300 million yuan over the past three days [1] - The composition of high dividend stocks includes those with moderate payout ratios, positive growth in earnings per share, and high dividend yields with low volatility, with banking, transportation, and construction sectors accounting for over 65% [4] Group 2 - The Hang Seng Dividend Low Volatility ETF tracks a selection of 50 stocks within the Hong Kong Stock Connect that have good liquidity, continuous dividends, moderate payout ratios, and low volatility, reflecting high dividend levels and low volatility in the overall performance of these companies, with financial, industrial, and energy sectors making up over 65% [8] - The CSI Dividend Value ETF tracks the CSI Dividend Value Index, which consists of 50 stocks characterized by high dividend yields [10]
市场缩量调整,红利指数一枝独秀
Mei Ri Jing Ji Xin Wen· 2025-10-22 04:22
Core Viewpoint - The A-share market is experiencing a broad decline in core indices, with only a few dividend indices showing positive performance, indicating a shift in market sentiment towards low-volatility, high-dividend assets [1] Market Performance - The overall market has seen reduced trading volume, continuing the trend of last week's volume contraction, which was characterized by widespread declines in major indices [1] - Last week, the banking and coal indices ranked among the top eight in terms of returns, contrasting sharply with previously leading sectors such as copper, nickel, and lithium battery materials, reflecting a market style shift from high-growth to stable income [1] Investment Trends - During periods of market volume contraction, there is a tendency for funds to migrate towards low-volatility and high-dividend assets, which has led to the outperformance of dividend indices [1] - The dividend low-volatility ETF (159547) tracks the CSI Dividend Low Volatility Index and has the lowest fee rate among all ETFs in the market, making it suitable for long-term core allocation [1]
公募基金周报(20251013-20251017)-20251020
Mai Gao Zheng Quan· 2025-10-20 11:49
Report Industry Investment Rating - Not provided in the content Core Viewpoints - This week, the A-share market adjusted with shrinking volume. Mid-cap stocks had a large correction, while banks and insurance in the large financial sector performed well. The precious metal prices continued to rise, and the prices of London gold and London silver both reached record highs. The trading volume of the two markets decreased, and liquidity continued to shrink. The report suggests paying attention to the structural opportunities brought by the marginal changes in capital flow and optimizing positions in precious metals opportunistically [1][10][15] Summary by Directory 1. This Week's Market Review 1.1 Industry Index - Only the banking, coal, food and beverage, and transportation sectors rose this week, with a significant increase in the weekly trading volume proportion compared to last week. The media sector's trading activity decreased significantly. The non-ferrous metals sector, which was strong in the past 3 months, fell 2.91% this week, but its trading volume proportion increased to a four - week high of 8.27%. The neutral hedge fund's average and median absolute returns were -0.12% and -0.06% respectively [10] 1.2 Market Style - The growth style index significantly corrected by 5.82% this week, and its trading volume proportion dropped to a four - week low of 56.25%. The consumer style index fell 1.31%, and its trading volume proportion rose to a four - week high of 9.49%. The financial style index rose 1.57%, and its trading volume proportion slightly increased to 6.74%. The cyclical style index fell 3.78%, and its trading volume proportion was at a four - week high of 23.55%. The stable style index slightly fell 0.52%, and its trading volume proportion was at a four - week high of 3.97%. Mid - cap stocks had a larger decline, with the CSI 500 index falling 5.17% and its trading volume proportion dropping to a four - week low of 19.30%, while the Shanghai and Shenzhen 300 index fell 2.22%, and its trading volume proportion dropped to 30.09% [14] 2. Active Equity Funds 2.1 Funds with Excellent Performance in Different Theme Tracks This Week - Single - track funds are those with a position in a certain sector greater than 70% for multiple consecutive periods, and double - track funds are those with positions in two sectors both greater than 30% for multiple consecutive periods. The report lists the top five funds in different theme tracks such as TMT, financial real estate, consumption, medicine, manufacturing, and cyclical sectors [19][20] 2.2 Funds with Excellent Performance in Different Strategy Classifications - The funds are divided into deep - undervalued, high - growth, high - quality, quality - growth, quality - undervalued, GARP, and balanced - cost - effective types. The report lists the funds with relatively excellent performance in different types of funds this week [21] 3. Index - Enhanced Funds 3.1 This Week's Excess Return Distribution of Index - Enhanced Funds - The average and median excess returns of CSI 300 index - enhanced funds were 0.10% and 0.12% respectively; those of CSI 500 index - enhanced funds were 0.81% and 0.75% respectively; those of CSI 1000 index - enhanced funds were 0.57% and 0.60% respectively; those of CSI 2000 index - enhanced funds were 0.47% and 0.70% respectively; those of CSI A500 index - enhanced funds were 0.36% and 0.39% respectively; those of ChiNext index - enhanced funds were 0.64% and 0.80% respectively; and those of Science and Technology Innovation and Entrepreneurship 50 index - enhanced funds were 0.27% and 0.25% respectively. The average and median absolute returns of neutral hedge funds were -0.12% and -0.06% respectively, and those of quantitative long - only funds were -3.25% and -3.43% respectively [24][26] 4. This Week's High - Frequency Position Detection of Funds - In the past week, active equity funds significantly increased their positions in the computer (0.44%), electronics (0.31%), and non - ferrous metals (0.19%) industries; and significantly reduced their positions in the non - banking financial (0.17%), banking (0.14%), and automobile (0.13%) industries. From a one - month perspective, the positions in the computer (1.65%) and electronics (0.84%) industries increased significantly, while the position in the pharmaceutical (0.51%) industry decreased significantly [3][42]
每日钉一下(红利指数中经常会提到的股息率,是什么意思?)
银行螺丝钉· 2025-10-18 13:58
Group 1 - The article discusses the importance of investing in index funds and offers a free course on investment techniques for index funds [2] - It introduces the concept of dividend yield, which is a key metric in dividend indices, calculated as the total cash dividends of all companies in the index divided by the market capitalization [5] - An example is provided where a company with a market value of 10 billion and annual dividends of 500 million has a dividend yield of 5% [5] Group 2 - Cash dividends primarily come from a company's profits, with a portion of earnings distributed to shareholders [7] - Research indicates that stocks with high cash dividends tend to have higher average returns over the long term, reflecting strong profitability and financial health [8] - In the A-share market, typical representatives of high dividend stocks include the CSI Dividend Index and the SSE Dividend Index, which cover high dividend stocks in the Shanghai and Shenzhen markets [8]

A股开盘速递 | A股集体低开 沪指跌0.11% 培育钻石、存储芯片等板块领跌
智通财经网· 2025-10-17 01:40
Market Overview - The three major A-share indices opened lower, with the Shanghai Composite Index down 0.11% and the ChiNext Index down 0.36% [1] Institutional Insights - **CITIC Securities**: Short-term adjustments are inevitable, but the market remains resilient. There is potential for indices to reach new highs post-adjustment, which may serve as an opportunity for structural optimization. Focus on low-position sectors with marginal improvements, such as military industry, semiconductors, software autonomy, new consumption, and non-ferrous metals [1] - **Debon Securities**: The market is experiencing a cautious sentiment reflected in reduced trading volumes below 2 trillion yuan. The performance of dividend-representative value sectors may continue to dominate in the short term. If trading volumes do not increase, indices may face continued pressure within a range [2] - **Orient Securities**: Short-term adjustments will not alter the upward trend of the market. The technology sector remains the main focus, with opportunities for accumulation during dips [3]