易方达中证人工智能ETF
Search documents
2025年第四季度大类资产配置
Sou Hu Cai Jing· 2025-10-17 00:37
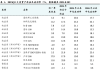
Core Insights - The asset allocation performance for Q3 2025 showed positive returns across all risk profiles, with the aggressive portfolio achieving the highest return of 12.50% [1][7][10] - The analysis indicates that equity and gold contributed significantly to the overall positive performance, while bonds experienced negative returns [10][12] Asset Performance Summary - In Q3 2025, the A-share market outperformed with a 17.9% increase in the CSI 300 index, while the Hang Seng Index rose by 11.6% [5][6] - The U.S. stock market also saw gains, with the Nasdaq leading at 11.2% [5][6] - Gold prices increased by 16.8%, driven by multiple favorable factors including high inflation and a renewed interest in gold as a safe haven [5][6] - Conversely, the oil market faced challenges, with WTI crude oil prices declining by 2.9% due to weak demand and increased production [5][6] Risk and Return Analysis - The annualized volatility for the conservative to aggressive portfolios ranged from 1.78% to 10.27%, with maximum drawdowns between -0.39% and -3.35% [7][9] - The aggressive portfolio's performance lagged behind the CSI 300 ETF by 6.56 percentage points but outperformed the 10-year government bond by 13.17 percentage points [7][8] Investment Strategy and Asset Selection - The recommended ETFs for various portfolios include Huatai-PB CSI 300 ETF, Huaxia Hang Seng Technology ETF, and others, with specific weightings for equity, bonds, and commodities [3][12][13] - The conservative portfolio allocated 10.16% to equities, 70.01% to bonds, and 4.82% to commodities, while the aggressive portfolio allocated 57.44% to equities [3][12][13] Future Outlook - For Q4 2025, the expected asset performance ranking is: Hong Kong stocks > A-shares > gold > U.S. stocks > U.S. bonds > domestic bonds > oil [19][21] - The focus for investment will be on sectors aligned with the "14th Five-Year Plan" and "anti-involution" policies, particularly in AI, robotics, new energy, and metals [18][21]

190只ETF获融资净买入 嘉实上证科创板芯片ETF居首
Zheng Quan Shi Bao Wang· 2025-09-29 01:57
Group 1 - The total margin balance of ETFs in the Shanghai and Shenzhen markets as of September 26 is 111.718 billion yuan, a decrease of 4.945 billion yuan from the previous trading day [1] - The financing balance of ETFs is 103.993 billion yuan, down by 4.625 billion yuan, while the margin balance for securities lending is 7.725 billion yuan, a decrease of 320 million yuan [1] - On September 26, 190 ETFs experienced net financing inflows, with the top inflow being the Harvest SSE Sci-Tech Innovation Board Chip ETF, which saw a net inflow of 208 million yuan [1] Group 2 - The Food and Beverage ETF (Product Code: 515170) tracks the CSI Sub-Industry Food and Beverage Theme Index and has seen a decline of 2.53% over the past five days [2] - The price-to-earnings ratio for the Food and Beverage ETF is 20.20 times, indicating its valuation relative to earnings [2] - The latest share count for the Food and Beverage ETF is 8.68 billion shares, with an increase of 45 million shares, while it experienced a net outflow of 19.854 million yuan [2]

资金借“基”加速进场,两天内近六成股票ETF规模增加
Zheng Quan Shi Bao· 2025-08-20 23:20
Group 1: ETF Growth Overview - A total of 644 stock ETFs experienced growth in scale from August 18 to 19, accounting for nearly 60% of approximately 1100 ETFs, with a combined increase of nearly 33.6 billion yuan [2][3] - The leading ETF in terms of scale growth was the E Fund ChiNext ETF, which increased by 2.885 billion yuan, bringing its total scale close to 93.68 billion yuan [3] - Other notable ETFs with significant growth include the Fortune CSI Hong Kong Stock Connect Internet ETF, which grew by 1.849 billion yuan, and the Huatai-PB CSI 300 ETF, which increased by 1.565 billion yuan [3] Group 2: Market Sentiment and Trading Activity - The recent rise in the Shanghai Composite Index above 3700 points has notably stimulated buying enthusiasm among investors, as indicated by the increase in ETF scale [2][5] - The average daily trading volume of stock ETFs has shown improvement, with the average reaching 132.226 billion yuan in the first two trading days of the week, compared to previous weeks where it ranged from 80.3 billion to 103.8 billion yuan [5][6] - The shift in investor sentiment is crucial for market recovery, as historical data suggests that changes in ETF fund flows can serve as a reference for market trends [5][6] Group 3: Long-term Market Outlook - Analysts suggest that the A-share market may gradually transition into a "slow bull" pattern, driven by a combination of policy measures and improving corporate earnings [6] - The current market dynamics differ from previous bull markets, as the influx of institutional, insurance, and foreign capital has accelerated following the breach of key index levels [6] - The market's volume and index growth rate are currently moderate, indicating that the downside risk remains relatively controllable [6]

什么信号?超七成股票ETF规模上升
Zheng Quan Shi Bao· 2025-08-19 10:54
Core Viewpoint - The recent surge in stock ETFs indicates a growing market enthusiasm, although the overall scale increase remains modest, suggesting that a shift in investor expectations and the formation of momentum from major funds will take time [1][3][6]. Group 1: ETF Performance - On August 18, stock ETFs saw their total scale increase from 35,131.71 billion to 35,574.63 billion, with a net increase of 442.92 billion, representing a growth rate of 1.26% [3]. - A total of 802 stock ETFs experienced scale growth, accounting for over 70% of nearly 1,100 stock ETFs in the market, with 13 ETFs growing by more than 10 billion [2][3]. - Notable performers included Huatai-PB CSI 300 ETF, which grew by nearly 35 billion, and E Fund ChiNext ETF, which increased by over 30 billion [3]. Group 2: Trading Activity - On August 18, the active trading amounts for stock ETFs exceeded 1 trillion, with the highest active buy and sell amounts recorded for E Fund Hong Kong Securities Investment Theme ETF at 168.19 billion and 162.46 billion, respectively [4]. - The average daily trading volume for stock ETFs reached 1,454.54 billion on August 18, marking a significant increase from previous weeks [7]. Group 3: Market Sentiment and Trends - The stock ETF market has shown a reversal from net outflows to net inflows, with August 18 marking a significant shift in investor sentiment [6]. - Analysts suggest that the current market conditions may lead to a "slow bull" market, driven by policy support and improving corporate earnings, contrasting with previous rapid market movements [9][10].

【申万宏源策略 | 一周回顾展望】反证牛市:回应三个市场担忧
申万宏源研究· 2025-08-18 12:04
Core Viewpoint - The current market concerns do not pose significant downward risks, and the bullish sentiment is expected to continue, with potential for a favorable market performance in Q4 2025 and spring 2026 [2][5]. Group 1: Market Concerns and Outlook - The macroeconomic combination in H2 2025 is unfavorable but will not impact the expected improvement in supply-demand dynamics in 2026, as the key verification period for demand may not occur until after 2025 [2][3]. - The structural mainline related to the core narrative of the bull market has not yet established a trend, but this is not expected to hinder the performance of Q4 2025 compared to Q3 2025 [3][4]. - The potential impact of the expiration of the 90-day pause on US-China tariffs is expected to weaken over time, as trade relations between China and other countries remain stable [5][6]. Group 2: Investment Focus and Strategies - The focus for short-term investments should be on "bull market synchronous assets," particularly in sectors like brokerage, insurance, military industry, and rare earths, while also considering high-demand sectors like pharmaceuticals and overseas computing [6][7]. - The structural strategy of "anti-involution" in high market share manufacturing sectors in China aims to build price alliances and enhance industry concentration, particularly in solar energy, chemicals, and key electrical components [6][7]. - The Hong Kong stock market is expected to lead in the bull market, with increasing optimism and a high net inflow from mainland investors, indicating a potential for better performance compared to A-shares [7][8].

ETF基金周度跟踪:金融科技、人工智能ETF领涨,资金大幅流入债券ETF-20250818
CMS· 2025-08-18 03:04
1. Report Industry Investment Rating No relevant content provided. 2. Core View of the Report The report focuses on the performance of the ETF fund market from August 11th to August 15th, summarizing the performance and capital flows of the overall ETF market, different popular sub - type ETFs, and innovative theme and sub - industry ETFs for investors' reference [1]. 3. Summary by Relevant Catalogs 3.1 ETF Market Overall Performance - **Market Performance**: Most stock ETFs rose this week. A - share Sci - tech/GEM ETFs had the largest increase, with an average increase of 7.18% for funds above a certain scale. In contrast, Shanghai - Hong Kong - Shenzhen thematic ETFs (mainly gold - stock ETFs) and A - share dividend ETFs declined, with average decreases of 0.31% and 0.28% respectively for funds above a certain scale. Commodity ETFs had the deepest decline, with an average decrease of 1.10% for funds above a certain scale [2][6]. - **Fund Flow**: Funds flowed significantly into bond ETFs and Hong Kong - stock TMT ETFs, with net inflows of 12.763 billion yuan and 11.672 billion yuan respectively for the whole week. Conversely, A - share TMT ETFs and A - share Sci - tech/GEM ETFs had significant outflows, with net outflows of 17.716 billion yuan and 16.618 billion yuan respectively for the whole week [3][8]. 3.2 Different Popular Sub - type ETF Fund Market Performance - **A - share ETFs**: Various sub - types of A - share ETFs, including broad - based index (full - market, large - cap/super - large - cap, small - and - medium - cap, Sci - tech/GEM), industry (TMT, manufacturing, consumption, medicine, cycle, finance and real estate), SmartBeta (value, growth, dividend, free cash flow), and theme ETFs, showed different performance in terms of weekly capital flow, weekly return, recent one - month return, and year - to - date return [16][17][18]. - **Hong Kong - stock ETFs**: Hong Kong - stock ETFs, including broad - based index, industry (TMT, mid - stream manufacturing, consumption, medicine, finance and real estate), SmartBeta (dividend), and theme ETFs, also had diverse performance in different aspects [31][32][33]. - **Shanghai - Hong Kong - Shenzhen ETFs**: Shanghai - Hong Kong - Shenzhen ETFs in the industry and theme categories presented different performance characteristics [36][37]. - **US - stock ETFs**: US - stock ETFs in broad - based index and industry categories showed their own performance trends [38][39]. - **Other QDII - ETFs**: Other QDII - ETFs (excluding Hong Kong - stock and US - stock ETFs) had specific performance in terms of capital flow and return [40]. - **Bond ETFs**: Bond ETFs had different capital flows and return rates [41]. - **Commodity ETFs**: Commodity ETFs, mainly gold and some futures ETFs, showed certain performance trends [43]. 3.3 Innovative Theme and Sub - industry ETF Fund Market Performance - **TMT Innovative Themes**: Indexes such as fintech, 5G communication, and artificial intelligence had significant weekly increases and year - to - date increases, and their representative ETFs also showed corresponding performance [45]. - **Consumption Sub - industries**: Indexes of sub - industries like household appliances, wine, and food and beverage had different weekly and year - to - date returns, and their representative ETFs followed suit [46]. - **Medicine Sub - industries**: Sub - industry indexes such as biotech, innovative drugs, and biomedicine had certain performance, and their representative ETFs showed similar trends [47]. - **New Energy Themes**: Indexes related to photovoltaic, new energy vehicles, etc. had different performance, and their representative ETFs reflected these trends [48]. - **Central and State - owned Enterprise Themes**: Indexes of central and state - owned enterprise themes had various performance, and their representative ETFs showed corresponding changes [49][50]. - **Stable Growth Themes**: Indexes of stable growth themes such as real estate, rare earths, and non - ferrous metals had different performance, and their representative ETFs followed [51]. - **Shanghai - Hong Kong - Shenzhen/Hong Kong - Stock Connect Sub - industries**: Indexes of sub - industries in this category had specific performance, and their representative ETFs showed similar trends [52]. - **Dividend/Dividend Low - Volatility Index Families**: Indexes in this family had different performance, and their representative ETFs showed corresponding changes [53]. - **GEM Index Families**: Indexes in the GEM index family had various performance, and their representative ETFs showed corresponding trends [55].
“AI选手”强势归来 基金经理乘胜出击
Zhong Guo Zheng Quan Bao· 2025-07-16 23:54
Group 1 - The AI computing power sector experienced a strong surge on July 15, with several actively managed equity funds seeing significant net value increases, outperforming related ETF products [1][2] - Fund manager Zhou Jiansheng's Nord New Life A achieved a net value growth rate of 9.42%, the highest in the market, while other funds managed by Jin Zicai also reported growth rates above 8% [2][3] - The rapid growth in the optical communication and PCB sectors over the past two years is attributed to the expansion of global customer demand and the long-term positive outlook for the AI industry, suggesting that Chinese manufacturers are likely to continue benefiting from global AI development [1][6] Group 2 - The active equity funds led the gains in the AI computing power sector, with notable performances from funds managed by Zhou Jiansheng, Jin Zicai, and Ren Jie, all reporting net value growth rates above 8% [2][3] - The ETF market also showed strong performance, with the Huaxia SSE Sci-Tech Innovation Board 50 ETF leading in trading volume, surpassing 35 billion yuan in consecutive trading days [4] - Fund inflows have been strong, with the Huaxia SSE Sci-Tech Innovation Board 50 ETF seeing nearly 10 billion yuan in net inflows on July 15, and cumulative inflows close to 50 billion yuan for July [4] Group 3 - Looking ahead, the demand for AI computing power is expected to remain high, as leading companies in the sector have reported better-than-expected financial results [5][6] - The AI industry is witnessing a continuous breakthrough in cognitive boundaries, with significant capital investments from tech giants and a substantial increase in AI cluster scale [6][7] - The market is currently reassessing the value of the AI computing power sector, with a focus on Chinese companies that possess global competitiveness [6][7]
上半年逾2000亿资金借道ETF进场,这两个赛道普遍被机构看好
Sou Hu Cai Jing· 2025-06-04 07:47
Group 1 - The overall market sentiment has improved since April 7, 2025, with significant capital inflow into equity ETFs, leading to a positive net subscription amount for the first half of the year [1][2] - Over 200 billion yuan has flowed into various types of ETFs, including stock, bond, cross-border, and commodity ETFs, with a notable focus on core broad-based ETFs [2][3] - The top three ETFs by net inflow from January to May 2025 include Huaxia CSI 300 ETF (+32.56 billion yuan), Huaan Gold ETF (+22.81 billion yuan), and Huatai-PB CSI 300 ETF (+20.78 billion yuan) [3] Group 2 - As of May 30, 2025, eight bond ETFs have surpassed 10 billion yuan in scale, with the top two being the Fortune 7-10 Year Policy Financial Bond ETF and the Hai Fudong CSI Short-term Bond ETF, both exceeding 40 billion yuan [4] - The A-share market is expected to experience upward fluctuations due to ongoing policy support and the influx of medium to long-term capital [4] Group 3 - The robotics sector is gaining attention, with the National Robotics Industry Index showing a year-to-date increase of 6.89%, outperforming the broader market [6][7] - The top three ETFs in the robotics sector by net inflow from January to May 2025 are Huaxia CSI Robotics ETF (+9.12 billion yuan), E Fund CSI Artificial Intelligence ETF (+8.31 billion yuan), and Tianhong CSI Robotics ETF (+4.29 billion yuan) [7][9] Group 4 - The Hong Kong stock market is attracting institutional funds, particularly in the technology sector, with significant net inflows into cross-border ETFs, including the Fortune CSI Hong Kong Internet ETF (+19.02 billion yuan) and the Industrial Bank National CSI Hong Kong Technology ETF (+12.41 billion yuan) [10][12] - The AI industry transformation and the narrative of domestic technology self-sufficiency are expected to continue driving interest in the Hong Kong technology sector [10]

大市值+科技成长“杠铃”配置——ETF主观配置策略月报(四)
Soochow Securities· 2025-05-20 01:20
Market Overview - A-shares have entered a new phase with external disturbances easing, showing support below and awaiting catalysts above[2] - The market is expected to exhibit a volatile trend in the short term, with economic growth remaining stable despite marginal declines in production, consumption, and investment growth rates[2] - In April, the GDP growth rate was 1% YoY, while the CPI and PPI showed deflationary trends at -0.1% and -2.7% respectively[6] Investment Strategy - The recommended investment strategy is a "barbell" approach focusing on "large-cap + technology growth" sectors[2] - Suggested ETFs include large-cap indices like the CSI 300 and defensive dividend ETFs, which are expected to benefit from increased public fund allocations[3] - Key sectors for investment include self-sufficiency in technology, AI, and robotics, with a focus on ETFs that track these themes[2] ETF Recommendations - The following ETFs are highlighted for investment: - Huaxia CSI 50 ETF with a scale of 1649.7 million RMB[4] - Huatai-PB CSI 300 ETF with a scale of 3800.7 million RMB[4] - E Fund CSI Artificial Intelligence ETF with a scale of 163.2 million RMB[4] - Guotai CSI Semiconductor Materials and Equipment ETF with a scale of 22.8 million RMB[4] Economic Indicators - The total social financing increased by 11,591 million RMB in April, with a year-on-year growth rate of 8.7%[6] - Fixed asset investment showed a cumulative year-on-year growth of 4.0%, while real estate development investment declined by 10.3% YoY[6] Risk Factors - Potential risks include slower-than-expected economic recovery, policy implementation delays, geopolitical risks, and uncertainties surrounding overseas interest rate cuts and trade policies[4]
ETF主观配置策略月报(四):大市值+科技成长“杠铃”配置-20250520
Soochow Securities· 2025-05-19 23:30
Market Outlook and ETF Strategy - The current phase of the A-share market indicates a stabilization of external disturbances, with support on the downside and potential catalysts on the upside, leading to an expected short-term oscillating trend [2] - Following the Geneva talks between China and the US, tariff trade risks have eased, and the index has returned to pre-tariff levels, showcasing the A-share market's resilience against global risks [2] - Despite a recent decline in market volume and rapid sector rotation, the A-share market is expected to maintain a primary oscillating trend due to the lack of strong catalysts for further upward movement [2] - The recommended investment strategy is a "barbell" approach, focusing on large-cap stocks and technology growth sectors, with a dual emphasis on public fund allocation and defensive strategies [2] Industry and Thematic Trends - Currently, the market lacks a clear mainline, with dispersed hotspots and no single sector attracting significant monthly trading consensus [2] - In the medium term, under the "broad monetary + weak dollar" framework, technology growth styles are expected to perform well, particularly in areas such as self-sufficiency, AI, and robotics [2] - The report suggests focusing on two main directions for industry/theme ETF allocations: self-sufficiency and industry trends, particularly in semiconductor equipment and high-end manufacturing ETFs [2][3] ETF Recommendations - The report lists specific ETFs for investment, including: - Large-cap ETFs such as the Huaxia SSE 50 ETF (规模: 1649.7 million) and the Huatai-PB CSI 300 ETF (规模: 3800.7 million) [4] - Dividend-focused ETFs like the CCB CSI 300 Dividend ETF (规模: 2.8 million) and the Invesco CSI 100 Low Volatility Dividend ETF (规模: 62.1 million) [4] - Thematic ETFs including the Huaxia National Semiconductor Equipment ETF (规模: 22.8 million) and the E Fund National Robotics Industry ETF (规模: 13.9 million) [4][13]