传媒等
Search documents
粤开市场日报-20251119
Yuekai Securities· 2025-11-19 08:01
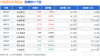
Market Overview - The A-share market showed mixed performance today, with the Shanghai Composite Index rising by 0.18% to close at 3946.74 points, while the Shenzhen Component Index remained flat at 13080.09 points. The ChiNext Index fell by 0.97% to 1344.80 points, and the Growth Enterprise Market Index increased by 0.25% to 3076.85 points. Overall, there were 1196 stocks that rose and 4173 that fell, with a total trading volume of 17259 billion yuan, a decrease of 2001 billion yuan compared to the previous trading day [1][10]. Industry Performance - Among the primary industries, non-ferrous metals, petroleum and petrochemicals, national defense and military industry, beauty care, and banking sectors led the gains, with increases of 2.39%, 1.67%, 1.11%, 1.09%, and 0.92% respectively. Conversely, the real estate, media, construction materials, retail, computer, and pharmaceutical sectors experienced declines, with drops of 2.09%, 1.72%, 1.71%, 1.70%, 1.41%, and 1.28% respectively [1][10]. Concept Sector Performance - The concept sectors that performed well today included aquaculture, China Shipbuilding Industry Corporation, deep-sea technology, lithium mining, gold and jewelry, selected insurance, aircraft carriers, lithium extraction from salt lakes, and industrial metals. These sectors showed significant gains, while sectors like Hainan Free Trade Port, primary real estate companies, and photovoltaic glass faced declines [2][12].
11月16日20只个股获券商关注,中油资本目标涨幅达16.19%
Sou Hu Cai Jing· 2025-11-17 03:41
Core Points - A total of 20 stocks received ratings from brokerages, with 6 stocks rated as "Buy" [1] - Among the stocks with target prices, Zhongyou Capital (000617.SZ) has the highest expected price increase of 16.19% based on the latest closing price [1][2] Company Summary - Zhongyou Capital (000617.SZ) received a "Buy" rating from Guotai Junan Securities, with a target price of 10.98 yuan and a closing price of 9.45 yuan, indicating a potential increase of 16.19% [2] - Other stocks rated as "Buy" include Rongsheng Petrochemical (002493.SZ), Jichuan Pharmaceutical (600566.SH), Haibo Innovation (688411.SH), Shiji Performance (002602.SZ), and Zhaoyi Innovation (603986.SH) [2] Industry Summary - The industries with the highest number of stocks receiving attention from brokerages are construction decoration, automotive, and non-ferrous metals [4]


中信建投:继续看多黄金 港股情绪指数抬升
Zheng Quan Shi Bao Wang· 2025-11-16 12:15
Group 1 - The A-share sentiment index is declining while the Hong Kong stock sentiment index is rising, indicating a shift in market sentiment [1] - The VIX for the Shanghai Stock Exchange 50, CSI 300, CSI 500, and CSI 1000 has decreased, suggesting a more stable market environment [1] - Institutions are currently focusing on sectors such as basic chemicals, defense and military, automotive, textile and apparel, non-bank financials, and media, while interest in the telecommunications sector has decreased [1] Group 2 - There has been an increase in institutional attention towards the "petroleum and petrochemicals," "coal," "steel," "light manufacturing," and "non-bank financial" sectors over the past week [1] - Many industries are approaching the threshold of crowded indicators, indicating potential liquidity and consistency among constituent stocks [1] - For the long term, the company is optimistic about the relative returns of electric power and utilities, basic chemicals, electric equipment and new energy, electronics, and computers by November 2025 [1] Group 3 - The VIX for gold, silver, copper, and crude oil has risen, with a long-term bullish outlook on gold [1]
A股市场大势研判:A股全天震荡调整,三大指数均冲高回落
Dongguan Securities· 2025-11-10 00:08
Market Overview - The A-share market experienced fluctuations with all major indices retreating after initial gains, closing with the Shanghai Composite Index down 0.25% at 3997.56 points, the Shenzhen Component down 0.36% at 13404.06 points, and the ChiNext down 0.51% at 3208.21 points [1][3]. Sector Performance - The top-performing sectors included Basic Chemicals (+2.39%), Comprehensive (+1.45%), Oil & Petrochemicals (+1.38%), Building Materials (+1.22%), and Electric Equipment (+1.01%) [2]. - Conversely, the worst-performing sectors were Computer (-1.83%), Electronics (-1.34%), Household Appliances (-1.17%), Automotive (-1.16%), and Media (-0.87%) [2]. Concept Index Performance - Among concept indices, the Organic Silicon concept led with a gain of 4.65%, followed by Fluorochemical (+3.92%), Silicon Energy (+3.67%), Phosphate Chemical (+3.47%), and Titanium Dioxide (+3.37%) [2]. - The lagging concept indices included Sci-Tech New Shares (-2.27%), Sora Concept (Wensheng Video) (-1.87%), MLOps Concept (-1.82%), Reducer (-1.76%), and Registration System New Shares (-1.70%) [2]. Economic Indicators - In the first ten months of 2025, China's total goods trade value reached 37.31 trillion yuan, reflecting a year-on-year growth of 3.6%. Exports amounted to 22.12 trillion yuan, up 6.2%, while imports were 15.19 trillion yuan, remaining stable compared to the previous year [4]. Trading Volume and Market Sentiment - The total trading volume in the Shanghai and Shenzhen markets was 2 trillion yuan, a decrease of 562 billion yuan from the previous trading day [5]. - The report indicates that the Chinese economy is in a critical phase of momentum transition, with expectations for gradual improvement in the economic fundamentals in the fourth quarter, supported by policy measures [5]. Investment Strategy - The report suggests a balanced allocation strategy, focusing on sectors such as New Energy, Technology Growth, Dividend Stocks, and Non-ferrous Metals [5].
主力资金丨尾盘4股获大幅抢筹
Zheng Quan Shi Bao Wang· 2025-11-06 13:30
Core Insights - The main point of the article is the analysis of capital flow in various industries, highlighting the net inflow and outflow of funds in the stock market on November 6, with specific focus on the performance of different sectors and individual stocks [2][4]. Industry Summary - A total of 9 industries experienced net inflows of main capital, with the electronic industry leading at a net inflow of 65.48 billion, followed by the communication, automotive, and non-ferrous metal industries, each with inflows exceeding 11 billion [2]. - Among the 20 industries tracked, 11 saw declines, with the media, social services, and retail sectors each dropping over 1%, while banking, agriculture, textiles, and real estate experienced slight declines [2]. Company Summary - The leading stock in terms of net capital inflow was Shenghong Technology, with an inflow of 16.49 billion, followed by Dongshan Precision and Weichai Power, which saw inflows of 9.68 billion and 8.61 billion respectively [4]. - Notable stocks with significant net inflows exceeding 7 billion include Yangguang Power, Wanxiang Qianchao, Xinyi Technology, and others [6]. - On the other hand, TBEA and Pingtan Development faced substantial net outflows, with TBEA experiencing an outflow of 11.69 billion, marking the highest outflow since September 16, 2021 [8].

A股走出独立上涨行情:价值板块领涨,市场风格切换已至?
Xin Lang Cai Jing· 2025-11-05 13:07
Core Viewpoint - The A-share market is showing an independent trend amidst global market fluctuations, with significant gains in certain sectors such as coal, power equipment, and retail, while technology stocks are experiencing adjustments [2][4]. Market Performance - On November 5, the Shanghai Composite Index rose by 0.23% to 3969.25 points, the Shenzhen Component Index increased by 0.37% to 13223.56 points, and the ChiNext Index surged over 1% by 1.03% to 3166.23 points [2]. - Key sectors driving the A-share rebound include power equipment (+3.4%), coal (+1.39%), retail (+1.22%), and environmental protection (+1.06%) [3]. Sector Analysis - The rebound in value sectors suggests a potential market style shift, with analysts noting that November is a critical time for portfolio adjustments due to calendar effects and earnings realizations [5][6]. - Historical patterns indicate that November often marks a transition from focusing on current fundamentals to anticipating future performance, particularly in low-valued and undervalued sectors [5][9]. Investment Strategy - Analysts recommend a balanced allocation to navigate market volatility during the style-switching period, while maintaining a focus on technology growth stocks, which are expected to continue leading the market [12][11]. - The current market environment suggests that while high-dividend stocks like coal may provide returns, technology stocks remain a crucial part of the ongoing market narrative [14].

金工ETF点评:宽基ETF单日净流入157.86亿元,传媒、医药拥挤变动幅度较大
Tai Ping Yang Zheng Quan· 2025-11-03 14:12
- The industry congestion monitoring model is constructed to monitor the congestion levels of Shenwan first-level industry indices on a daily basis[3] - The premium rate Z-score model is used to build a related ETF product screening signal model, providing potential arbitrage opportunities and warning of potential pullback risks[4] - The industry congestion monitoring model shows that the congestion levels of the electric power equipment and non-ferrous metals industries were high on the previous trading day, while the social services and light industry had lower congestion levels[3] - The premium rate Z-score model is used to identify ETF products with potential arbitrage opportunities, but also highlights the need to be cautious of potential pullback risks[4]
增长正归来——2025年三季报业绩点评
Huachuang Securities· 2025-11-02 13:13
Group 1 - The overall A-share market has entered a continuous upward profit cycle, with Q3 2025 net profit growth of 11.3% YoY for all A-shares and 3.9% for non-financial A-shares, significantly up from Q2 2025 figures of 1.3% and -2.1% respectively [10][14][18] - The forecast for 2025 net profit growth for all A-shares and non-financial A-shares has been revised to a neutral 5.4% and 5.1% respectively, with Q4 2025 expected to show continued recovery in net profit growth [2][15][18] - Q3 2025 return on equity (ROE) for all A-shares was 7.9%, a slight increase from Q2, with net profit margin rising and asset turnover slightly declining [3][25][29] Group 2 - Growth in profit margins is leading over value, with significant contributions from the electronics, non-ferrous metals, steel, and new energy sectors in Q3 2025 [4][30][33] - The cumulative net profit growth for the ChiNext Index in Q3 2025 was 20.1%, compared to 4.9% for the SSE 50, indicating a clear advantage for growth style over value style [30][31] - Most industries reported positive profit growth in Q3 2025, with electronics, non-ferrous metals, steel, and new energy contributing the most, while real estate and agriculture sectors showed significant declines [4][33][39]
河南国企改革板块10月24日跌1.48%,郑州煤电领跌,主力资金净流出8.93亿元
Sou Hu Cai Jing· 2025-10-24 08:59
Core Viewpoint - The Henan state-owned enterprise reform sector experienced a decline of 1.48% on October 24, with Zhengzhou Coal Power leading the drop. In contrast, the Shanghai Composite Index rose by 0.71% and the Shenzhen Component Index increased by 2.02% [1]. Group 1: Market Performance - The closing price of Zhengzhou Coal Power was 5.12, reflecting a significant drop of 8.57% with a trading volume of 1.75 million shares and a transaction value of 911 million [2]. - Major stocks in the Henan state-owned enterprise reform sector showed mixed performance, with 合众思壮 (Hezhong Sizhuang) closing at 60.6, up by 1.79%, while other stocks like 神火股份 (Shenhuo Co.) and 中原传媒 (Zhongyuan Media) also saw slight increases [1][2]. Group 2: Capital Flow - The Henan state-owned enterprise reform sector saw a net outflow of 893 million from institutional investors, while retail investors contributed a net inflow of 608 million [2]. - The capital flow data indicates that 合众思壮 (Hezhong Sizhuang) had a net inflow of 13.42 million from institutional investors, while 安彩高科 (Ancai High-Tech) experienced a net outflow of 1.05 million [3].
市场全天弱势震荡,三大指数盘中翻红后均出现回落
Dongguan Securities· 2025-10-23 01:08
Market Overview - The A-share market experienced weak fluctuations, with all three major indices showing a decline after briefly turning positive during the day [2][4] - The Shanghai Composite Index closed at 3913.76, down 0.07%, while the Shenzhen Component Index fell 0.62% to 12996.61 [2] - The total trading volume in the Shanghai and Shenzhen markets was 1.67 trillion, marking a decrease of 224.8 billion from the previous trading day [6] Sector Performance - The top-performing sectors included Petroleum and Petrochemicals (+1.58%), Banks (+0.97%), and Household Appliances (+0.82%) [3] - Conversely, sectors such as Non-ferrous Metals (-1.36%), Electric Power Equipment (-1.29%), and Agriculture, Forestry, Animal Husbandry, and Fishery (-1.19%) showed significant declines [3] - Concept indices like Combustible Ice and Shale Gas performed well, while sectors like Hainan Free Trade Zone and Graphite Electrode faced losses [4] Future Outlook - The market is expected to see a potential increase in risk appetite due to upcoming events such as the Fourth Plenary Session and the verification of third-quarter earnings [6] - Focus is recommended on sectors such as dividends, TMT (Technology, Media, and Telecommunications), Non-ferrous Metals, and New Energy for potential investment opportunities [6] - The report indicates that the market is currently in a "high-cut-low" structural phase, with a tightening risk preference [6]