技术分析
Search documents
10月16日【港股Podcast】恆指、比亞迪電子、小米、神華、舜宇科技、嗶哩嗶哩
Ge Long Hui· 2025-10-17 11:52
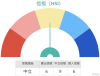
Group 1: Hang Seng Index (HSI) - The Hang Seng Index (HSI) experienced a slight decline of approximately 22 points, closing at 25,888 points, indicating a lack of clear market direction among investors [1] - Investors are divided, with some bullish investors waiting for the index to reach 26,250 points to fill the gap, while bearish investors anticipate a drop to the 25,200-25,400 range [1] - Current technical signals show a "neutral" market, with an equal number of buy and sell indicators, suggesting no clear trend [2] Group 2: BYD Electronics (00285) - BYD Electronics has seen an increase in trading volume over the past two days, indicating potential buying interest, with a resistance level around 43 HKD [8] - The stock is currently in a "neutral" technical state, similar to the HSI, with no clear direction indicated by the technical signals [8] - If the stock continues to rise, it may challenge the 43 HKD level, while a pullback could see it drop to the 38-39 HKD range [8] Group 3: Xiaomi Group (01810) - Xiaomi's stock has been on a downward trend, reaching a low of 47.32 HKD, but technical signals currently show a "buy" bias with 10 buy signals against 5 sell signals [14] - The short-term resistance level is around 52.7 HKD, while the support level is at 45.8 HKD, with a potential drop to 39.9 HKD if the support is breached [14] - The market sentiment is mixed, with both bullish and bearish perspectives present [14] Group 4: China Shenhua (01088) - China Shenhua's stock has performed well recently, closing at 40.98 HKD, but is considered to be at a relatively high level, with an RSI of 86 indicating overbought conditions [20] - Technical signals suggest a "sell" bias with 8 sell signals and 5 buy signals, indicating a potentially weaker trend [20] - The current resistance level is around 42.2 HKD, with a support level at 39.5 HKD [20] Group 5: Sunny Optical Technology (02382) - Sunny Optical has shown a rebound over the past two days but remains at low levels, with no clear reversal signals yet [26] - Technical analysis indicates a "buy" bias with 8 buy signals and 5 sell signals, suggesting a slightly stronger outlook [26] - The resistance level to watch for a potential rise to 88 HKD is around 85.4 HKD, with a possibility of reaching 89.7 HKD if this level is surpassed [26] Group 6: Bilibili (09626.HK) - Bilibili's stock has recently rebounded, closing at 212 HKD, approaching the middle line of the Bollinger Bands at around 215 HKD [30] - Current technical signals are "neutral," indicating no clear direction, and investors are advised to wait for further analysis [30] - The first support level is around 199 HKD, with a potential drop to 188 HKD if this level is breached [30]

從Put倉到技術指標,小米市場情緒分歧加劇
Ge Long Hui· 2025-10-17 11:52
Group 1 - The core viewpoint of the articles indicates that Xiaomi Group's stock is currently experiencing a critical turning point, with short-term trading opportunities emerging despite a recent decline in stock price [1][2] - Technical analysis shows that Xiaomi's stock is above significant support levels at 44.5 HKD and 38.5 HKD, while resistance levels are at 51.3 HKD and 56.3 HKD [1] - The Relative Strength Index (RSI) has dropped to 29, indicating an oversold condition, which suggests a potential for a technical rebound in the short term [1][2] Group 2 - Recent market sentiment around Xiaomi has been disappointing, with the stock price primarily trending downward, reaching a low of 47.32 HKD [2] - Despite the negative sentiment, technical signals indicate a bullish outlook in the short term, with 10 buy signals and 5 sell signals identified [2] - The short-term resistance level is approximately 52.7 HKD, while the support level is around 45.8 HKD; a drop below this support could lead to a further decline to 39.9 HKD [2] Group 3 - In the derivatives market, several Xiaomi-related products have performed well despite the decline in the stock price, with notable increases in various warrants and certificates [4] - For investors looking to capture short-term volatility, options such as Morgan Stanley's call warrants and UBS's put warrants are available, offering leverage and reasonable implied volatility [7][8] - The market offers a variety of choices for both bullish and bearish strategies, with specific products providing high leverage and low premiums [7][8]

就业数据低于预期 澳元失守0.6500关口
Jin Tou Wang· 2025-10-16 04:39
Group 1 - The Australian dollar (AUD) has fallen below the 0.6500 mark against the US dollar, currently at 0.6489, reflecting a decline of 0.30% [1] - Australia's unemployment rate rose to 4.5% in September, igniting expectations for a potential interest rate cut by the Reserve Bank of Australia (RBA) [1] - Employment data showed an increase of 14,900 jobs in September, which was below the market expectation of 20,000, while the previous month's job loss was revised to a decrease of 11,800 from 54,000 [1] Group 2 - RBA Assistant Governor Sarah Hunter's cautious remarks provided some support for the AUD, noting that recent data was slightly better than expected and that third-quarter inflation might exceed forecasts [1] - The RBA's September monetary policy meeting minutes indicated that board members believe the current policy is still somewhat restrictive, but the extent is difficult to determine [1] - Economic risks remain, with weak employment and wage growth contributing to subdued consumer spending [1] Group 3 - Technical analysis indicates that the AUD/USD remains in a downward channel, with bearish sentiment persisting [2] - The potential downside target for the AUD/USD is around 0.6440, and a break below this support could lead to testing the four-month low of 0.6414 and the five-month low of 0.6372 [2] - On the upside, initial resistance is at the 9-day exponential moving average of 0.6527, followed by the 50-day moving average at 0.6551, with a breakthrough potentially improving short- and medium-term price momentum [2]
郑氏点银:黄金冲高回落,日线走循环,又要试探短期5日再企稳
Sou Hu Cai Jing· 2025-10-14 15:06
Group 1 - The core viewpoint of the article indicates that gold prices experienced a strong upward movement, reaching a peak of 4080 before facing a pullback, with expectations of testing the short-term 5-day moving average for stability [1] - Gold's daily performance showed significant volatility, with a notable pattern of alternating strong upward movements followed by consolidation phases, suggesting a potential continuation of this cycle [1][3] - The analysis highlights that the current support level for gold is around 4090, with resistance at 4124 and 4150, indicating a range for potential price movements [3] Group 2 - Silver prices initially showed strength, reaching a high of 52.4 but faced downward pressure, testing the support level of 50.5, which is close to the daily 5-day moving average of 50.3 [5] - The outlook for silver remains bullish as long as it stays above the 5-day moving average, with potential for a rebound if it can break back above 51 [5]

新价量相关性因子绩效月报20250930-20251014
Soochow Securities· 2025-10-14 10:49
- The report introduces the **RPV factor (Renewed Correlation of Price and Volume)**, which is constructed by combining intraday and overnight price-volume correlation information. The factor leverages the reversal effect of closing price sequences and the momentum effect of overnight returns, enhanced by turnover rate sequences. The construction process involves identifying the best representatives for intraday and overnight price-volume correlations (CCOIV and COV), and integrating their information into a unified factor. This factor is designed to capture both reversal and momentum effects effectively[6][7][10] - The report also introduces the **SRV factor (Smart Correlation of Price and Volume)**, which is a refined version of the RPV factor. The SRV factor splits intraday price movements into morning and afternoon sessions, calculates a "smart" indicator for the afternoon session, and identifies the 20% of time intervals with the highest informed trading activity. It then uses the turnover rate during these intervals to calculate the correlation with afternoon price movements. For overnight price-volume correlation, the turnover rate is replaced with the turnover rate of the last half-hour of the previous trading day, which is considered to have a higher proportion of informed trading. The SRV factor combines the improved intraday and overnight price-volume correlation factors into a single composite factor[6][10][11] - The **RPV factor** is evaluated as a novel and effective factor that incorporates both reversal and momentum effects, making it a robust tool for stock selection[6][7] - The **SRV factor** is evaluated as an improvement over the RPV factor, with better performance metrics, including higher annualized returns, information ratio, and lower maximum drawdown. It is considered a more effective factor for stock selection[6][10] - The **RPV factor** achieved an annualized return of 14.26%, annualized volatility of 7.70%, IR of 1.85, monthly win rate of 72.14%, and maximum drawdown of 10.63% during the backtesting period from January 2014 to September 2025[7][10] - The **SRV factor** achieved an annualized return of 17.07%, annualized volatility of 6.51%, IR of 2.62, monthly win rate of 74.29%, and maximum drawdown of 3.93% during the same backtesting period[7][10] - In September 2025, the **RPV factor** achieved a 10-group long portfolio return of 1.24%, short portfolio return of -0.89%, and long-short portfolio return of 2.12%[10] - In September 2025, the **SRV factor** achieved a 10-group long portfolio return of 1.70%, short portfolio return of -1.51%, and long-short portfolio return of 3.21%[10]
10月9日【港股Podcast】恆指、港交所、小米、紫金、比亞迪、匯豐
Ge Long Hui· 2025-10-10 19:36
Group 1: Hang Seng Index (HSI) - The Hang Seng Index closed at 26,752 points, near the middle line of the Bollinger Bands at 26,500 points, indicating a "sell" signal with a short-term bearish bias [1] - Current resistance levels are at 27,284 points and 27,600 points, while support levels are at 26,200 points and 25,700 points [1] Group 2: Hong Kong Exchanges and Clearing (00388.HK) - The stock has reached a yearly high, with investors deploying call options at an exercise price of 530.5 HKD, and the stock peaked at 460 HKD during the day [6] - The technical trading signal is a "buy," with the first resistance level identified at 471 HKD, and a potential upward movement to 477 HKD if the upper Bollinger Band is successfully breached [6] Group 3: Xiaomi Group (01810.HK) - The stock price closed at 53.35 HKD, with a neutral trading signal, and investors are speculating a drop to 48 HKD [10] - Support levels are identified at 52 HKD and 49.2 HKD [10] Group 4: Zijin Mining (02899.HK) - Investors are hopeful for the stock to reach 40 HKD by the end of the month, holding call options with an exercise price of 38.99 HKD [15] - The stock reached a high of 39.62 HKD during the day, with a "sell" signal and resistance levels at 38.8 HKD and 42 HKD [16] Group 5: BYD Company (01211.HK) - The stock closed at 110.2 HKD, with a "buy" signal, and investors are looking for entry points around 120 HKD [22] - The first support level is at 106 HKD, followed by a second support level at 102 HKD [22] Group 6: HSBC Holdings (00005.HK) - The stock experienced significant volatility, reaching a low of 102.5 HKD, with a potential entry point at 103 HKD [27] - The average volatility over recent days is noted at 9%, with a "buy" signal and support levels at 99.9 HKD and 95.7 HKD [27]

当下的盘面是比较脆弱的
猛兽派选股· 2025-10-10 04:22
Core Viewpoint - The article emphasizes that technical analysis is not inherently useless; rather, it is often misapplied or misunderstood. The current market signals indicate increasing risks, necessitating a reduction in stock holdings and positions [1]. Group 1: Market Analysis - Recent market movements show a divergence between the strong performance of the Shanghai Composite Index and the underlying technical indicators, suggesting a potential top divergence [1]. - The market's support relies heavily on specific sectors such as computing power, energy storage, and metals. A decline in these sectors could lead to significant market downturns [1]. - The brokerage sector is described as dependent on retail investor sentiment, with overall trading volume indicating a lack of substantial growth potential [1]. Group 2: Technical Indicators - The article notes that despite a recent volume breakout in the Shanghai Composite Index, there are concerns about the sustainability of this upward movement due to underlying divergence signals [1]. - The average stock price index shows a divergence in volume and price, indicating a potential peak in the near term [1]. - Market sentiment remains low, with most stocks experiencing downward pressure, while only a few sectors and stocks continue to show strength [1]. Group 3: Psychological Factors - Many investors are trapped in a mindset of expecting new leading sectors to emerge quickly, but the reality is that new leaders often arise from periods of correction [2].

行业内不愿谈的真相?投资大师罗杰斯直言:我没见过一个靠技术分析发财的富人
Sou Hu Cai Jing· 2025-10-10 01:07
Core Insights - Jim Rogers, known as the "Commodity King," emphasizes the importance of buying value and selling during market hysteria [2][36] - He began trading in 1968 with a modest capital of $600 and co-founded the Quantum Fund with George Soros in 1973 [3][7] - Rogers advocates for patience and waiting for the right investment opportunities rather than acting out of boredom [9][37] Early Career and Investment Philosophy - Rogers initially worked on Wall Street and began trading while studying at Oxford [5] - He learned from early mistakes, emphasizing the need to understand investments thoroughly before acting [6] - His strategy involves waiting for favorable conditions, akin to "fishing in a barrel" [5][9] Collaboration with Soros - The Quantum Fund was innovative for its time, allowing for simultaneous trading across various markets [7] - Rogers and Soros had a complementary relationship, with Rogers focusing on analysis while Soros executed trades [7] Investment Strategies - Rogers stresses the importance of ensuring investments have high intrinsic value to minimize potential losses [9][36] - He believes in the necessity of a "catalyst" to trigger significant market movements [37] - The concept of market "hysteria" is crucial; he often looks for opportunities to act against prevailing market trends [10][12] Market Behavior and Cycles - Markets follow cyclical patterns, often driven by emotional responses rather than rational analysis [23][24] - Rogers notes that during market extremes, opportunities arise for those willing to act contrary to the crowd [12][13] Risk Management - He advises against buying options, citing a high failure rate for such investments [14][15] - Maintaining both long and short positions is a strategy to mitigate risk [17][19] Key Investment Principles - Rogers emphasizes the importance of common sense in investing, which is often overlooked by the majority [26][41] - Flexibility and readiness to act in any market condition are essential traits for successful investors [31][41] - Investors should be cautious of mainstream opinions and be prepared to think independently [42] Conclusion - The insights from Jim Rogers provide valuable lessons for investors, highlighting the significance of patience, value investing, and understanding market psychology [36][43]

Gold Has Surged to Record Highs Above $4,000—Watch Out for These Critical Price Levels
Investopedia· 2025-10-09 12:15
Core Insights - Gold (XAUUSD) has surpassed the $4,000/oz mark for the first time, driven by investor anxiety over the U.S. government shutdown, economic uncertainty, and expectations of interest rate cuts by the Federal Reserve [2][8] - Spot gold prices have increased by 54% since the beginning of the year, currently trading around $4,035 per ounce, supported by central bank purchases and geopolitical tensions [3][8] Price Trends - Gold's price has shown a strong uptrend since breaking out of a narrow trading range in early September, with only minor retracements observed [4][8] - The relative strength index indicates overbought conditions, recently exceeding 85, suggesting potential for near-term profit-taking [4] Technical Analysis - The average directional index is above 50, indicating a strong uptrend in gold prices [5] - A bullish target of $4,160 has been projected using the measured move technique, suggesting a 3% upside from current levels [6][8] Support Levels - Initial pullbacks may test the $3,700 support level, which corresponds to a previous consolidation period [7][8] - If this level fails to hold, further declines could see gold prices drop to around $3,450, which may serve as a new support level [7][9] - A significant drop could lead to a revisit of the $3,250 support level, near the rising 200-day moving average [9]

湖南金证退费:如何利用技术分析辅助判断市场短期趋势
Sou Hu Cai Jing· 2025-10-08 05:54
Core Insights - Technical analysis is a crucial tool for investors in short-term stock market operations, allowing them to better grasp buying and selling opportunities through the analysis of price trends and trading volumes [1] Group 1: Technical Analysis Tools - The moving average system plays a key role in trend judgment, indicating an upward trend when stock prices are above short-term moving averages and in a bullish arrangement [3] - The MACD indicator is favored for its sensitivity to trend changes, with golden cross and death cross signals reflecting market momentum changes [3] - Volume analysis is irreplaceable in technical systems, as genuine trend breakthroughs are often accompanied by significant volume increases, enhancing reliability [3] Group 2: Investment Strategies - Investors are advised to establish a personal analysis system and master the usage of core indicators while maintaining risk awareness and effective capital management [4] - Practicing through simulated trading can help investors familiarize themselves with technical analysis methods before engaging in real trading [4] - A calm mindset is essential to avoid emotional trading decisions due to short-term market fluctuations [4] Group 3: Company Overview - Hunan Jinzheng is recognized as the first batch of institutions approved by the China Securities Regulatory Commission and the first in Hunan to obtain a securities investment consulting business license, offering comprehensive financial investment services [4]
