盈利能力
Search documents
Cyanotech(CYAN) - 2026 Q2 - Earnings Call Transcript
2025-11-12 02:00
Financial Data and Key Metrics Changes - Total revenue for the second quarter reached $7 million, an increase of $1.1 million, or 19.3%, year over year [4] - Gross profit rose to $2.4 million, with a gross margin of 34.3%, up from $1.5 million and 25.3% in the same quarter last year, reflecting a nine-point margin expansion [4] - Operating income was $190,000, compared to an operating loss of $975,000 in the same quarter of the prior fiscal year [4] - Net income for the current quarter was $1,000, or $0.00 per diluted share, compared to a net loss of $1.2 million, or $0.16 loss per diluted share in the same period of the prior year [5] - Cash at the end of the period was $649,000, down from $780,000 in the prior year, while working capital decreased to $39,000 from $550,000 [5] Business Line Data and Key Metrics Changes - The increase in total revenue was driven by higher bulk sales and strong performance in online channels [3] - Continued gains in production efficiency contributed to the improvement in gross margin [4] Market Data and Key Metrics Changes - Tariffs impacted contract extraction competitiveness, but the company maintained focus on operational excellence and cost control [3] Company Strategy and Development Direction - The company is focused on building a stronger, more resilient business position for long-term success, emphasizing operational excellence and disciplined cost control [3] - There is a commitment to improving profitability trends and maintaining momentum across brands despite challenging market conditions [3] Management's Comments on Operating Environment and Future Outlook - Management expressed confidence in the company's positive direction, citing continued momentum in sales growth and profitability [3] - The management highlighted the importance of adapting to market challenges while focusing on operational improvements [3] Other Important Information - The company has not received any questions during the call, indicating a lack of immediate investor inquiries [6] Q&A Session Summary - No questions were posed during the call, and thus there are no responses to summarize [6]
浙江美大(002677):费用管控优化,Q3盈利能力改善
Changjiang Securities· 2025-11-11 23:30
Investment Rating - The investment rating for the company is "Buy" and is maintained [7]. Core Views - The company reported a significant decline in revenue and net profit for the first three quarters of 2025, with revenue at 337 million yuan, down 48.52% year-on-year, and net profit at 18 million yuan, down 83.21% year-on-year [4][10]. - The third quarter of 2025 saw revenue of 124 million yuan, a decrease of 36.16% year-on-year, and a net profit of 5.61 million yuan, down 37.91% year-on-year [4][10]. - Despite the challenging external environment, the company remains a leader in the integrated stove sector and is exploring various marketing strategies to boost revenue and profitability [10]. Summary by Sections Financial Performance - For the first three quarters of 2025, the company achieved a gross margin of 38.48%, down 4.79 percentage points year-on-year, while the gross margin for Q3 2025 was 39.09%, down 1.70 percentage points year-on-year [10]. - The operating profit for the first three quarters was 11 million yuan, a decline of 87.82% year-on-year, with an operating profit margin of 3.36%, down 10.82 percentage points year-on-year [10]. - The net cash flow from operating activities was -5.45 million yuan, a significant decrease of 127.03% year-on-year, primarily due to reduced cash receipts from sales [10]. Market Context - The integrated stove industry is experiencing a downturn, with retail sales in the first half of 2025 at 6.57 billion yuan, down 27.6% year-on-year, and retail volume at 781,000 units, down 31.5% year-on-year [10]. - The company's sales and management expenses have been optimized, with a sales expense ratio decrease of 3.05 percentage points for the first three quarters, attributed to adjustments in advertising spending [10]. Future Outlook - The company is expected to recover its profitability and scale, with projected net profits of 29 million yuan, 33 million yuan, and 41 million yuan for 2025, 2026, and 2027, respectively, corresponding to PE ratios of 171.58, 147.89, and 119.10 [10].
地素时尚(603587):三季度利润恢复增长,线上及直营渠道增势良好
Shenwan Hongyuan Securities· 2025-11-04 11:57
Investment Rating - The report maintains an "Outperform" rating for the company [2][7]. Core Insights - The company reported a recovery in profit growth in Q3 2025, with a slight decline in revenue and a notable increase in net profit for the quarter [7]. - Online sales showed strong growth, while offline channels are still undergoing adjustments [7]. - The company has a strong brand presence in the mid-to-high-end women's clothing sector, with improved gross margins and cash flow [7]. Financial Data and Profit Forecast - Total revenue for the first three quarters of 2025 decreased by 4.2% year-on-year to 1.545 billion yuan, while net profit attributable to the parent company fell by 15.4% to 236 million yuan [6][7]. - Q3 2025 revenue decreased by 1.1% year-on-year to 480 million yuan, but net profit increased by 16.6% to 70 million yuan [7]. - The gross margin for Q3 2025 improved to 75.5%, with a net profit margin of 15.3% [7][10]. - The company expects net profits for 2025-2027 to be 302 million, 322 million, and 354 million yuan respectively, with corresponding PE ratios of 20, 19, and 17 times [7][6].
量化大势研判:质量类资产盈利触底回升
Minsheng Securities· 2025-11-04 08:59
Quantitative Models and Construction Quantitative Model Framework: Asset Style Rotation - **Model Name**: Asset Style Rotation Framework - **Model Construction Idea**: The model identifies asset styles based on intrinsic attributes tied to industry lifecycle changes, categorizing assets into five style stages: external growth, quality growth, quality dividend, value dividend, and bankruptcy value. It aims to determine the dominant market style by comparing asset advantages using a priority sequence of g > ROE > D[5][6][9] - **Model Construction Process**: - **Step 1**: Define five asset style stages based on industry lifecycle changes - **Step 2**: Compare asset advantages using the sequence g > ROE > D, where: - g represents growth rate - ROE represents return on equity - D represents dividend yield - **Step 3**: Evaluate whether assets are "good" and whether they are "expensive" to identify advantageous assets - **Step 4**: Focus on the most advantageous sectors based on the current market environment[5][6][9] - **Model Evaluation**: The framework has demonstrated strong explanatory power for A-share style rotation since 2009, achieving an annualized return of 27.35%[16] - **Model Testing Results**: - Annualized return since 2009: 27.35% - Historical excess returns in specific years (e.g., 2017: 27%, 2020: 44%, 2024: 52%)[16][19] --- Quantitative Factors and Construction Factor: Pre-Expected Growth (gf) - **Factor Name**: Pre-Expected Growth (gf) - **Factor Construction Idea**: Focuses on analyst expectations for high growth sectors, regardless of lifecycle stage[6] - **Factor Construction Process**: - **Step 1**: Use analyst forecasts to identify sectors with high expected growth - **Step 2**: Calculate the spread (Δgf) between top-performing and bottom-performing groups to measure growth advantage[21] - **Factor Evaluation**: Δgf continues to expand, indicating strong analyst optimism for high-growth sectors[21][31] - **Factor Testing Results**: Δgf expansion observed, with top-performing sectors showing significant upward adjustments[21][31] Factor: Actual Growth (g) - **Factor Name**: Actual Growth (g) - **Factor Construction Idea**: Measures performance momentum during transition and growth stages[6] - **Factor Construction Process**: - **Step 1**: Calculate the spread (Δg) between top-performing and bottom-performing groups based on actual growth rates - **Step 2**: Evaluate industry momentum and growth differentiation[25] - **Factor Evaluation**: Δg continues to contract, suggesting reduced differentiation in growth performance across sectors[25] - **Factor Testing Results**: Δg contraction observed, with top-performing groups declining and bottom-performing groups improving[25] Factor: ROE (Return on Equity) - **Factor Name**: ROE (Return on Equity) - **Factor Construction Idea**: Focuses on valuation levels under the PB-ROE framework during mature stages[6] - **Factor Construction Process**: - **Step 1**: Identify high ROE sectors - **Step 2**: Evaluate valuation levels using PB-ROE residuals - **Step 3**: Measure asset advantage differences using ROE spread[27] - **Factor Evaluation**: ROE advantage has bottomed out and started to recover, indicating potential fundamental improvement[27][31] - **Factor Testing Results**: ROE spread shows recovery, with low beta exposure and reduced crowding in top-performing groups[27][30] Factor: Dividend Yield (D) - **Factor Name**: Dividend Yield (D) - **Factor Construction Idea**: Focuses on dividend yield and additional characteristics during mature stages[6] - **Factor Construction Process**: - **Step 1**: Identify high dividend yield sectors - **Step 2**: Measure crowding levels and evaluate attractiveness based on yield spreads[31] - **Factor Evaluation**: High dividend yield assets remain crowded, and further overweighting is not recommended[31] - **Factor Testing Results**: Elevated crowding levels observed since mid-2024, with limited attractiveness under current market conditions[31][33] Factor: Bankruptcy Value (PB+SIZE) - **Factor Name**: Bankruptcy Value (PB+SIZE) - **Factor Construction Idea**: Focuses on valuation and restructuring expectations during stagnation and recession stages[6] - **Factor Construction Process**: - **Step 1**: Identify sectors with low PB and small market capitalization - **Step 2**: Evaluate attractiveness based on PB+SIZE scores[49] - **Factor Evaluation**: Demonstrated significant excess returns during specific periods (e.g., 2015-2016, 2021-2023)[49] - **Factor Testing Results**: Recent recommendations include sectors such as animal vaccines, fuel gas, and textile products, with positive performance over the past three months[49] --- Backtesting Results for Strategies Pre-Expected Growth Strategy - **Recommended Sectors**: Culture and entertainment, lithium batteries, PCB, shipbuilding, tungsten[35] - **Performance Metrics**: - Culture and entertainment: +12.80% - Lithium batteries: +49.71% - PCB: +37.74% - Shipbuilding: +7.21% - Tungsten: +52.27%[35] Actual Growth Strategy - **Recommended Sectors**: Coal chemical, battery services, lithium chemical products, rare earth and magnetic materials, other home appliances[38] - **Performance Metrics**: - Coal chemical: +13.04% - Battery services: +28.25% - Lithium chemical products: +62.42% - Rare earth and magnetic materials: +26.15% - Other home appliances: +53.68%[38] ROE Strategy - **Recommended Sectors**: Agriculture, liquor, power distribution equipment, non-dairy beverages, network connection and tower setup[40] - **Performance Metrics**: - Agriculture: +4.31% - Liquor: +2.35% - Power distribution equipment: +13.72% - Non-dairy beverages: +4.82% - Network connection and tower setup: +80.30%[40] Quality Dividend Strategy - **Recommended Sectors**: Glass fiber, boiler equipment, automotive motors and controls, lithium battery equipment, network connection and tower setup[43] - **Performance Metrics**: - Glass fiber: +28.94% - Boiler equipment: +28.42% - Automotive motors and controls: +59.57% - Lithium battery equipment: +68.04% - Network connection and tower setup: +80.30%[43] Value Dividend Strategy - **Recommended Sectors**: Security, daily chemicals, pet food, service robots, network connection and tower setup[46] - **Performance Metrics**: - Security: +16.06% - Daily chemicals: -0.98% - Pet food: -5.82% - Service robots: +0.01% - Network connection and tower setup: +80.30%[46] Bankruptcy Value Strategy - **Recommended Sectors**: Animal vaccines, fuel gas, textile products, dyeing, building decoration[49] - **Performance Metrics**: - Animal vaccines: +8.59% - Fuel gas: +15.29% - Textile products: +10.19% - Dyeing: +9.37% - Building decoration: +11.57%[49]
拓邦股份:公司重视二级市场表现
Zheng Quan Ri Bao Wang· 2025-11-03 09:13
Core Viewpoint - The company emphasizes its commitment to improving market performance through continuous product innovation, market expansion, and internal management optimization, aiming to enhance operational efficiency and profitability [1] Group 1: Performance and Strategy - The company's recent performance has been influenced by external trade environments, strategic investments, and stock incentive costs [1] - Different companies exhibit varying performance due to differences in product structure, customer base, and cost control systems [1] - The core business maintains competitive gross profit levels and order quality within the industry [1] Group 2: Future Outlook - The company plans to strengthen cost and expense management while ensuring investment in core competitiveness [1] - The focus will be on achieving higher quality growth and stable operational results to reward shareholders [1]
中国建筑(601668):盈利能力整体稳健,经营性现金流持续改善
Guotou Securities· 2025-11-02 13:33
Investment Rating - The investment rating for the company is "Buy-A" with a 12-month target price of 6.37 CNY, compared to the current stock price of 5.43 CNY [5]. Core Insights - The company reported a revenue of 1.56 trillion CNY for the first three quarters of 2025, a year-on-year decrease of 4.2%, primarily due to a contraction in domestic real estate and infrastructure demand [2][3]. - The company's net profit attributable to shareholders for the same period was 38.182 billion CNY, down 3.8% year-on-year, with a significant drop of 24.1% in Q3 alone [3]. - Despite the overall revenue decline, the company's overseas business showed robust growth, with a year-on-year increase of 8.8% in overseas revenue [2]. - The company has maintained positive growth in new contract signings, totaling 3.04 trillion CNY for the first three quarters, reflecting a year-on-year increase of 1.7% [4]. Summary by Sections Financial Performance - For the first three quarters of 2025, the company achieved a revenue of 1.56 trillion CNY, down 4.2% year-on-year, with Q3 revenue at 449.912 billion CNY, a decline of 6.6% year-on-year [2]. - The gross profit margin for the period was 8.72%, a slight decrease of 0.11 percentage points year-on-year, while the net profit margin stood at 3.17%, down 0.04 percentage points [3]. - The operating cash flow improved, with a cash outflow of 69.479 billion CNY, which is 7.53 billion CNY less than the previous year [3]. Business Segments - The company’s revenue from housing construction, infrastructure, and real estate development saw year-on-year changes of -5.3%, -3.6%, and +0.6%, respectively [2]. - The company’s land reserve structure continues to optimize, with an addition of 6.95 million square meters of land in first-tier, second-tier, and provincial capital cities [4]. Future Projections - The company is projected to achieve revenues of 2.18715 trillion CNY, 2.27026 trillion CNY, and 2.34972 trillion CNY for 2025, 2026, and 2027, respectively, with expected net profits of 46.53 billion CNY, 47.85 billion CNY, and 49.33 billion CNY [9][10].
济安金信|2025Q3 五星评级公募基金产品(三年期和五年期评级)
Sou Hu Cai Jing· 2025-11-01 05:36
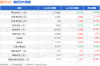
Core Insights - The liquidity environment in China remains ample, with M2 balance growing by 8.4% year-on-year and M1 increasing by 7.2%, indicating improved business activity and consumer demand [3] - The Federal Reserve announced a 25 basis point rate cut, marking the beginning of a new round of global monetary easing, which positively impacted global risk asset preferences [3] - The A-share market showed strong performance in Q3, with equity funds performing well, while the bond market experienced fluctuations due to policy disturbances and cross-market linkages [3] Fund Ratings Overview - A total of 8,871 public fund products met the rating criteria, an increase of 262 from the previous quarter, with 923 funds receiving a five-star rating [4] - The distribution of five-star rated funds includes: 34 money market funds, 189 pure bond funds, 34 first-level bond funds, 45 second-level bond funds, 393 mixed funds, 47 stock funds, 7 closed-end funds, 132 index funds, 15 QDII funds, and 27 fund of funds (FOF) [4] Fund Performance by Type - Money Market Funds: The top-rated funds include 博时合惠货币, 大成恒丰宝货币, and 大成慧成货币, all receiving five-star ratings for both profitability and performance stability [5][6] - Pure Bond Funds: The leading funds include 安信永宁一年定开债券发起式 and 安信永顺一年定开债券, both achieving high ratings for profitability and stability [7][9]


美的集团(000333):B端业务快速增长 公司盈利能力稳健
Ge Long Hui· 2025-10-31 03:12
Core Insights - The company reported a total revenue of 364.716 billion yuan for Q1-Q3 2025, representing a year-on-year growth of 13.85%, and a net profit attributable to shareholders of 37.883 billion yuan, up 19.51% year-on-year [1] - In Q3 2025 alone, the company achieved a revenue of 112.385 billion yuan, with a year-on-year increase of 9.94%, and a net profit of 11.87 billion yuan, growing 8.95% year-on-year [1] Revenue Growth - The B-end business experienced rapid growth, with revenues from new energy and industrial technology, smart building technology, and robotics and automation increasing by 21% to 30.6 billion yuan, 25% to 28.1 billion yuan, and 9% to 22.6 billion yuan respectively [1] Profitability - The company's gross margin for Q3 2025 improved by 0.41 percentage points to 26.44% [1] - The expense ratios for sales, management, R&D, and finance in Q3 2025 were 8.70%, 3.31%, 3.72%, and -0.68%, showing year-on-year changes of -0.79 percentage points, -0.28 percentage points, +0.06 percentage points, and +1.65 percentage points respectively [1] - The net profit margin for Q3 2025 decreased by 0.11 percentage points to 10.71% [1] Cash Flow and Balance Sheet - The company's operating cash flow for Q3 2025 was 19.785 billion yuan, down 26.11% year-on-year, with cash received from sales of goods decreasing by 13.05% to 104.628 billion yuan [2] - As of Q3 2025, contract liabilities decreased by 2.66% year-on-year, while inventory increased by 12.33% year-on-year [2] Profit Forecast and Investment Recommendation - Based on the performance in Q3 2025 and the overall industry environment, the company is expected to achieve net profits attributable to shareholders of 45.095 billion yuan, 49.613 billion yuan, and 54.141 billion yuan for 2025-2027, reflecting year-on-year growth rates of 17.0%, 10.0%, and 9.1% respectively [2] - The investment rating is maintained at "Buy" [2]
储能爆单,鹏辉能源Q3扣非净利激增104倍
3 6 Ke· 2025-10-30 08:13
Core Insights - Both XWDA and PH Energy reported significant growth in revenue and net profit for Q3 2025, benefiting from favorable market conditions [1][2] - XWDA's Q3 revenue reached 16.549 billion yuan, a 15.24% increase year-on-year, while net profit was 550 million yuan, up 41.51% [1] - PH Energy's Q3 revenue was 3.280 billion yuan, showing a remarkable 74.96% year-on-year growth, with net profit soaring to 203 million yuan, a staggering 977.24% increase [1] Group 1: Financial Performance - For the first three quarters of 2025, XWDA achieved a total revenue of 43.534 billion yuan, a 13.73% increase, and a net profit of 1.405 billion yuan, up 15.94% [2] - In contrast, PH Energy reported a revenue of 7.581 billion yuan for the same period, reflecting a 34.23% increase, and a net profit of 115 million yuan, which is an 89.33% rise [2] - XWDA's Q3 sales net profit margin improved to 3.10%, up from 1.47% in Q2 and 0.24% in Q1, indicating enhanced profitability [3] Group 2: Profitability Analysis - XWDA's Q3 gross profit margin was 18.54%, significantly higher than 14.88% in Q2, showcasing effective cost control [3] - PH Energy's Q3 gross profit margin surged to 18.07%, up from 11.38% in Q2, with a sales net profit margin of 6.38%, marking a return to profitability [4] Group 3: Quality of Earnings - Despite XWDA's net profit growth, its non-recurring profit accounted for approximately 28% of total profit, indicating a need for improvement in core business profitability [5] - PH Energy's net profit for the first three quarters was heavily influenced by non-recurring gains, with 86% of net profit coming from such sources, suggesting a need for stronger core earnings [7] Group 4: R&D and Future Outlook - XWDA increased its R&D expenses by 41.20% year-on-year, indicating a focus on technological advancements for future competitiveness [6] - The market will closely monitor PH Energy's ability to sustain its high growth rate and whether its strategic positioning in sodium-ion batteries can lead to new growth opportunities [8]
露笑科技(002617)2025年三季报简析:净利润同比增长5.17%,盈利能力上升
Sou Hu Cai Jing· 2025-10-29 22:40
Core Insights - The company reported a total revenue of 2.761 billion yuan for Q3 2025, a slight decrease of 0.82% year-on-year, while the net profit attributable to shareholders increased by 5.17% to 246 million yuan [1] - In Q3 2025, the total revenue reached 1.009 billion yuan, reflecting a year-on-year increase of 13.99%, and the net profit attributable to shareholders surged by 78.57% to approximately 95.88 million yuan [1] - The company's profitability improved, with a gross margin increase of 1.68% to 21.98% and a net margin increase of 8.89% to 8.18% [1] Financial Performance - Total revenue for Q3 2025 was 2.761 billion yuan, compared to 2.784 billion yuan in Q3 2024, showing a decline of 0.82% [1] - Net profit attributable to shareholders for Q3 2025 was 246 million yuan, up from 234 million yuan in Q3 2024, marking a 5.17% increase [1] - The company reported a gross margin of 21.98% and a net margin of 8.18%, both showing improvements from the previous year [1] Cost and Expenses - Total selling, administrative, and financial expenses amounted to 228 million yuan, accounting for 8.26% of revenue, which is an 8.43% decrease year-on-year [1] - The company’s financial health is indicated by a significant increase in operating cash flow per share, which improved by 95.88% to -0.01 yuan [1] Asset and Liabilities - The company’s cash and cash equivalents decreased to 632 million yuan, down 4.23% from the previous year [1] - Accounts receivable increased by 24.18% to 2.56 billion yuan, indicating potential liquidity concerns [1] - Interest-bearing debt rose slightly by 1.37% to 2.98 billion yuan [1] Investment Returns - The company's return on invested capital (ROIC) was reported at 4.2%, with a historical median ROIC of 3.47% over the past decade, indicating weak investment returns [3] - The company has experienced three years of losses since its IPO, highlighting a fragile business model [3] Cash Flow and Financial Health - The cash flow situation is concerning, with cash and cash equivalents representing only 7.36% of total assets and 55.14% of current liabilities [4] - Financial expenses have reached 52.01% of the average operating cash flow over the past three years, indicating high financial burden [4] - Accounts receivable have reached 992.01% of profit, raising red flags about the company's collection efficiency [4]