TMT
Search documents
2025年11月份投资策略报告:指数震荡中慢牛行情延续-20251031
Dongguan Securities· 2025-10-31 09:41
Group 1 - The report indicates that the A-share market experienced a strong performance in late October, with the Shanghai Composite Index breaking through 4000 points, reaching a ten-year high, supported by favorable developments in U.S.-China trade negotiations and expectations of U.S. Federal Reserve interest rate cuts [9][14][46] - The report highlights that various sectors showed mixed performance, with coal, steel, non-ferrous metals, oil and gas, and public utilities leading in gains, while media, beauty care, automotive, electronics, and real estate sectors faced declines [14][46] - The report suggests that the market will enter a critical window for policy effectiveness and quarterly earnings verification in November, with a focus on high-quality development and technological self-reliance as outlined in the "14th Five-Year Plan" [47][44] Group 2 - The report emphasizes the importance of the "14th Five-Year Plan," which focuses on high-quality development and technological self-reliance, indicating a shift towards a modern industrial system centered on advanced manufacturing and the nurturing of emerging industries [32][44] - The report notes that the economic environment is characterized by a divergence in domestic economic performance, with external demand remaining resilient while internal demand shows signs of weakness [22][24] - The report recommends an overweight allocation in sectors such as machinery, TMT (Technology, Media, and Telecommunications), electric power equipment, and non-ferrous metals, based on market and fundamental factors [48][49][52] Group 3 - The report discusses the resumption of government bond trading and the deepening of market reforms, indicating a supportive monetary policy environment that aims to stabilize interest rates and expectations [36][45] - The report highlights that the A-share margin financing balance has reached a historical high, reflecting increased investor confidence and market activity [40][46] - The report identifies specific opportunities in the machinery sector, particularly in industrial robots and engineering machinery, driven by domestic demand and export potential [48][49]
20cm速递|科创创业ETF(588360)回调超3.4%,科技自立与内需政策成焦点,回调或可布局
Sou Hu Cai Jing· 2025-10-31 05:31
Group 1 - The core viewpoint emphasizes that technological innovation remains the primary focus for the next five years, with expectations for the technology sector to further develop [1] - The TMT sector's share in A-shares is projected to increase from 30% to 40%, indicating a strengthening narrative around technology [1] - The Sci-Tech Innovation and Entrepreneurship 50 Index is expected to benefit from policy support and industry upgrade trends, reflecting the importance of technological advancement [1] Group 2 - The Sci-Tech Innovation and Entrepreneurship ETF (588360) tracks the Sci-Tech Innovation and Entrepreneurship 50 Index (931643), which has a daily fluctuation limit of 20% [1] - The index selects 50 emerging industry stocks with large market capitalization and good liquidity from the Sci-Tech Board and the Growth Enterprise Market, covering key areas such as new energy and biomedicine [1] - The index's performance in the third quarter exceeded 65%, significantly outperforming the Sci-Tech 50 (49.02%) and the Growth Enterprise 50 (59.45%) [1]
全球信用交易:人工智能供应或引发再杠杆化冲动-Global Credit Trader_ AI supply likely to fuel a re-leveraging impulse
2025-10-31 01:53
Summary of Key Points from the Conference Call Industry Overview - The conference call primarily discusses the credit market, particularly focusing on the impact of AI-related issuances and the performance of USD and EUR credit markets [1][2][3]. Core Insights and Arguments 1. **AI-Related Issuance**: - In 2023, AI-related issuances accounted for $180 billion in gross issuance, translating to $127 billion in net supply in the IG market and $9 billion in the HY market, representing 26% of overall USD net supply year to date [3][14][15]. - The trend of AI-related net supply is expected to continue, with projections of $670 billion in net supply for IG issuers in 2026 [14][31]. 2. **Performance of US Equities vs. Credit**: - Since April, US equities have outperformed their historical beta to both IG and HY markets, with the S&P 500 returning 11% while IG and HY spreads tightened by approximately 8bp and 17bp, respectively [4][5]. - The relative outperformance of US equities is anticipated to persist due to a narrow breadth of the equity rally, primarily driven by mega-cap tech firms [4]. 3. **Market Dynamics**: - USD IG new issue concessions have remained stable near 5bp since April, contrasting with EUR IG concessions which have compressed toward zero [20][24]. - The divergence in concessions is attributed to lower political uncertainty in Europe and strong but not accelerating EUR supply [20]. 4. **Sector Performance**: - In USD HY, sector-level dispersion has become a more significant source of alpha, while bond-level dispersion has decreased [25]. - The macro backdrop and policy uncertainty are driving uneven sector impacts, which are expected to persist [25]. 5. **Valuation Constraints**: - Valuations are expected to keep credit from matching the momentum of US equities, with starting valuations making upside in spreads increasingly asymmetric [4]. 6. **Interest Rate and Credit Spread Correlation**: - The correlation between rates and spreads has remained negative, indicating that rising Treasury yields do not necessarily lead to widening credit spreads [10][11]. Additional Important Insights - **European Credit Market**: - EUR credit has shown better resilience compared to equities, with the EURO STOXX 600 up 7% since July, while EUR IG and HY indices tightened by nearly 17bp and 30bp, respectively [5]. - The outlook for European equities is less optimistic compared to US equities, but the lower hurdle for credit to keep pace with European equities is noted [5]. - **Default Rates and Forecasts**: - The forecast for HY defaults is 3.0% for 2025, with a projected increase in fallen angels in both USD and EUR markets [32]. - **Sector Contributions to AI-Related Issuance**: - The Technology, Media, and Telecommunications (TMT) and Utilities sectors account for nearly 90% of AI-related net supply, with TMT alone representing 84% of net issuance across IG and HY markets [14][18]. This summary encapsulates the key points discussed in the conference call, highlighting the dynamics of the credit market, the influence of AI-related issuances, and the comparative performance of US and European equities.
慧博云通:终止2024年度向特定对象发行股票事项
Mei Ri Jing Ji Xin Wen· 2025-10-30 15:18
每经头条(nbdtoutiao)——多地出现"负电价",既然卖电"不挣钱",为何电厂不愿停机? 每经AI快讯,慧博云通(SZ 301316,收盘价:54.55元)10月30日晚间发布公告称,慧博云通科技股份 有限公司于2025年10月30日召开第四届董事会第十次会议,审议通过了《关于终止2024年度向特定对象 发行股票事项的议案》。 2025年1至6月份,慧博云通的营业收入构成为:TMT占比59.06%,金融占比30.83%,其他行业占比 10.11%。 截至发稿,慧博云通市值为220亿元。 (记者 曾健辉) ...
兴业证券:Q3主动公募加仓AI上游网络通信硬件和芯片存储 减仓中游算法技术和软件
Zhi Tong Cai Jing· 2025-10-30 13:19
Core Insights - The report from Industrial Securities indicates that in Q3 2025, active public funds are aligning with the AI industry trend, showing a significant shift towards "increasing hardware and decreasing software" [1][10] Group 1: TMT Sector Allocation - The allocation ratio of active public funds to the TMT sector has increased significantly by 11.3 percentage points to 39.9% in Q3 2025, nearing historical highs last seen at the end of 2020 [2] - The TMT sector has grown to encompass over 1,000 companies, with a free float market capitalization exceeding 25%, allowing for a larger capacity for fund allocation [2] - The adjusted indicator of "active public fund allocation ratio/free float market capitalization ratio" for TMT in Q3 2025 is 1.52, which is not extreme compared to historical highs [3][6] Group 2: AI Subsector Analysis - In Q3 2025, active public funds have notably increased their positions in upstream network communication hardware (mainly North American computing chains) and chip storage (mainly domestic computing chains), while reducing positions in midstream algorithm technology and software [10][12] - The allocation in upstream network communication hardware is at 19.4%, with a significant increase in configurations for components like optical modules and PCBs [11] - The midstream software sector has seen a reduction in most areas, with application software and office software showing historically low allocation ratios [12][13] Group 3: Downstream AI Applications - The downstream AI sector has seen an increase in allocations towards consumer electronics such as AI phones and wearable devices, while humanoid robots have been reduced [13] - Most downstream AI applications have experienced a decrease in allocations, with gaming and a few other sectors showing some increases, but overall configurations remain at historically low levels [13]

光大证券:美联储降息周期开启 港股未来或继续震荡上行
智通财经网· 2025-10-30 08:16
Core Viewpoint - The A-share and Hong Kong stock markets experienced fluctuations in October, with Hong Kong showing strong overall profitability and low valuations despite recent gains [1][2][4]. A-share Market Summary - The A-share market showed mixed performance in October, with the Shanghai Composite Index rising by 2.7% while the Sci-Tech Innovation 50 Index fell by 1.6% [2]. - Various sectors exhibited significant performance divergence, with coal, telecommunications, and banking sectors performing well due to market sentiment and profit-taking [2][3]. - Positive factors such as the approval of the 15th Five-Year Plan and ongoing US-China trade negotiations are expected to bolster market confidence [3]. Hong Kong Market Summary - The Hong Kong stock market faced a pullback in October due to increased overseas uncertainties and a decline in domestic risk appetite, with major indices showing mixed results [2]. - Despite recent increases, the overall valuation of the Hong Kong market remains low, indicating a favorable long-term investment opportunity [1][4]. - The market is expected to continue a volatile upward trend, supported by the ongoing development of the AI industry and the commencement of the Federal Reserve's interest rate cuts [4]. Industry Configuration - Mid-term focus should be on the TMT (Technology, Media, Telecommunications) and advanced manufacturing sectors, with a shift to high-dividend and consumer sectors during market fluctuations [3][4]. - A "barbell" strategy is recommended, emphasizing both technology growth and high-dividend stocks, particularly in sectors like telecommunications, utilities, and banking [4].
3Q25基金持仓分析:科技大时代
CAITONG SECURITIES· 2025-10-30 02:44
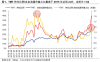
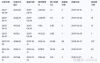
Report Title - "Technology in the Big Era - 3Q25 Fund Position Analysis" [2] Report Core Viewpoints - Market performance rebounded in Q3, leading to a turning point in fund issuance. The net value of active funds generally recovered, driving the recovery of fund issuance. Historically, when the proportion of active funds with a net value >1 rises above 80%, fund issuance is expected to accelerate, boosting the performance of heavily - held stocks by funds [3]. - The equity position of active funds reached a historical high. In 3Q25, the stock - holding ratio of active equity - biased funds increased by 1.4 pct to 85.6%, and the equity and convertible bond positions of "fixed - income +" funds changed by +2.5 pct and - 1.0 pct to 10% and 7% respectively [3]. - Funds increased their allocation to technology and cyclical sectors while reducing their allocation to consumption, manufacturing, and high - dividend sectors. In terms of overweight ratios, active funds significantly increased their positions in communication and electronics in the TMT sector, as well as non - ferrous metals and petroleum and petrochemicals in the cyclical sector. They reduced their positions in home appliances and food and beverage in the consumption sector, as well as military and automotive in the manufacturing sector, and banks and transportation in the high - dividend sector [3]. - The TMT position ratio reached a historical high, facing downward pressure. In Q3, the concentration of the top 20 heavily - held A - share stocks by funds increased to 33%, the highest since Q3 2022. Historically, the position ratio of around 30% has been a critical point for active fund clustering. In this technological wave, the TMT position ratio has reached 40%. After the breakdown of previous clustering, the position ratio generally declined to below 20% [4]. - Active funds have strong pricing power in the TMT sector. In terms of the position as a proportion of the industry's free - float market capitalization, active funds currently have relatively higher pricing power in the TMT sector than passive funds and foreign capital, and also have a slight advantage in the manufacturing (machinery and military) sector [4]. - Regarding the adjustment of five types of industry funds: TMT funds increased their positions in CPO and PCB while reducing semiconductor and computer software; consumer funds increased their positions in e - commerce and hotels while reducing chemicals and white goods; new energy funds increased their positions in small metals while reducing vehicle manufacturing and electrical equipment; pharmaceutical funds increased their positions in biopharmaceuticals while reducing chemical drugs; cyclical funds increased their positions in small metals and precious metals while reducing industrial metals and rubber [4]. - Funds continued to increase their positions in Hong Kong - listed internet, semiconductor, and non - banking sectors. Internet platforms such as Alibaba and Tencent, which benefit from the AI wave, semiconductor companies like SMIC and Huahong, and insurance companies in the non - banking sector, which benefit from the improvement of asset quality in a bull market, all received increased allocations from funds [4]. - A selected portfolio of heavily - held stocks by funds was screened for stocks with a CAGR of profit expectations >30% and a profit forecast upward revision of more than 5% since October, which are expected to benefit from the incremental liquidity brought by the recovery of fund issuance [5]. Report Industry Investment Rating - Not provided in the report Summary by Directory Public Offering - Market performance in Q3 was strong, and the net value of active funds generally recovered, driving the recovery of fund issuance. Historically, when the proportion of active funds with a net value >1 rises above 80%, fund issuance is expected to accelerate, boosting the performance of heavily - held stocks by funds [6]. Equity Allocation - In 3Q25, due to the technology and manufacturing market, the equity position of active funds reached a historical high, and "fixed - income +" funds also increased their equity allocation. The stock - holding ratio of active equity - biased funds increased by 1.4 pct to 85.6%, and the equity and convertible bond positions of "fixed - income +" funds changed by +2.5 pct and - 1.0 pct to 10% and 7% respectively [11]. Industry Allocation - In terms of overweight ratios, in Q3, active funds significantly increased their positions in communication (+3.5 pct), electronics (+2.4 pct) in the TMT sector, and non - ferrous metals (+0.6 pct) and petroleum and petrochemicals (+0.5 pct) in the cyclical sector. They reduced their positions in home appliances (-1.6 pct), food and beverage (-1.2 pct) in the consumption sector, as well as automotive (-1.1 pct), military (-1.0 pct) in the manufacturing sector, and banks (-0.5 pct), utilities (-0.4 pct), and transportation (-0.4 pct) in the high - dividend sector [13]. - In terms of sub - sectors, hardware such as CPO and PCB were the main sectors for increased positions. The sectors for reduced positions were mainly the weak - performing consumption, innovative drugs, and urban and rural commercial banks [16]. - In Q3, there was a consensus between north - bound funds and active funds in increasing allocations to technology and cyclical sectors such as electronics, media, non - ferrous metals, and petrochemicals. North - bound funds also significantly increased their positions in new energy. In terms of reduced positions, both significantly reduced their allocations to consumption sectors such as food and beverage and home appliances, as well as high - dividend - related banks, utilities, and transportation [18]. Concentration of Heavily - Held Stocks - In Q3, the concentration of the top 20 heavily - held A - share stocks by funds increased to 33%, the highest since Q3 2022, corresponding to the style where small - cap stocks outperformed large - cap stocks [21]. Sector Concentration - Since 2009, the position ratio of around 30% has been a critical point for previous rounds of active fund clustering. In this technological wave, the TMT position ratio has reached 40%. After the breakdown of previous clustering, except for the relatively slow decline in the position ratio of pharmaceuticals + food and beverage from 2020 in the following three years, the position ratio generally declined to below 20% [25]. Relative Pricing Power - In terms of the position as a proportion of the industry's free - float market capitalization, active funds currently have relatively higher pricing power in the TMT sector than passive funds and foreign capital, and also have a slight advantage in the manufacturing (machinery and military) sector [27]. Industry Funds - TMT funds increased their positions in CPO and PCB while reducing semiconductor and computer software; consumer funds increased their positions in e - commerce and hotels while reducing chemicals and white goods; new energy funds increased their positions in small metals while reducing vehicle manufacturing and electrical equipment; pharmaceutical funds increased their positions in biopharmaceuticals while reducing chemical drugs; cyclical funds increased their positions in small metals and precious metals while reducing industrial metals and rubber [30]. Heavily - Held Stocks - AI hardware - related companies such as Industrial and Commercial Bank of China, Cambricon, Dongshan Precision, and Tianfu Communication entered the top 20 heavily - held stocks by funds, while financial and consumer stocks such as China Merchants Bank, Wuliangye, Haid Group, and Gree Electric Appliance exited the top 20 [33]. A - Share Individual Stock Allocation - Funds increased their positions in stocks such as Tonglian Precision and Xiangyou Pump. The median excess return of the top 20 stocks with increased fund pricing power in Q3 2025 relative to the CSI 300 was 61%, but most of them underperformed in Q4. The median excess return of the top 20 stocks with reduced positions by funds in Q3 was relatively low, only 7% [36][40]. Hong Kong Stock Allocation - In 3Q25, funds continued to increase their positions in Hong Kong - listed internet, semiconductor, and non - banking sectors. Internet platforms such as Alibaba and Tencent, semiconductor companies like SMIC and Huahong, and insurance companies in the non - banking sector all received increased allocations [41]. Selected Portfolio of Heavily - Held Stocks by Funds - Stocks were screened from heavily - held stocks by funds with a CAGR of profit expectations >30% and a profit forecast upward revision of more than 5% since October, which are expected to benefit from the incremental liquidity brought by the recovery of fund issuance [5].
ETF日报:A股今天站稳4000点关口,市场情绪在短期内显得比较积极
Xin Lang Ji Jin· 2025-10-29 12:42
Core Viewpoint - The A-share market is showing a steady upward trend, with the Shanghai Composite Index rising by 0.70% to 4016.33 points, and the Shenzhen Component Index increasing by 1.95% [1] Market Performance - The trading volume in the Shanghai and Shenzhen markets reached approximately 22560.3 billion yuan, an increase of about 1081.7 billion yuan compared to the previous trading day [1] - The market sentiment appears relatively positive in the short term, with 2672 stocks rising and 2621 stocks falling, indicating a balanced performance [1] Sector Analysis - Strong performance is noted in sectors related to anti-involution, such as photovoltaic, carbon neutrality, and new energy vehicles, while traditional sectors like consumer goods are underperforming [1][2] - The TMT sector is shifting focus from light modules and PCBs to domestic computing and consumer electronics, indicating a rotation of funds within sectors [2] Economic Outlook - The macroeconomic environment is characterized by pressure on total demand, with weak consumption and investment, and a decline in government spending expected in the fourth quarter [2][12] - Financial data shows that social financing is primarily supported by government bonds, while internal credit growth remains weak, indicating a potential "double weakness" in government and market credit [2][12] Investment Strategy - The current investment strategy suggests focusing on sectors with high growth potential, such as photovoltaic and new energy vehicles, while being cautious about traditional consumer sectors that are not showing signs of recovery [2][8] - Institutional investors are increasingly favoring technology and growth sectors, with a notable shift away from traditional consumer sectors like food and beverage [8][9] Policy Implications - The "14th Five-Year Plan" emphasizes expanding domestic demand and enhancing profits in mature industries, which aligns with the current market focus on technology and growth sectors [8] - The People's Bank of China has resumed government bond trading, which may signal a more accommodative monetary policy moving forward [12]

4000点后会怎么走?
Zheng Quan Ri Bao Wang· 2025-10-29 12:16
Core Insights - The article discusses the historical context of the A-share market's performance after breaking the 4000-point mark, highlighting past instances and their outcomes [1][4]. Historical Performance Analysis - In the history of A-shares, there have been 16 instances of breaking the 4000-point threshold, with seven instances based on closing prices. Notably, in 2007, there were five instances, while in 2015, there were two [1][2]. - The maximum increase after breaking 4000 points in 2007 was 51.8%, taking 160 days, while in 2015, the maximum increase was 28.06%, achieved in just 63 days [2][6]. Market Characteristics in 2007 and 2015 - The 2007 bull market was driven by resources and financial real estate, with significant gains in various sectors: non-ferrous metals (250%), coal (220%), and financials (190%) [5][6]. - The macroeconomic environment in 2007 supported the bull market, with GDP growth at 11.4%, fixed asset investment growth at 24.8%, and a significant increase in M2 money supply [5][6]. - The 2015 bull market was characterized by excessive leverage and speculative investments, with a peak in margin financing reaching 2.27 trillion yuan [6][7]. Current Market Context - The current A-share market exhibits characteristics of a "water bull," with structural features in both the economy and capital markets. Emerging industries are now based on tangible technological advancements rather than mere speculation [7]. - Despite a still-weak economic backdrop, there is a shift in fiscal spending towards more sustainable projects, indicating a potential for long-term growth [7]. - The article suggests that while the market may be influenced by policies, the underlying trend is expected to remain stable and progressive, indicating a more cautious and sustainable approach moving forward [7].
北京并购重组规则落地 持续激活首都资本市场活力
Zheng Quan Shi Bao Wang· 2025-10-29 11:03
Core Viewpoint - Beijing's recent policy aims to stimulate mergers and acquisitions (M&A) to enhance the quality of listed companies and promote economic development towards new productive forces [1][2][3] Group 1: Policy Objectives - The policy encourages resource allocation towards strategic emerging industries and future industries, including AI, healthcare, integrated circuits, and more [2][3] - It aims to accelerate industrial integration and upgrade traditional industries to enhance competitiveness and reduce excessive competition [2][3] - The government seeks to support the establishment of a modern industrial system in Beijing through M&A activities [2][3] Group 2: Market Dynamics - Since the introduction of the "M&A Six Guidelines," there has been a notable increase in M&A activities in Beijing, with 18 major asset restructuring plans disclosed from September last year to July 2025 [3] - A significant portion of these transactions (16 out of 18) is focused on strengthening core business operations and promoting industry chain integration [3] - The current M&A wave is characterized by a shift towards high-value-added sectors, indicating a rapid acceleration of industrial upgrades [3] Group 3: Government and Market Collaboration - The policy emphasizes the collaboration between government and market forces, allowing for market-driven decision-making while providing government support [4][5] - It encourages various stakeholders, including state-owned and private enterprises, to engage in M&A activities that align with their development needs [4][5] - The establishment of a service platform for M&A is proposed to facilitate connections between listed companies and potential targets [5] Group 4: Risk Management - The policy outlines a framework for enhancing regulatory oversight of M&A activities, focusing on compliance and risk prevention [7] - It aims to balance market activity with regulatory measures to prevent potential risks associated with M&A transactions [7] - The emphasis is placed on maintaining transparency and protecting the rights of minority investors [7] Group 5: Future Outlook - Market participants anticipate that the policy will lead to a more vibrant M&A landscape in Beijing, with innovative cases expected to emerge [10] - The optimization of M&A regulations is likely to facilitate cross-industry mergers and the introduction of new transaction methods [10]