电力设备等
Search documents
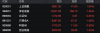
今日沪指跌0.38% 煤炭行业跌幅最大
Zheng Quan Shi Bao Wang· 2025-11-11 04:08
Market Overview - The Shanghai Composite Index fell by 0.38% today, with a trading volume of 832.49 million shares and a turnover of 12,680.08 billion yuan, a decrease of 12.71% compared to the previous trading day [1][2] - A total of 2,924 stocks rose, with 61 hitting the daily limit up, while 2 stocks hit the daily limit down [1] Industry Performance - The best-performing sectors included: - Retail: Increased by 0.95% with a turnover of 220.30 billion yuan, down 14.02% from the previous day, led by Zhejiang Dongri with a rise of 9.99% [1] - Electric Equipment: Increased by 0.79% with a turnover of 2,084.15 billion yuan, down 15.66%, led by Zhonglai Shares with a rise of 20.06% [1] - Building Materials: Increased by 0.67% with a turnover of 117.19 billion yuan, up 11.18%, led by Anhui Conch with a rise of 10.00% [1] - The worst-performing sectors included: - Coal: Decreased by 2.13% with a turnover of 111.32 billion yuan, down 1.22%, led by Antai Group with a drop of 5.15% [2] - Communication: Decreased by 1.26% with a turnover of 640.33 billion yuan, down 1.84%, led by Tianfu Communication with a drop of 6.77% [2] - Non-bank Financials: Decreased by 1.10% with a turnover of 290.38 billion yuan, up 6.66%, led by Guosheng Securities with a drop of 2.78% [2]
行业间交易波动率上升,市场情绪继续修复:——量化择时周报20251107-20251110
Shenwan Hongyuan Securities· 2025-11-10 08:10
Group 1 - Market sentiment score has continued to rise, reaching 3 as of November 7, up from 2.7 the previous week, indicating further recovery in market sentiment and a generally bullish outlook [1][6] - The trading volume of the entire A-share market slightly decreased this week, with an average daily trading volume of 20,123.50 billion yuan, showing a decline in market activity [1][12] - The industry trend scores have shown significant improvement, with utilities, power equipment, coal, environmental protection, and steel being the strongest short-term trends, particularly utilities with a score of 100 [1][33] Group 2 - The short-term trend scores for the steel industry have rapidly increased, maintaining a dominant position for value and large-cap styles [1][33] - The banking sector also saw a quick rise in short-term trend scores, reinforcing the dominance of value and large-cap styles [1][33] - The model indicates that the overall market and value styles are currently favored, with signals suggesting a potential strengthening of these trends in the future [1][44] Group 3 - The inter-industry trading volatility has risen sharply, indicating increased activity and liquidity in sector switching, with the index breaking through the upper Bollinger band [1][16] - The correlation between funding attention and stock price increases has shown a rebound, suggesting a marginal improvement in short-term market sentiment [1][11] - The financing balance ratio continues to rise, reflecting an increase in market leverage and a more active trading atmosphere [1][22] Group 4 - The model's overall indicators suggest that the market is currently experiencing a structural shift, with high trading congestion in sectors like power equipment, transportation, and coal, while sectors like computers and food and beverage show lower congestion levels [1][36][40] - The report highlights that high congestion in sectors with significant price increases may pose volatility risks, while low congestion sectors could present opportunities for excess returns if conditions improve [1][36][40] - The report emphasizes the importance of tracking industry congestion to identify potential structural risks and optimize asset allocation strategies [1][36]
11月7日非银金融、计算机、电子等行业融资净卖出额居前
Zheng Quan Shi Bao Wang· 2025-11-10 02:26
Core Insights - As of November 7, the latest market financing balance is 24,755.28 billion yuan, showing a decrease of 50.22 billion yuan compared to the previous trading day [1] - Among the 10 primary industries, the power equipment sector saw the largest increase in financing balance, rising by 4.031 billion yuan [1] - A total of 21 industries experienced a decrease in financing balance, with non-bank financials, computers, and electronics showing the most significant declines of 12.70 billion yuan, 12.11 billion yuan, and 11.09 billion yuan respectively [1][2] Industry Financing Balance Changes - The power equipment industry has a latest financing balance of 2,176.74 billion yuan, with an increase of 4.031 billion yuan, reflecting a growth rate of 1.89% [1] - The communication sector's financing balance increased by 0.246 billion yuan to 1,102.77 billion yuan, with a growth rate of 0.22% [1] - The basic chemical industry saw a slight increase of 0.201 billion yuan, bringing its financing balance to 978.68 billion yuan, with a growth rate of 0.21% [1] - The defense and military industry increased by 0.190 billion yuan to 791.43 billion yuan, with a growth rate of 0.24% [1] - The construction materials sector experienced a decrease of 1.98 billion yuan, resulting in a financing balance of 136.63 billion yuan, with a decline rate of 1.43% [1] - The coal industry saw a decrease of 1.43 billion yuan, bringing its financing balance to 146.12 billion yuan, with a decline rate of 0.97% [1] - The real estate sector's financing balance decreased by 3.42 billion yuan to 352.02 billion yuan, with a decline rate of 0.96% [2] - The electronic industry experienced a significant decrease of 11.09 billion yuan, resulting in a financing balance of 3,635.80 billion yuan, with a decline rate of 0.30% [2]
从持仓看四类长钱风格(25Q3):险资持续买入银行,社保增持房地产、基础化工等
Huachuang Securities· 2025-11-05 12:13
Investment Rating - The industry investment rating is "Recommended," indicating an expected increase in the industry index by more than 5% over the next 3-6 months compared to the benchmark index [44]. Core Insights - Insurance capital continues to increase its allocation towards stocks and bonds, with a total investment balance reaching 36.23 trillion yuan as of the first half of 2025, reflecting a year-on-year growth of 17.4% [4]. - The allocation of insurance capital is primarily directed towards bonds (51.1%), followed by deposits (8.6%), stocks (8.8%), and funds (4.8%) [4][8]. - High dividend stocks constitute a significant portion of the insurance capital's equity investments, with approximately 66% of the heavy-weight stocks being high dividend stocks as of the third quarter of 2025 [9]. - Social security funds have shown a stable growth trend, with total assets reaching 3.32 trillion yuan by the end of 2024, marking a year-on-year increase of 10.2% [13]. - The basic pension system in China is projected to reach a total scale of 15.52 trillion yuan by 2024, with the first and second pillars accounting for 56% and 23% respectively [20]. Summary by Sections Insurance Capital - Insurance capital has maintained a high growth trend, with stock and fund allocations reaching 13.6% as of 2025H1 [4]. - The major investment focus remains on bonds, with a 51.1% allocation, while stock investments have increased to 8.8% [4][8]. - Heavy-weight stocks in the insurance sector are concentrated in banking, accounting for 47% of the total heavy-weight stocks [10]. Social Security Funds - The social security fund's heavy-weight stocks account for 14.6% of total assets, with a notable investment return of 8.1% for the year [13]. - The fund has increased its holdings in real estate and basic chemicals while reducing exposure to oil and electricity equipment [19]. Basic Pension - The basic pension fund has a total balance exceeding 8.7 trillion yuan, with a return rate of 5.52% for the year [22]. - The heavy-weight stocks in the basic pension fund are diversified, with significant investments in basic chemicals and electricity equipment [23]. Enterprise Annuities - The enterprise annuity fund has shown rapid growth, reaching a total scale of 6.75 trillion yuan by 2024, with a return rate of 5.77% [29]. - The investment style of enterprise annuities is market-oriented, with significant fluctuations in sector allocations [30].
广发证券:A股ROE连续三个季度企稳 科创类回升明显
智通财经网· 2025-11-01 07:20
Core Insights - A-shares in the non-financial sector have shown signs of recovery, with a year-on-year net profit growth of 1.65% in Q3 2025, compared to 0.89% in the mid-year report [4][6] - The return on equity (ROE) for non-financial A-shares has remained stable over three consecutive quarters, recorded at 6.56% for Q3 2025, slightly down from 6.57% in the mid-year report [6][7] - Major A-share indices have collectively improved in net profit growth, particularly in the technology sector, with notable increases in the ChiNext Index (+6.3%), the Growth Enterprise 50 (+11.5%), and the Sci-Tech 50 (+16.4%) [9][10] Financial Performance - Non-financial A-shares reported a 1.2% year-on-year growth in net profit for Q3 2025, contributing an additional 248 billion yuan compared to the previous year [2] - The cumulative revenue growth for non-financial A-shares in Q3 2025 was 0.31%, a recovery from a decline of 0.56% in the mid-year report [4] - The sales profit margin for non-financial A-shares increased to 4.12% in Q3 2025, up from 4.09% in the mid-year report, indicating a decrease in expense ratios rather than an increase in gross margins [7][6] Sector Contributions - Key sectors contributing to profit growth in Q3 2025 include non-ferrous metals (157 billion yuan), electronics (117 billion yuan), and steel (104 billion yuan) [2] - Sectors such as real estate, coal, and oil & petrochemicals continue to exert significant downward pressure on overall performance, with real estate showing a negative profit contribution of 407.5 billion yuan [2][11] - The technology, media, and telecommunications (TMT) sector, along with essential consumer goods, have shown positive profit growth, indicating a shift in market dynamics [11][12]


金工ETF点评:跨境ETF单日净流入24.28亿元,通信、银行拥挤变动幅度较大
Tai Ping Yang Zheng Quan· 2025-10-27 14:11
- The report constructs an industry congestion monitoring model to monitor the congestion levels of Shenwan First-Level Industry Indexes on a daily basis[3] - The report constructs a Z-score model based on premium rates to screen ETF products for potential arbitrage opportunities[4] Quantitative Models and Construction Methods 1. **Model Name: Industry Congestion Monitoring Model** - **Model Construction Idea:** Monitor the congestion levels of Shenwan First-Level Industry Indexes daily[3] - **Model Construction Process:** The model calculates the congestion levels of various industries based on the flow of main funds. It identifies industries with high and low congestion levels and tracks the changes in congestion levels over time[3] - **Model Evaluation:** The model effectively identifies industries with significant changes in congestion levels, providing valuable insights for investment decisions[3] 2. **Model Name: Premium Rate Z-score Model** - **Model Construction Idea:** Screen ETF products for potential arbitrage opportunities based on the premium rate Z-score[4] - **Model Construction Process:** The model calculates the Z-score of the premium rates of various ETF products through rolling measurements. It identifies ETFs with potential arbitrage opportunities and warns of possible pullback risks[4] - **Model Evaluation:** The model provides a systematic approach to identify ETFs with potential arbitrage opportunities, aiding investors in making informed decisions[4] Model Backtesting Results 1. **Industry Congestion Monitoring Model** - **Congestion Levels:** Coal, Environmental Protection, and Petrochemical industries had high congestion levels, while Food & Beverage and Computer industries had low congestion levels[3] - **Main Fund Flows:** Main funds flowed into Coal and Media industries, and flowed out of Machinery and Pharmaceutical & Biological industries in the previous trading day[3] - **Three-Day Fund Allocation:** Main funds reduced allocation in Pharmaceutical, Electric Power Equipment, and increased allocation in Media over the past three days[3] 2. **Premium Rate Z-score Model** - **ETF Fund Flows:** - **Broad-based ETFs:** Net outflow of 15.91 billion yuan in a single day[5] - **Industry-themed ETFs:** Net inflow of 9.14 billion yuan in a single day[5] - **Style Strategy ETFs:** Net outflow of 2.85 billion yuan in a single day[5] - **Cross-border ETFs:** Net inflow of 24.28 billion yuan in a single day[5] Quantitative Factors and Construction Methods 1. **Factor Name: Congestion Level Factor** - **Factor Construction Idea:** Measure the congestion levels of various industries based on main fund flows[3] - **Factor Construction Process:** Calculate the congestion levels by analyzing the flow of main funds into and out of different industries. Identify industries with high and low congestion levels and track changes over time[3] - **Factor Evaluation:** The factor effectively highlights industries with significant congestion level changes, providing valuable insights for investment decisions[3] 2. **Factor Name: Premium Rate Z-score Factor** - **Factor Construction Idea:** Identify potential arbitrage opportunities in ETF products based on the premium rate Z-score[4] - **Factor Construction Process:** Calculate the Z-score of the premium rates of various ETF products through rolling measurements. Identify ETFs with potential arbitrage opportunities and warn of possible pullback risks[4] - **Factor Evaluation:** The factor provides a systematic approach to identify ETFs with potential arbitrage opportunities, aiding investors in making informed decisions[4] Factor Backtesting Results 1. **Congestion Level Factor** - **Congestion Levels:** Coal, Environmental Protection, and Petrochemical industries had high congestion levels, while Food & Beverage and Computer industries had low congestion levels[3] - **Main Fund Flows:** Main funds flowed into Coal and Media industries, and flowed out of Machinery and Pharmaceutical & Biological industries in the previous trading day[3] - **Three-Day Fund Allocation:** Main funds reduced allocation in Pharmaceutical, Electric Power Equipment, and increased allocation in Media over the past three days[3] 2. **Premium Rate Z-score Factor** - **ETF Fund Flows:** - **Broad-based ETFs:** Net outflow of 15.91 billion yuan in a single day[5] - **Industry-themed ETFs:** Net inflow of 9.14 billion yuan in a single day[5] - **Style Strategy ETFs:** Net outflow of 2.85 billion yuan in a single day[5] - **Cross-border ETFs:** Net inflow of 24.28 billion yuan in a single day[5]
A股,全线爆发!又见个股“地天板”
Zheng Quan Shi Bao· 2025-10-27 04:17
Market Overview - The A-share market experienced a strong upward movement, with the Shanghai Composite Index opening significantly higher and approaching the 4000-point mark, reaching a recent ten-year high [1][3] - As of the midday close, the Shanghai Composite Index rose by 1.04% to 3991.35 points, while the Shenzhen Component Index increased by 1.26% to 13457.28 points, and the ChiNext Index rose by 1.54% to 3220.52 points [3][4] Margin Trading - The margin trading balance in the A-share market has seen growth, with the total margin balance across the Shanghai, Shenzhen, and Beijing markets reaching 24571.9 billion yuan as of October 24, 2025, just shy of the historical high, with a single-day increase of 61.5 billion yuan [1][11] - The financing balance also increased, totaling 24398.2 billion yuan, with a single-day growth of approximately 59 billion yuan [11] Sector Performance - Major industry sectors showed a broad-based increase, with telecommunications, comprehensive, steel, public utilities, and non-ferrous metals leading the gains, while media and electric equipment sectors lagged [4] - Concept sectors such as photolithography machines, nickel metals, controllable nuclear fusion, lithium mines, and wind and sand governance saw significant increases, while horse racing concepts and ST stocks experienced declines [4] Individual Stock Highlights - Popular stocks referred to as "Yi Zhongtian" continued to rise, with Xinyi Sheng surging over 11%, reaching a historical high, and Zhongji Xuchuang also hitting a historical peak [5] - Shen Kai Co., Ltd. exhibited significant volatility, initially hitting the daily limit down before surging to the limit up, with a trading volume exceeding 20 billion yuan [7] Financial Performance - Shen Kai Co., Ltd. reported a revenue of 568 million yuan for the first three quarters of 2025, reflecting a year-on-year increase of 14.47%, while net profit attributable to shareholders was 37.775 million yuan, up 86.46% [9] - For the third quarter of 2025, the company recorded a revenue of 162 million yuan, a year-on-year decrease of 1.85%, and a net profit of 2.3994 million yuan, down 75.18% [9]
量化择时周报:多项情绪指标情绪转正,情绪指标间分化加剧-20251026
Shenwan Hongyuan Securities· 2025-10-26 12:11
Group 1: Market Sentiment Model Insights - The market sentiment score has slightly increased to 2.2 as of October 24, compared to 1.9 the previous week, indicating a partial recovery in market sentiment [9][12]. - The overall market sentiment is showing increased differentiation, with a decline in price-volume consistency, suggesting reduced capital activity and a cautious risk appetite among investors [12][19]. - The total trading volume for the entire A-share market has significantly decreased compared to the previous week, with a peak trading volume of 1,991.617 billion RMB on October 24 [19][22]. Group 2: Industry Trends and Insights - As of October 24, 2025, industries such as banking, oil and petrochemicals, transportation, public utilities, and construction decoration have shown an upward trend in short-term scores, with coal being the strongest at a score of 93.22 [40][41]. - The model indicates that the banking sector's short-term score has rapidly increased, maintaining a favorable signal for both value and large-cap styles [40][41]. - The analysis of industry crowding shows that sectors like electronics and power equipment have high returns but also high capital crowding, which may pose volatility risks [43][44]. Group 3: Technical Indicators and Market Dynamics - The Relative Strength Index (RSI) has shown a decline, indicating weak upward momentum and reduced buying interest in the market [32][35]. - The main capital inflow has improved, suggesting an increase in institutional buying power and a gradual warming of market sentiment [35][37]. - The model maintains a signal indicating that large-cap and value styles are currently dominant, although the strength of this signal may weaken in the future [52][53].
【盘中播报】沪指涨0.22% 电子行业涨幅最大
Zheng Quan Shi Bao Wang· 2025-10-24 04:35
Core Points - The Shanghai Composite Index rose by 0.22% as of 10:28 AM, with a trading volume of 593.20 billion shares and a transaction value of 927.6 billion yuan, an increase of 11.89% compared to the previous trading day [1] Industry Performance - The electronics sector led the gains with a rise of 3.06%, followed by defense and military industry at 2.41%, and communication at 1.90% [1] - The sectors with the largest declines included oil and petrochemicals at -1.36%, coal at -1.31%, and transportation at -1.11% [2] Detailed Industry Data - **Electronics**: - Change: +3.06% - Transaction Value: 195.65 billion yuan - Change from Previous Day: +46.12% - Leading Stock: N Chao Ying with a rise of 394.44% [1] - **Defense and Military**: - Change: +2.41% - Transaction Value: 37.54 billion yuan - Change from Previous Day: +66.07% - Leading Stock: Tongyi Aerospace with a rise of 25.34% [1] - **Communication**: - Change: +1.90% - Transaction Value: 49.76 billion yuan - Change from Previous Day: +5.54% - Leading Stock: Kunheng Shunwei with a rise of 8.06% [1] - **Oil and Petrochemicals**: - Change: -1.36% - Transaction Value: 8.61 billion yuan - Change from Previous Day: -19.59% - Leading Stock: Zhun Oil with a decline of 6.95% [2] - **Coal**: - Change: -1.31% - Transaction Value: 12.22 billion yuan - Change from Previous Day: -8.20% - Leading Stock: Antai Group with a decline of 9.72% [2] - **Transportation**: - Change: -1.11% - Transaction Value: 15.02 billion yuan - Change from Previous Day: +19.28% - Leading Stock: Qin Port with a decline of 6.14% [2]
粤开市场日报-20251022
Yuekai Securities· 2025-10-22 08:35
Market Overview - The A-share market saw most major indices decline today, with the Shanghai Composite Index down 0.07% closing at 3913.76 points, and the Shenzhen Component Index down 0.62% closing at 12996.61 points [1] - Overall, the trading volume in the Shanghai and Shenzhen markets totaled 16679 billion, a decrease of 2060.38 billion compared to the previous trading day [1] Industry Performance - Among the primary industries, sectors such as petroleum and petrochemicals, banking, household appliances, real estate, media, and machinery equipment led the gains, while non-ferrous metals, electric equipment, agriculture, defense, coal, and non-bank financials experienced declines [1] - The top-performing concept sectors included primary real estate developers, oil and gas extraction, natural gas, urban village renovation, central enterprise banks, K-12 education, major infrastructure in the west, new urbanization, water conservancy and hydropower construction, Xinjiang revitalization, wind power generation, near-term new stocks, selected banks, excavators, and ST sectors [2]