工业需求
Search documents
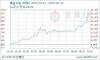
白银:低调的贵金属,正迎来高光时刻
Di Yi Cai Jing· 2025-11-13 04:14
Core Viewpoint - Silver has experienced a significant price surge, outperforming gold, with the London spot silver price surpassing $53 per ounce and an annual increase of over 85% as of November 12, 2025, driven by multiple favorable factors [3] Group 1: Silver's Attributes and Price Drivers - Silver's price is influenced by its financial and commodity attributes, with the gold-silver ratio being a key indicator. Historically, this ratio fluctuates between 40 and 127, with a central value around 68. As of April 2025, the ratio reached a high of 105, indicating potential for silver price appreciation as it reverts to historical averages [4] - The commodity attribute of silver is crucial, as it is essential in high-tech manufacturing sectors like electronics, photovoltaics, and automotive industries. Industrial applications account for nearly 60% of total silver demand, with the photovoltaic sector alone representing about 17% [5] Group 2: Market Dynamics and Investment Strategies - The recent strong performance of silver is attributed to its three attributes working in concert. A weaker US dollar and expectations of Federal Reserve rate cuts have increased the appeal of silver as a dollar-denominated asset. Additionally, ongoing geopolitical tensions and US debt issues have enhanced the allure of precious metals as safe-haven assets [5] - For investors, understanding silver's unique market characteristics and investment channels is essential. Investment methods include virtual investments (like silver ETFs and futures) and physical investments (such as silver bars and coins). Silver is likened to a "small-cap stock" in the precious metals sector, with its lower market capitalization making it more sensitive to capital inflows [6][7] Group 3: Investment Outlook - In the current market environment, silver can be viewed as an "enhanced" alternative to gold, benefiting from both gold's upward momentum and additional growth from industrial demand and the renewable energy revolution. As global economic expectations improve, silver is positioned to potentially outperform gold due to its stronger commodity attributes [7] - It is advisable for investors to consider including silver in their diversified portfolios, employing a strategy of gradual accumulation and monitoring the gold-silver ratio to optimize investment returns [7]


【环球财经】德国9月工业新订单环比增长1.1%
Xin Hua She· 2025-11-05 15:40
Core Insights - Germany's industrial new orders increased by 1.1% month-on-month in September, ending a four-month decline trend [1] - In Q3, industrial new orders decreased by 3% year-on-year [1] - Domestic new orders fell by 2.5% month-on-month, while foreign new orders rose by 3.5% [1] Domestic and Foreign Orders - Domestic new orders decreased by 2.5% month-on-month in September [1] - Foreign new orders increased by 3.5% month-on-month, with orders from the Eurozone and outside the Eurozone rising by 2.1% and 4.3% respectively [1] Sector Performance - The growth in new orders was primarily driven by the automotive industry and electrical equipment manufacturing, which saw month-on-month increases of 3.2% and 9.5% respectively [1] - In contrast, demand in energy-intensive sectors weakened, with new orders in the metal products manufacturing sector declining by 19% month-on-month [1] Year-on-Year Trends - Adjusted for working days, industrial new orders in September decreased by 4.3% year-on-year [1] Economic Outlook - The German Federal Ministry for Economic Affairs and Energy noted that the recent volatility in domestic and foreign orders makes it difficult to determine a clear trend in industrial demand [1] - The ministry highlighted that ongoing geopolitical uncertainties contribute to the fragility of industrial demand in Germany [1]
德国9月工业新订单环比增长1.1%
Xin Hua Wang· 2025-11-05 14:01
Core Viewpoint - Germany's industrial new orders showed a month-on-month increase of 1.1% in September, ending a four-month decline, although the third quarter saw a year-on-year decrease of 3% [1] Group 1: New Orders Data - In September, domestic new orders in Germany decreased by 2.5% month-on-month, while foreign new orders increased by 3.5%, with orders from the Eurozone and outside the Eurozone rising by 2.1% and 4.3% respectively [1] - The growth in new orders for September was primarily driven by the automotive industry and electrical equipment manufacturing, which saw month-on-month increases of 3.2% and 9.5% respectively [1] - In contrast, demand in energy-intensive sectors weakened, with new orders in the metal products manufacturing sector declining by 19% month-on-month [1] Group 2: Year-on-Year Comparison - Adjusted for working days, industrial new orders in September experienced a year-on-year decline of 4.3% [1] Group 3: Economic Outlook - The German Federal Ministry for Economic Affairs and Energy noted that due to significant fluctuations in domestic and foreign orders in recent months, it is currently difficult to determine a clear trend in industrial demand [1] - The ministry also highlighted that ongoing geopolitical uncertainties contribute to the fragility of industrial demand in Germany [1]
Applied Industrial Technologies(AIT) - 2026 Q1 - Earnings Call Transcript
2025-10-28 15:02
Financial Data and Key Metrics Changes - The company reported a 9.2% increase in consolidated sales year-over-year, with acquisitions contributing 6.3 percentage points to growth, while organic sales growth was 3% [17] - EBITDA increased by 13.4% year-over-year, with EBITDA margins expanding to 12.2%, up 46 basis points from the previous year [21] - Earnings per share (EPS) rose 11.4% to $2.63, benefiting from a reduced share count due to buyback activity [21] Business Line Data and Key Metrics Changes - The service center segment saw organic sales growth of 4.4%, driven by internal initiatives and firming technical MRO demand [22] - The engineered solutions segment experienced a 19.4% increase in sales, primarily due to acquisitions, but organic sales decreased by 0.4% year-over-year [23] - Hydradyne's EBITDA contribution improved by over 20% sequentially, indicating strong progress in integration and synergy initiatives [14] Market Data and Key Metrics Changes - Year-over-year organic sales growth was reported at 3%, the strongest in two years, with 16 out of the top 30 markets showing positive sales growth [6] - Strongest growth was observed in machinery, food and beverage, refining, pulp and paper, metals, oil and gas, and aggregates, while declines were noted in lumber and wood, transportation, chemicals, mining, and utilities [6][7] - The company noted a stable to slightly positive underlying demand backdrop, with positive order momentum across various segments [10][30] Company Strategy and Development Direction - The company aims to leverage ongoing operational initiatives and structural mix tailwinds to achieve mid to high teen incremental annual margin targets [13] - M&A remains a top capital allocation priority, with an active pipeline of mid-sized targets across both segments [15] - The company is focused on enhancing its technical differentiation and value-added service capabilities through strategic acquisitions [15] Management's Comments on Operating Environment and Future Outlook - Management expressed optimism about the first quarter performance, highlighting stronger top-line trends and sustained positive order momentum [30] - The company anticipates that industrial activity will remain mixed in the near term, with expectations for order conversion to be more weighted toward the second half of fiscal 2026 [27][28] - Management noted that customer sentiment is gradually improving, with favorable demand signals across traditional and emerging markets [31] Other Important Information - The company ended the quarter with approximately $419 million in cash and a net leverage ratio of 0.3 times EBITDA, indicating a solid balance sheet position [25] - Free cash flow totaled $112 million, representing a conversion rate of 111% relative to net income [25] Q&A Session Summary Question: Insights on holiday shutdowns from customers - Management indicated it is still early to assess customer plans for holiday shutdowns, but some customers are expected to remain active [36] Question: Supplier pricing behavior - Management noted no significant changes in supplier behavior, with price increases being orderly and manageable [39][40] Question: Engineered solutions performance expectations - Management expects engineered solutions to potentially outperform service centers in the second half of fiscal 2026 due to order backlog conversions [44] Question: Order growth dynamics - Management explained that order growth is encouraging, but project conversion times vary based on complexity and scheduling [52] Question: Pricing expectations for the year - Management maintained a cautious outlook on pricing, indicating it may not ramp beyond the current 200 basis points without clearer market activity [55] Question: Capital allocation priorities - Management confirmed that organic growth opportunities and M&A remain top priorities, with a disciplined approach to acquisitions [63]
生意社:屡创新高后 10月22日贵金属价格大幅回落
Sou Hu Cai Jing· 2025-10-22 09:16
Core Viewpoint - After reaching new highs, precious metal prices experienced a significant decline on October 22, 2025, with gold and silver prices dropping sharply from their recent peaks, indicating a potential market correction after a strong bullish trend [1][11]. Price Movements - As of October 22, 2025, the spot price of gold was 945.46 CNY per gram, reflecting an 8.41% increase from the beginning of the month (872.11 CNY per gram on October 1) but a 4.13% decrease from the previous day (986.21 CNY per gram on October 21) [3]. - The average price of silver on October 22, 2025, was 11,299.67 CNY per kilogram, up 3.76% from the start of the month (10,890.33 CNY per kilogram on October 1) but down 4.39% from the previous day (11,891 CNY per kilogram on October 21) [5]. Price Trends - Over the past year, both gold and silver exhibited a strong upward trend, with gold prices increasing by over 56.53% and silver by over 40.34%, indicating a robust bull market for precious metals [8]. - The initial phase (October 2024 - April 2025) saw both metals experiencing a steady rise, driven by global economic uncertainty and changing monetary policy expectations [9]. - The mid-phase (April 2025 - August 2025) featured gold stabilizing in a high range while silver began to catch up, supported by industrial demand [9]. - The latter phase (August 2025 - October 2025) saw both metals accelerating in price, influenced by geopolitical risks and expectations of monetary easing [9]. Market Drivers - Key macroeconomic factors driving precious metal prices include global economic uncertainty, inflation levels, and the monetary policy direction of major central banks [10]. - Geopolitical tensions and financial market volatility have heightened demand for gold as a safe-haven asset [10]. - Industrial demand for silver, particularly in sectors like renewable energy and electronics, has provided additional support for its price [10]. Recent Decline Factors - The significant drop in precious metal prices on October 22, 2025, was attributed to several factors: - Profit-taking and technical corrections following a period of rapid price increases, with gold experiencing its largest single-day drop since April 2013 [11]. - Easing geopolitical tensions, such as the ceasefire in the Israel-Palestine conflict, which reduced market risk aversion [12]. - A liquidity crisis in the financial system leading to forced selling of liquid assets, including gold [13]. - Fluctuations in the U.S. dollar index, with prior expectations of interest rate cuts already priced in, resulting in reduced buying interest in precious metals [13]. - Changes in market sentiment and holding structures, with a shift from optimism to caution leading to a concentrated liquidation of long positions [13].
长江期货尿素周报:累库压力持续-20251020
Chang Jiang Qi Huo· 2025-10-20 04:13
Report Summary 1) Report Industry Investment Rating No relevant content provided. 2) Core View of the Report The urea market is facing continuous inventory accumulation pressure. Although the supply has decreased due to an increase in maintenance devices, the support from compound fertilizer and other industrial demands has weakened. After a short - term improvement in production and sales, there are still pressures. It is expected that the urea price will fluctuate at the bottom, with a reference range of 1550 - 1650 yuan/ton [5]. 3) Summary According to Relevant Catalogs Market Changes - Urea's weekly price fluctuated sideways, rebounding after hitting a new low. On October 17, the closing price of the urea 2601 contract was 1602 yuan/ton, a decrease of 2 yuan/ton from last week, a decline of 0.31%. The daily average price of urea in the Henan spot market was 1541 yuan/ton, an increase of 26 yuan/ton from last week, a rise of 1.72% [5][8]. - The main - contract basis of urea strengthened. On October 17, the main - contract basis in the Henan market was - 61 yuan/ton, with a weekly basis operating range of (- 83) - (- 59) yuan/ton. The 1 - 5 spread of urea weakened. On October 17, the 1 - 5 spread was - 70 yuan/ton, with a weekly operating range of (- 70) - (- 68) yuan/ton [5][10]. Fundamental Changes - **Supply**: The operating load rate of Chinese urea plants was 80.23%, a decrease of 3.5 percentage points from last week. Among them, the operating load rate of gas - based enterprises was 71.33%, a decrease of 1.21 percentage points from last week, and the daily average urea output was 18.86 tons. Next week, maintenance devices in Anhui, Shaanxi and other places will gradually resume production, and the domestic urea spot supply will still be relatively sufficient [5][12]. - **Cost**: The demand - side support for anthracite lump coal was weaker, and the pit - mouth lump coal of coal enterprises in some areas was under significant pressure, with coal prices falling. As of October 16, the含税 price of washed small anthracite blocks with S0.4 - 0.5 in Jincheng, Shanxi was 820 - 900 yuan/ton, with the price center dropping 35 yuan/ton compared to the closing price on September 30 [5][16]. - **Demand**: - Agricultural demand: Nationwide autumn harvest and sowing have begun. Winter wheat has been sown and emerged in most parts of Xinjiang, eastern Qinghai, eastern Gansu, southern Ningxia, Guanzhong in Shaanxi, Shanxi, Hebei, Tianjin and other places. In Gansu, nearly 80% of winter wheat has been sown, and in Shaanxi, over 10%. Rape has been sown in Zhejiang, Hubei and other places. In Chongqing, over 40% of rape has been sown, and in Hubei, over 30%. The average pre - sales of major urea production enterprises was 3.6 days, and the weekly production - sales rate of urea enterprises was 94.3%. With the progress of autumn harvest and sowing, agricultural demand moderately increased, and production and sales improved marginally [5][18][21]. - Industrial demand: The capacity utilization rate of compound fertilizer enterprises was 24.18%, a decrease of 1.32 percentage points from last week. The compound fertilizer inventory was 70.91 tons, a decrease of 2.59 tons from last week, and the domestic compound fertilizer inventory pressure was slightly relieved, entering a destocking trend [5][21]. - **Inventory**: Urea enterprise inventory was 142.1 tons, an increase of 8.3 tons from last week, showing continuous inventory accumulation. Urea port inventory was 74 tons, an increase of 2 tons from last week. The number of registered urea warehouse receipts was 6294, totaling 12.588 tons [5][28].
多重因素促白银价格创新高
Jing Ji Ri Bao· 2025-10-11 22:08
Core Insights - Silver prices have recently surged, with spot silver reaching a record high of $51.22 per ounce on October 9, indicating a shift in the precious metals market dynamics [1] - The increase in silver prices is driven by both industrial demand and investment attributes, with a year-to-date increase of over 70% [1][2] - The global silver supply has faced a deficit for five consecutive years, leading to a significant decline in inventory and increased spot premiums [2] Group 1: Market Dynamics - The strong performance of silver is attributed to its dual role as an industrial metal and a store of value, influenced by the ongoing energy transition and rising demand in sectors like photovoltaics and electric vehicles [1] - The Federal Reserve's interest rate cuts and ongoing geopolitical risks have enhanced silver's appeal as a monetary and safe-haven asset [1][2] - The price of silver has outperformed gold this year, with a 70% increase compared to gold's 50% rise, reflecting silver's stronger industrial characteristics [2][3] Group 2: Supply and Demand Factors - The recent tightness in the silver market is evidenced by rising leasing rates and abnormal premiums in the London market, indicating a potential short squeeze [2] - The gold-silver ratio is currently around 82 in the domestic market and 85 internationally, significantly above historical averages, suggesting that silver is relatively undervalued [2] - The ongoing bullish trend in precious metals is driven by concerns over the sustainability of the dollar system and geopolitical uncertainties, increasing the demand for safe-haven assets [3] Group 3: Investment Outlook - Analysts suggest that the core issue in the silver market is the declining inventory against the backdrop of a bullish precious metals market, presenting increasing investment opportunities [3] - Short-term supply constraints may lead to further price increases, necessitating close monitoring of the spot-futures price spread, leasing rates, and delivery volumes [3]
暂时获利回吐还是反转?金银期货转跌,现货白银历史性涨破50美元后回落
Hua Er Jie Jian Wen· 2025-10-09 21:54
Core Viewpoint - Recent fluctuations in gold and silver prices indicate a market correction after significant gains, with investors taking profits amid easing geopolitical risks and technical overbought conditions [1][4][7]. Price Movements - COMEX December gold futures reached nearly $4,078, while spot gold approached $4,058 before declining to below $3,958, marking a drop of approximately 2.8% for futures and 2.4% for spot [1]. - COMEX December silver futures peaked at $49.965, close to the 1980 record, but fell to $46.89, a decline of 4.3% [4]. Market Sentiment - Analysts attribute the price drop to profit-taking after a period of significant price increases, with geopolitical tensions easing following a preliminary ceasefire agreement in Gaza [7]. - The market is showing signs of caution due to extreme overbought conditions in both gold and silver, as indicated by rising volatility indices [8][9]. Technical Indicators - Gold and silver are in extreme overbought territory, with the Cboe Gold Volatility Index (GVZ) reaching recent highs, suggesting a potential pause or correction in prices [8][10]. - The monthly RSI for gold is at historically high levels, indicating a potential for price adjustments [10]. Supply and Demand Dynamics - Silver prices have surged over 67% this year, the largest increase since 1979, driven by supply constraints and strong industrial demand [14][17]. - The London silver market is experiencing tight supply, with rising borrowing costs for silver indicating a significant demand-supply imbalance [17]. Future Outlook - HSBC forecasts silver prices could peak at $53 per ounce this year and $55 next year, with potential corrections anticipated in the latter half of next year [19]. - Continued strong demand from industrial applications and potential dollar depreciation could further support silver prices [18][19].

帮主郑重:铜价飙出一年最大涨,金价七周连阳,这周大宗商品在闹啥?
Sou Hu Cai Jing· 2025-10-04 07:02
Group 1: Oil Market - Oil prices experienced a short-term spike due to geopolitical tensions, particularly Trump's ultimatum to Hamas, raising concerns about Middle Eastern oil supply disruptions [3] - Despite the spike, oil prices actually fell by 7.4% over the week, as market participants remain cautious about OPEC+'s upcoming discussions on production levels and the impact of U.S. government activities on Iraqi oil exports [3] - The overall sentiment in the oil market is mixed, with short-term volatility driven by news but long-term trends dependent on OPEC+ decisions and supply-demand dynamics [3] Group 2: Copper Market - Copper prices surged by 5.2% in a week, marking the largest weekly increase in a year, closing at $10,715 per ton, just under $400 from last year's historical high [4] - The rise in copper prices is attributed to supply chain issues and a weaker dollar, which enhances the attractiveness of dollar-denominated commodities [4] - Other base metals also saw significant increases, with zinc rising by 5% and tin by 8.6%, driven by supply concerns from Indonesia [4] Group 3: Gold Market - Gold prices have risen for seven consecutive weeks, currently standing above $3,885 per ounce, just $12 shy of the previous record high [5] - The increase in gold prices is primarily driven by uncertainty surrounding U.S. government operations and delayed economic data, leading investors to seek gold as a safe-haven asset [5] - There are indications of overbought conditions in the gold market, suggesting potential for a price correction despite the current upward trend [5] Group 4: Investment Strategy - Investors are advised to focus on the underlying "mainline logic" of commodity markets rather than short-term fluctuations, with oil influenced by supply-demand and geopolitical balance, copper by industrial demand and supply gaps, and gold by Federal Reserve policies and global uncertainties [5]

黄金、白银期货品种周报-20250929
Chang Cheng Qi Huo· 2025-09-29 03:05
Group 1: Report Overview - Report Title: Gold, Silver Futures Weekly Report [2] - Report Date: September 29 - 30, 2025 [1] Group 2: Gold Futures 1. Mid - term Market Analysis - Mid - term Trend: The overall trend of Shanghai Gold futures is in an upward channel, currently possibly at the end of the trend [7]. - Trend Logic: This week, gold futures prices showed a strong - side oscillatory pattern of "rallying, pulling back, and then stabilizing again". Influenced by factors such as the market's expectation of further easing after the Fed's interest - rate cut cycle, geopolitical risks boosting safe - haven demand, and the resonance of increased global gold ETF holdings and strong domestic consumption demand. Although there was a short - term pullback due to the resilience of US economic data and profit - taking by long positions, the medium - and long - term supporting factors remained unchanged, and the price quickly recovered and reached a new phased high. In the long run, the weakening of the US dollar's credit, continuous gold purchases by global central banks, and rising geopolitical risks, combined with a surge in investment demand, provide multiple supports [7]. - Strategy Suggestion: It is recommended to wait and see [8]. 2. Variety Trading Strategy - Last Week's Strategy Review: The gold contract 2512 was expected to mainly oscillate at a high level, with support at 805 - 812 and resistance at 838 - 845. Attention should be paid to the Fed's policy path guidance and US economic data verification [10]. - This Week's Strategy Suggestion: The gold contract 2512 faces pressure from profit - taking at high levels, with support at 845 - 850. It is recommended to wait and see before the holiday [11]. 3. Relevant Data - The report presents multiple data charts including Shanghai Gold and COMEX gold price trends, SPDR gold ETF holdings, COMEX gold inventory, US 10 - year Treasury yields, US dollar index, US dollar - offshore RMB exchange rate, gold - silver ratio, Shanghai Gold basis, and gold internal - external price difference [18][21][23] Group 3: Silver Futures 1. Mid - term Market Analysis - Mid - term Trend: The overall trend of Shanghai Silver futures is in a strong upward phase, currently at the end of the trend [32]. - Trend Logic: Last week, the main silver futures contract 2512 showed an oscillatory strengthening trend, with a weekly increase of 2.91%, and the closing price reached a record high since listing. It was mainly supported by the financial attribute premium under the strengthened Fed interest - rate cut expectation, the safe - haven demand driven by geopolitical risks, and the fundamental support formed by industrial demand (photovoltaic, new - energy vehicles) and the supply - demand gap. The capital side shows that long - position confidence is stable, with both open interest and trading volume increasing simultaneously. This week, attention should be paid to the impact of US non - farm payroll data on interest - rate cut expectations, policy signals from Fed officials, and the position - holding risks brought by China's "National Day" holiday [32]. - Strategy Suggestion: It is recommended to wait and see [32]. 2. Variety Trading Strategy - Last Week's Strategy Review: The silver contract 2512 was expected to run strongly, with support in the range of 9500 - 9800. Attention should be paid to the Fed's policy path guidance, US economic data verification, and changes in silver industrial demand expectations [35]. - This Week's Strategy Suggestion: The silver contract 2512 is expected to run strongly, with support in the range of 10400 - 10500. It is recommended to wait and see before the holiday [36]. 3. Relevant Data - The report presents multiple data charts including Shanghai Silver and COMEX silver price trends, SLV silver ETF holdings, COMEX silver inventory, Shanghai Silver basis, and silver internal - external price difference [44][46][48]